Estimated zip code population in 2022: 8,581 Zip code population in 2010: 8,017 Zip code population in 2000: 6,585
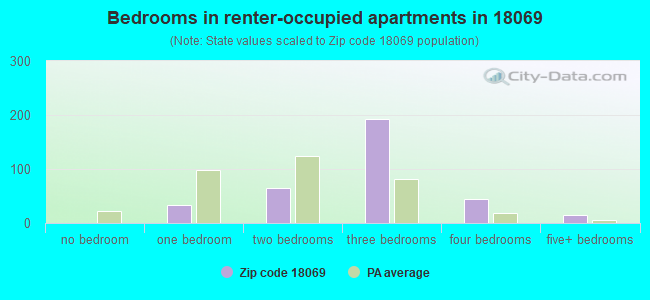
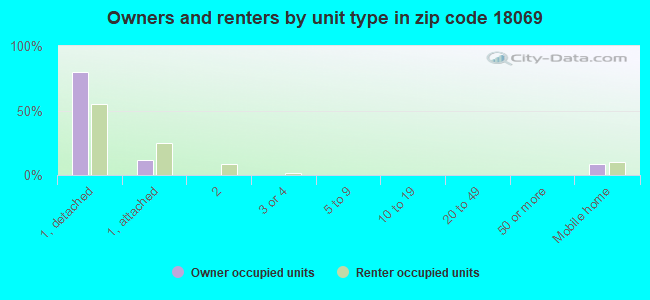
Houses and condos: 3,258 Renter-occupied apartments: 361
% of renters here:
11%
State:
31%
March 2022 cost of living index in zip code 18069: 102.0 (near average, U.S. average is 100)
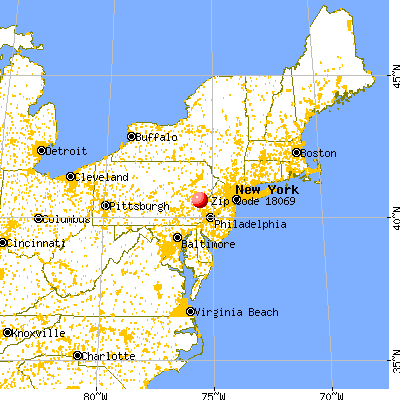
Land area: 13.8 sq. mi. Water area: 0.1 sq. mi.
Population density: 621 people per square mile
(low).
OSM Map
General Map
Google Map
MSN Map
OSM Map
General Map
Google Map
MSN Map
OSM Map
General Map
Google Map
MSN Map
OSM Map
General Map
Google Map
MSN Map
Please wait while loading the map...
Real estate property taxes paid for housing units in 2022:
This zip code:
1.3% ($5,438)
Pennsylvania:
1.3% ($3,094)
Median real estate property taxes paid for housing units with mortgages in 2022: $5,733 (1.3%) Median real estate property taxes paid for housing units with no mortgage in 2022: $5,045 (1.5%)
Business Search- 14 Million verified businesses
Males: 4,307
(50.2%)
Females: 4,273
(49.8%)
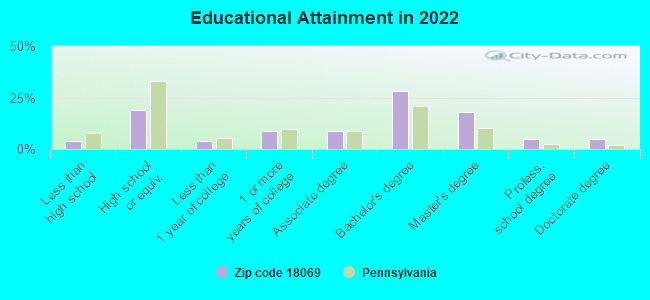
For population 25 years and over in 18069:
High school or higher: 97.0%
Bachelor's degree or higher: 56.1%
Graduate or professional degree: 27.8%
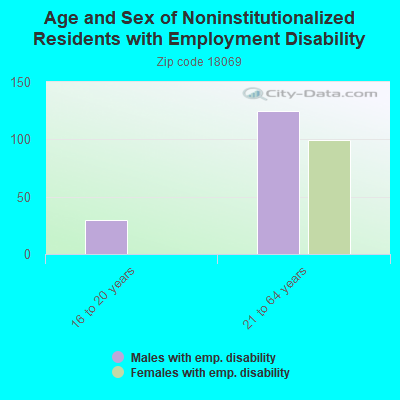
Unemployed: 2.7%
Mean travel time to work (commute): 25.9 minutes
For population 15 years and over in 18069:
Never married: 24.0%
Now married: 64.5%
Separated: 1.0%
Widowed: 5.1%
Divorced: 5.4%
Zip code 18069 compared to state average:
Median household income above state average.
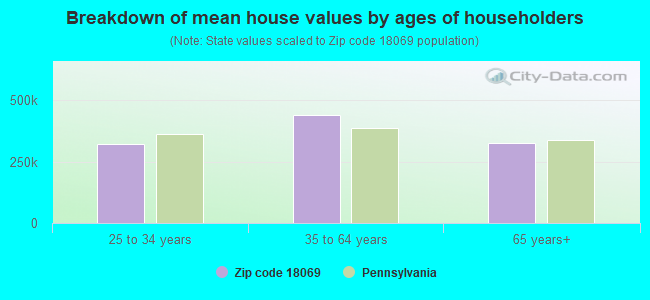
Median house value above state average.
Black race population percentage significantly below state average.
Median age above state average.
Renting percentage significantly below state average.
Length of stay since moving in significantly above state average.
Number of rooms per house above state average.
House age below state average.
Percentage of population with a bachelor's degree or higher above state average.
Estimated median house/condo value in 2022: $404,283
18069:
$404,283
Pennsylvania:
$245,500
According to our research of Pennsylvania and other state lists, there were 6 registered sex offenders living in 18069 zip code as of July 03, 2024. The ratio of all residents to sex offenders in zip code 18069 is 1,340 to 1. The ratio of registered sex offenders to all residents in this zip code is lower than the state average.
Median resident age:
This zip code:
47.0 years
Pennsylvania median age:
40.9 years
Average household size:
This zip code:
2.7 people
Pennsylvania:
2.4 people
Averages for the 2020 tax year for zip code 18069, filed in 2021:
Average Adjusted Gross Income (AGI) in 2020: $121,854 (Individual Income Tax Returns)
Here:
$121,854
State:
$75,707
Salary/wage: $95,242 (reported on 80.5% of returns)
Here:
$95,242
State:
$62,806
(% of AGI for various income ranges: 1146.1% for AGIs below $25k, 3456.9% for AGIs $25k-50k, 6293.2% for AGIs $50k-75k, 9831.7% for AGIs $75k-100k, 19242.7% for AGIs $100k-200k, 101229.4% for AGIs over 200k)
Taxable interest for individuals: $2,223 (reported on 45.8% of returns)
This zip code:
$2,223
Pennsylvania:
$1,633
(% of AGI for various income ranges: 25.6% for AGIs below $25k, 34.4% for AGIs $25k-50k, 90.6% for AGIs $50k-75k, 77.4% for AGIs $75k-100k, 197.3% for AGIs $100k-200k, 1563.8% for AGIs over 200k)
Ordinary dividends: $9,155 (reported on 36.4% of returns)
Here:
$9,155
State:
$7,382
(% of AGI for various income ranges: 62.4% for AGIs below $25k, 74.6% for AGIs $25k-50k, 151.5% for AGIs $50k-75k, 299.1% for AGIs $75k-100k, 577.8% for AGIs $100k-200k, 5763.1% for AGIs over 200k)
Net capital gain/loss in AGI: +$37,734 (reported on 31.6% of returns)
Here:
+$37,734
State:
+$23,522
(% of AGI for various income ranges: 27.6% for AGIs below $25k, 61.9% for AGIs $25k-50k, 130.3% for AGIs $50k-75k, 353.9% for AGIs $75k-100k, 750.4% for AGIs $100k-200k, 27683.7% for AGIs over 200k)
Profit/loss from business: +$25,900 (reported on 14.5% of returns)
Here:
+$25,900
State:
+$16,274
(% of AGI for various income ranges: 78.6% for AGIs below $25k, 170.2% for AGIs $25k-50k, 123.2% for AGIs $50k-75k, 416.1% for AGIs $75k-100k, 576.2% for AGIs $100k-200k, 6354.4% for AGIs over 200k)
Taxable individual retirement arrangement distribution: $22,064 (reported on 13.3% of returns)
18069:
$22,064
Pennsylvania:
$18,583
(% of AGI for various income ranges: 87.7% for AGIs below $25k, 145.0% for AGIs $25k-50k, 281.8% for AGIs $50k-75k, 620.9% for AGIs $75k-100k, 1076.2% for AGIs $100k-200k, 2233.1% for AGIs over 200k)
Self-employed (Keogh) retirement plans: $20,080 (reported on 1.2% of returns)
18069:
$20,080
Pennsylvania:
$25,407
(% of AGI for various income ranges: 627.5% for AGIs over 200k)
Total itemized deductions: $40,758 (reported on 11.6% of returns)
Here:
$40,758
State:
$34,850
(% of AGI for various income ranges: 232.5% for AGIs $25k-50k, 282.4% for AGIs $50k-75k, 549.1% for AGIs $75k-100k, 1145.8% for AGIs $100k-200k, 6860.0% for AGIs over 200k)
Charity contributions: $12,954 (reported on 9.9% of returns)
Here:
$12,954
State:
$12,392
(% of AGI for various income ranges: 9.8% for AGIs $25k-50k, 37.9% for AGIs $50k-75k, 89.1% for AGIs $75k-100k, 250.4% for AGIs $100k-200k, 2374.4% for AGIs over 200k)
Taxes paid: $8,925 (reported on 11.6% of returns)
18069:
$8,925
State:
$8,200
(% of AGI for various income ranges: 41.5% for AGIs $25k-50k, 105.3% for AGIs $50k-75k, 155.7% for AGIs $75k-100k, 362.4% for AGIs $100k-200k, 1075.6% for AGIs over 200k)
Earned income credit: $1,906 (reported on 7.7% of returns)
Here:
$1,906
State:
$2,100
(% of AGI for various income ranges: 46.2% for AGIs below $25k, 58.7% for AGIs $25k-50k)
Percentage of individuals using paid preparers for their 2020 taxes: 91.1%
Here:
91%
State:
92%
(% for various income ranges: 90.5% for AGIs below $25k, 91.4% for AGIs $25k-50k, 90.0% for AGIs $50k-75k, 92.1% for AGIs $75k-100k, 89.3% for AGIs $100k-200k, 94.7% for AGIs over 200k)
Averages for the 2012 tax year for zip code 18069, filed in 2013:
Average Adjusted Gross Income (AGI) in 2012: $97,812 (Individual Income Tax Returns)
Here:
$97,812
State:
$61,346
Salary/wage: $79,807 (reported on 85.0% of returns)
Here:
$79,807
State:
$51,902
(% of AGI for various income ranges: 69.2% for AGIs below $25k, 77.1% for AGIs $25k-50k, 72.4% for AGIs $50k-75k, 75.7% for AGIs $75k-100k, 81.2% for AGIs $100k-200k, 60.5% for AGIs over 200k)
Taxable interest for individuals: $1,466 (reported on 50.7% of returns)
This zip code:
$1,466
Pennsylvania:
$1,588
(% of AGI for various income ranges: 2.3% for AGIs below $25k, 1.0% for AGIs $25k-50k, 1.0% for AGIs $50k-75k, 0.8% for AGIs $75k-100k, 0.7% for AGIs $100k-200k, 0.6% for AGIs over 200k)
Ordinary dividends: $6,716 (reported on 38.5% of returns)
Here:
$6,716
State:
$5,827
(% of AGI for various income ranges: 4.5% for AGIs below $25k, 2.0% for AGIs $25k-50k, 2.0% for AGIs $50k-75k, 1.9% for AGIs $75k-100k, 1.7% for AGIs $100k-200k, 3.3% for AGIs over 200k)
Net capital gain/loss in AGI: +$15,268 (reported on 30.5% of returns)
Here:
+$15,268
State:
+$14,495
(% of AGI for various income ranges: 0.3% for AGIs $25k-50k, 0.5% for AGIs $50k-75k, 1.0% for AGIs $75k-100k, 1.1% for AGIs $100k-200k, 9.0% for AGIs over 200k)
Profit/loss from business: +$20,474 (reported on 13.2% of returns)
Here:
+$20,474
State:
+$16,268
(% of AGI for various income ranges: 4.8% for AGIs below $25k, 4.4% for AGIs $25k-50k, 3.2% for AGIs $50k-75k, 2.1% for AGIs $75k-100k, 3.0% for AGIs $100k-200k, 2.4% for AGIs over 200k)
Taxable individual retirement arrangement distribution: $19,519 (reported on 13.2% of returns)
18069:
$19,519
Pennsylvania:
$14,550
(% of AGI for various income ranges: 4.9% for AGIs below $25k, 3.8% for AGIs $25k-50k, 4.1% for AGIs $50k-75k, 4.0% for AGIs $75k-100k, 2.5% for AGIs $100k-200k, 1.9% for AGIs over 200k)
Self-employment retirement plans: $19,860 (reported on 1.2% of returns)
18069:
$19,860
Pennsylvania:
$20,922
(% of AGI for various income ranges: 1.1% for AGIs $75k-100k, 0.3% for AGIs over 200k)
Total itemized deductions: $27,384 (15% of AGI, reported on 44.8% of returns)
Here:
$27,384
State:
$23,538
Here:
15.2% of AGI
State:
18.4% of AGI
(% of AGI for various income ranges: 12.1% for AGIs below $25k, 9.7% for AGIs $25k-50k, 15.0% for AGIs $50k-75k, 15.8% for AGIs $75k-100k, 15.7% for AGIs $100k-200k, 10.3% for AGIs over 200k)
Charity contributions: $3,833 (reported on 39.8% of returns)
Here:
$3,833
State:
$4,025
(% of AGI for various income ranges: 0.8% for AGIs below $25k, 0.9% for AGIs $25k-50k, 1.3% for AGIs $50k-75k, 1.6% for AGIs $75k-100k, 1.7% for AGIs $100k-200k, 1.7% for AGIs over 200k)
Taxes paid: $12,838 (reported on 45.0% of returns)
18069:
$12,838
State:
$9,982
(% of AGI for various income ranges: 3.4% for AGIs below $25k, 3.3% for AGIs $25k-50k, 5.9% for AGIs $50k-75k, 6.2% for AGIs $75k-100k, 7.6% for AGIs $100k-200k, 5.4% for AGIs over 200k)
Earned income credit: $1,703 (reported on 7.8% of returns)
Here:
$1,703
State:
$2,106
(% of AGI for various income ranges: 2.7% for AGIs below $25k, 0.8% for AGIs $25k-50k)
Percentage of individuals using paid preparers for their 2012 taxes: 55.5%
Here:
56%
State:
53%
(% for various income ranges: 47.4% for AGIs below $25k, 52.2% for AGIs $25k-50k, 60.9% for AGIs $50k-75k, 61.9% for AGIs $75k-100k, 59.2% for AGIs $100k-200k, 69.2% for AGIs over 200k)
Averages for the 2004 tax year for zip code 18069, filed in 2005:
Average Adjusted Gross Income (AGI) in 2004: $77,179 (Individual Income Tax Returns)
Here:
$77,179
State:
$48,049
Salary/wage: $65,926 (reported on 84.5% of returns)
Here:
$65,926
State:
$42,646
(% of AGI for various income ranges: 151.2% for AGIs below $10k, 69.5% for AGIs $10k-25k, 74.3% for AGIs $25k-50k, 78.4% for AGIs $50k-75k, 88.0% for AGIs $75k-100k, 68.1% for AGIs over 100k)
Taxable interest for individuals: $1,976 (reported on 64.4% of returns)
This zip code:
$1,976
Pennsylvania:
$1,657
(% of AGI for various income ranges: 14.5% for AGIs below $10k, 4.1% for AGIs $10k-25k, 1.7% for AGIs $25k-50k, 1.7% for AGIs $50k-75k, 0.8% for AGIs $75k-100k, 1.5% for AGIs over 100k)
Taxable dividends: $2,687 (reported on 45.2% of returns)
Here:
$2,687
State:
$3,566
(% of AGI for various income ranges: 13.1% for AGIs below $10k, 3.3% for AGIs $10k-25k, 1.7% for AGIs $25k-50k, 1.1% for AGIs $50k-75k, 1.2% for AGIs $75k-100k, 1.5% for AGIs over 100k)
Net capital gain/loss: +$16,325 (reported on 37.2% of returns)
Here:
+$16,325
State:
+$9,716
(% of AGI for various income ranges: -9.6% for AGIs below $10k, 0.6% for AGIs $10k-25k, 0.3% for AGIs $25k-50k, -0.1% for AGIs $50k-75k, 0.3% for AGIs $75k-100k, 11.5% for AGIs over 100k)
Profit/loss from business: +$20,956 (reported on 14.8% of returns)
Here:
+$20,956
State:
+$14,267
(% of AGI for various income ranges: 7.9% for AGIs below $10k, 5.1% for AGIs $10k-25k, 2.7% for AGIs $25k-50k, 2.8% for AGIs $50k-75k, 1.9% for AGIs $75k-100k, 4.6% for AGIs over 100k)
IRA payment deduction: $3,222 (reported on 3.6% of returns)
18069:
$3,222
Pennsylvania:
$2,903
(% of AGI for various income ranges: 0.3% for AGIs $10k-25k, 0.4% for AGIs $25k-50k, 0.2% for AGIs $50k-75k, 0.2% for AGIs $75k-100k, 0.1% for AGIs over 100k)
Self-employed pension: $16,100 (reported on 1.7% of returns)
Here:
$16,100
Pennsylvania:
$14,674
Total itemized deductions: $24,567 (17% of AGI, reported on 44.6% of returns)
Here:
$24,567
State:
$18,804
Here:
17.0% of AGI
State:
19.5% of AGI
(% of AGI for various income ranges: 22.2% for AGIs below $10k, 12.2% for AGIs $10k-25k, 11.2% for AGIs $25k-50k, 14.8% for AGIs $50k-75k, 18.8% for AGIs $75k-100k, 13.8% for AGIs over 100k)
Charity contributions deductions: $4,073 (3% of AGI, reported on 41.9% of returns)
Here:
$4,073
State:
$3,337
Here:
2.7% of AGI
State:
3.3% of AGI
(% of AGI for various income ranges: 0.8% for AGIs below $10k, 1.0% for AGIs $10k-25k, 1.3% for AGIs $25k-50k, 1.4% for AGIs $50k-75k, 1.9% for AGIs $75k-100k, 2.6% for AGIs over 100k)
Total tax: $15,285 (reported on 78.9% of returns)
18069:
$15,285
State:
$8,008
(% of AGI for various income ranges: 5.4% for AGIs below $10k, 4.5% for AGIs $10k-25k, 7.4% for AGIs $25k-50k, 8.7% for AGIs $50k-75k, 9.2% for AGIs $75k-100k, 19.2% for AGIs over 100k)
Earned income credit: $1,586 (reported on 6.3% of returns)
Here:
$1,586
State:
$1,643
Percentage of individuals using paid preparers for their 2004 taxes: 55.1%
Here:
55%
State:
56%
(% for various income ranges: 50.1% for AGIs below $10k, 54.6% for AGIs $10k-25k, 55.1% for AGIs $25k-50k, 63.4% for AGIs $50k-75k, 54.0% for AGIs $75k-100k, 56.2% for AGIs over 100k)
Likely homosexual households (counted as self-reported same-sex unmarried-partner households)
Lesbian couples: 0.3% of all households
Gay men: 0.0% of all households
Household received Food Stamps/SNAP in the past 12 months: 80 Household did not receive Food Stamps/SNAP in the past 12 months: 3,064
Women who had a birth in the past 12 months: 23 (25 now married, 0 unmarried) Women who did not have a birth in the past 12 months: 1,626 (841 now married, 778 unmarried)
Housing units in zip code 18069 with a mortgage: 1,448 (256 second mortgage, 53 home equity loan, 183 both second mortgage and home equity loan) Houses without a mortgage: 89
Median monthly owner costs for units with a mortgage: $2,255 Median monthly owner costs for units without a mortgage: $865
Residents with income below the poverty level in 2022:
This zip code:
1.5%
Whole state:
11.8%
Residents with income below 50% of the poverty level in 2022:
This zip code:
1.0%
Whole state:
6.1%
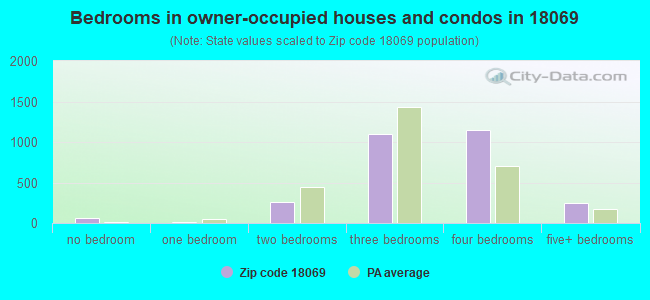
Median number of rooms in houses and condos:
Here:
7.7
State:
6.8
Median number of rooms in apartments:
Here:
5.6
State:
4.3
Notable locations in this zip code not listed on our city pages
Notable locations in zip code 18069: Apple Hill Ski Resort (A), Camp Horseshoe (B), Tri - Clover Fire Company Station 26 (C). Display/hide their locations on the map
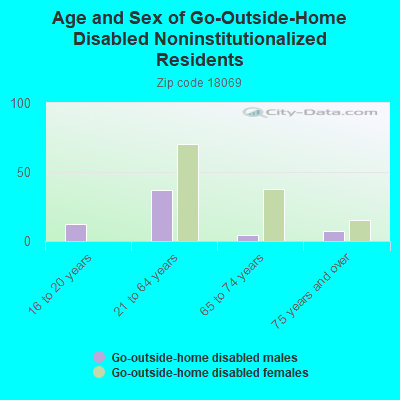
In group quarters: 127 (-1 institutionalized population)
Size of family households: 1,096 2-persons, 381 3-persons, 650 4-persons, 194 5-persons, 41 6-persons, 48 7-or-more-persons
Size of nonfamily households: 645 1-person, 86 2-persons
1,528 married couples with children.
150 single-parent households (21 men, 129 women).
88.6% of residents of 18069 zip code speak English at home.
4.4% of residents speak Spanish at home (57% very well, 28% well, 4% not well, 12% not at all).
3.6% of residents speak other Indo-European language at home (80% very well, 20% well).
1.7% of residents speak Asian or Pacific Island language at home (74% very well, 26% well).
1.2% of residents speak other language at home (93% very well, 7% not well).
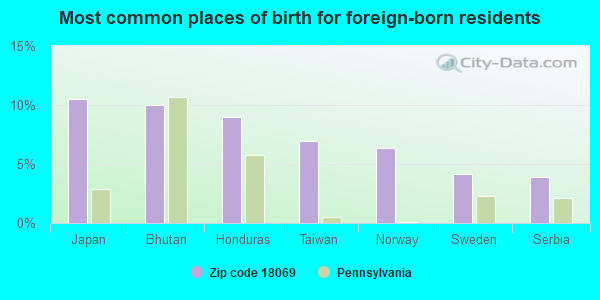
Foreign born population: 800 (9.3%) (87.2% of them are naturalized citizens)
This zip code:
9.3%
Whole state:
7.5%
11%Japan
10%Bhutan
9%Honduras
7%Taiwan
6%Norway
4%Sweden
4%Serbia
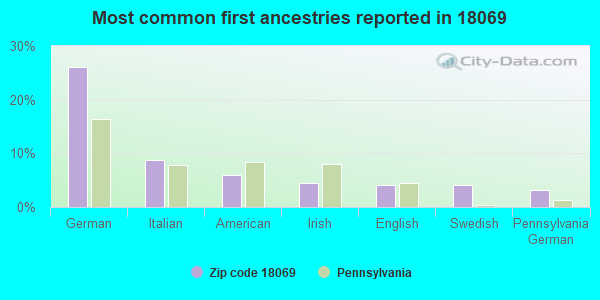
26%German
9%Italian
6%American
4%Irish
4%English
4%Swedish
3%Pennsylvania German
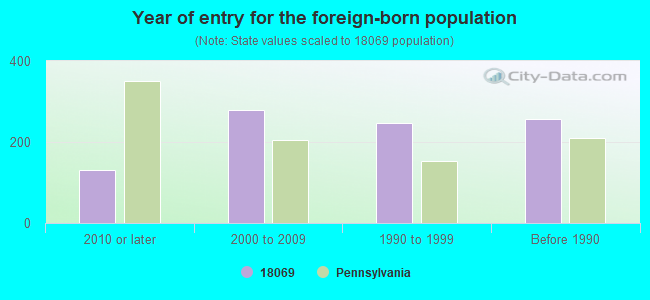
Year of entry for the foreign-born population
1322010 or later
2782000 to 2009
2461990 to 1999
258Before 1990
Facilities with environmental interests located in this zip code:
BETZ CARL H (ROUTE 2 in OREFIELD, PA)
TRANSPORTER (Resource Conservation and Recovery Act (tracking hazardous waste)) Organizations: CARL H BETZ (CONTACT/OPERATOR)
, OWNERNAME (CONTACT/OWNER)
Housing units lacking complete plumbing facilities: 0.4% Housing units lacking complete kitchen facilities: 0.6%
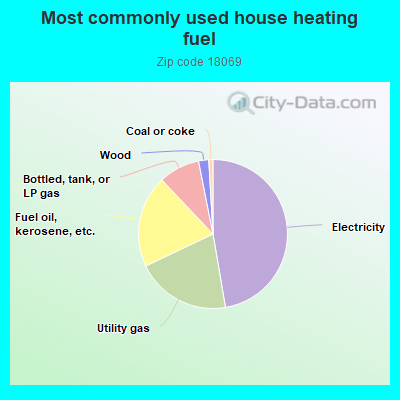
47.1%Electricity
20.5%Utility gas
19.9%Fuel oil, kerosene, etc.
8.9%Bottled, tank, or LP gas
2.2%Wood
0.9%Coal or coke
Population in 1990: 6,397. Population change in the 1990s: +188 (+2.9%).
Place of birth for U.S.-born residents:
This state: 5,328
Northeast: 1,042
Midwest: 630
South: 503
West: 139
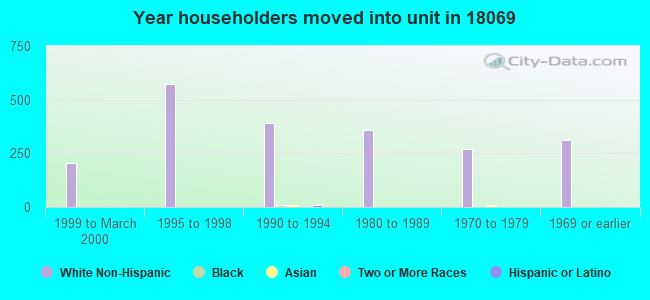
61% of the 18069 zip code residents lived in the same house 5 years ago. Out of people who lived in different houses, 52% lived in this county. Out of people who lived in different counties, 50% lived in Pennsylvania.
96% of the 18069 zip code residents lived in the same house 1 year ago. Out of people who lived in different houses, 46% moved from this county. Out of people who lived in different houses, 30% moved from different county within same state. Out of people who lived in different houses, 22% moved from different state. Out of people who lived in different houses, 8% moved from abroad.
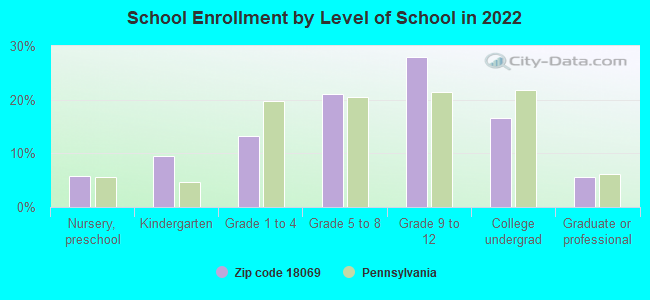
Private vs. public school enrollment:
Students in private schools in grades 1 to 8 (elementary and middle school): 230
Here:
28.9%
Pennsylvania:
15.7%
Students in private schools in grades 9 to 12 (high school): 50
Here:
7.9%
Pennsylvania:
13.4%
Students in private undergraduate colleges: 137
Here:
36.2%
Pennsylvania:
39.8%
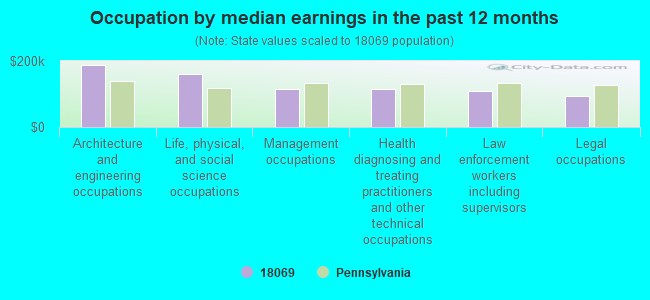
Occupation by median earnings in the past 12 months ($)
189,330Architecture and engineering occupations
161,260Life, physical, and social science occupations
114,678Management occupations
114,442Health diagnosing and treating practitioners and other technical occupations
109,703Law enforcement workers including supervisors
92,960Legal occupations
Top industries in this zip code by the number of employees in 2005:
Health Care and Social Assistance: Residential Mental Health and Substance Abuse Facilities (500-999 employees: 1 establishment, 50-99 employees: 1 establishment)
Management of Companies and Enterprises: Corporate, Subsidiary, and Regional Managing Offices (250-499: 1, 20-49: 1)
Health Care and Social Assistance: Psychiatric and Substance Abuse Hospitals (100-249: 1)
Other Services (except Public Administration): Religious Organizations (50-99: 1, 5-9: 3, 1-4: 2)
Construction: New Housing Operative Builders (20-49: 1)
Health Care and Social Assistance: Child Day Care Services (20-49: 1)
People in group quarters in 2010:
267 people in residential treatment centers for juveniles (non-correctional)
13 people in workers' group living quarters and job corps centers
2 people in group homes intended for adults
2 people in other noninstitutional facilities
People in group quarters in 2000:
268 people in residential treatment centers for emotionally disturbed children
18 people in other noninstitutional group quarters
6 people in homes for the mentally retarded
3 people in other nonhousehold living situations
Fatal accident statistics in 2014:
Fatal accident count: 1
Vehicles involved in fatal accidents: 1
Fatal accidents caused by drunken drivers: 0
Fatalities: 1
Persons involved in fatal accidents: 1
Pedestrians involved in fatal accidents: 0
Fatal accident statistics in 2012:
Fatal accident count: 2
Vehicles involved in fatal accidents: 2
Fatal accidents caused by drunken drivers: 0
Fatalities: 2
Persons involved in fatal accidents: 2
Pedestrians involved in fatal accidents: 0
Home Mortgage Disclosure Act Aggregated Statistics For Year 2009 (Based on 8 partial tracts)
A) FHA, FSA/RHS & VA Home Purchase Loans
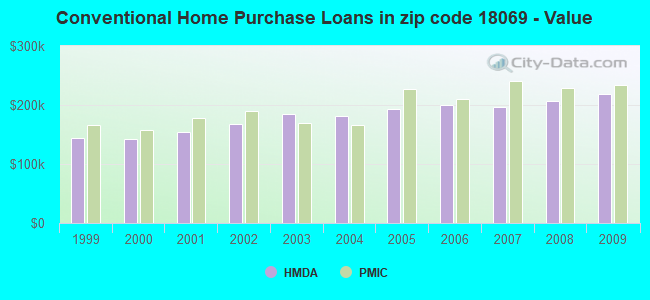
B) Conventional Home Purchase Loans
C) Refinancings
D) Home Improvement Loans
F) Non-occupant Loans on < 5 Family Dwellings (A B C & D)
G) Loans On Manufactured Home Dwelling (A B C & D)
Number
Average Value
Number
Average Value
Number
Average Value
Number
Average Value
Number
Average Value
Number
Average Value
LOANS ORIGINATED
56
$217,669
93
$218,280
449
$218,566
42
$94,133
11
$157,922
5
$69,654
APPLICATIONS APPROVED, NOT ACCEPTED
0
$0
9
$228,266
30
$218,194
1
$53,530
0
$0
2
$45,930
APPLICATIONS DENIED
9
$257,202
13
$179,429
145
$222,020
15
$37,572
6
$161,893
4
$61,932
APPLICATIONS WITHDRAWN
7
$190,527
8
$159,456
60
$236,649
3
$67,863
2
$175,700
3
$42,207
FILES CLOSED FOR INCOMPLETENESS
1
$180,170
1
$283,930
9
$231,884
2
$37,165
0
$0
1
$8,280
Aggregated Statistics For Year 2008 (Based on 8 partial tracts)
A) FHA, FSA/RHS & VA Home Purchase Loans
B) Conventional Home Purchase Loans
C) Refinancings
D) Home Improvement Loans
F) Non-occupant Loans on < 5 Family Dwellings (A B C & D)
G) Loans On Manufactured Home Dwelling (A B C & D)
Number
Average Value
Number
Average Value
Number
Average Value
Number
Average Value
Number
Average Value
Number
Average Value
LOANS ORIGINATED
31
$226,038
148
$207,556
246
$192,725
63
$54,546
16
$200,974
21
$68,072
APPLICATIONS APPROVED, NOT ACCEPTED
1
$209,560
25
$178,321
59
$178,008
12
$84,620
2
$170,980
7
$55,847
APPLICATIONS DENIED
4
$207,928
15
$227,722
116
$220,966
26
$114,922
3
$153,787
4
$55,460
APPLICATIONS WITHDRAWN
3
$157,193
17
$218,046
36
$194,674
5
$32,922
1
$106,470
3
$70,513
FILES CLOSED FOR INCOMPLETENESS
0
$0
4
$262,292
9
$443,492
2
$94,630
0
$0
0
$0
Aggregated Statistics For Year 2007 (Based on 8 partial tracts)
A) FHA, FSA/RHS & VA Home Purchase Loans
B) Conventional Home Purchase Loans
C) Refinancings
D) Home Improvement Loans
E) Loans on Dwellings For 5+ Families
F) Non-occupant Loans on < 5 Family Dwellings (A B C & D)
G) Loans On Manufactured Home Dwelling (A B C & D)
Number
Average Value
Number
Average Value
Number
Average Value
Number
Average Value
Number
Average Value
Number
Average Value
Number
Average Value
LOANS ORIGINATED
9
$248,457
227
$196,248
263
$161,326
98
$55,214
1
$384,180
21
$167,130
22
$51,155
APPLICATIONS APPROVED, NOT ACCEPTED
1
$269,040
25
$181,469
54
$170,598
14
$56,599
0
$0
6
$196,422
5
$58,694
APPLICATIONS DENIED
2
$160,555
29
$212,903
127
$206,404
36
$50,189
0
$0
7
$164,016
6
$49,767
APPLICATIONS WITHDRAWN
2
$193,050
27
$198,078
59
$223,586
9
$122,336
0
$0
2
$206,705
1
$60,410
FILES CLOSED FOR INCOMPLETENESS
1
$105,430
5
$238,514
20
$307,338
1
$35,790
0
$0
1
$261,170
0
$0
Aggregated Statistics For Year 2006 (Based on 8 partial tracts)
A) FHA, FSA/RHS & VA Home Purchase Loans
B) Conventional Home Purchase Loans
C) Refinancings
D) Home Improvement Loans
E) Loans on Dwellings For 5+ Families
F) Non-occupant Loans on < 5 Family Dwellings (A B C & D)
G) Loans On Manufactured Home Dwelling (A B C & D)
Number
Average Value
Number
Average Value
Number
Average Value
Number
Average Value
Number
Average Value
Number
Average Value
Number
Average Value
LOANS ORIGINATED
9
$212,041
332
$200,198
312
$152,114
118
$56,250
1
$148,970
29
$183,666
10
$29,982
APPLICATIONS APPROVED, NOT ACCEPTED
0
$0
47
$189,621
52
$150,274
13
$50,778
0
$0
5
$194,892
0
$0
APPLICATIONS DENIED
1
$200,450
31
$173,329
124
$220,336
38
$81,402
0
$0
4
$121,320
8
$47,926
APPLICATIONS WITHDRAWN
0
$0
30
$194,471
90
$206,721
4
$87,448
0
$0
3
$249,197
2
$37,020
FILES CLOSED FOR INCOMPLETENESS
0
$0
5
$169,818
21
$220,773
3
$41,743
0
$0
1
$33,100
0
$0
Aggregated Statistics For Year 2005 (Based on 8 partial tracts)
A) FHA, FSA/RHS & VA Home Purchase Loans
B) Conventional Home Purchase Loans
C) Refinancings
D) Home Improvement Loans
F) Non-occupant Loans on < 5 Family Dwellings (A B C & D)
G) Loans On Manufactured Home Dwelling (A B C & D)
Number
Average Value
Number
Average Value
Number
Average Value
Number
Average Value
Number
Average Value
Number
Average Value
LOANS ORIGINATED
6
$234,007
282
$193,885
377
$158,398
106
$62,307
18
$165,249
16
$37,663
APPLICATIONS APPROVED, NOT ACCEPTED
2
$134,390
26
$178,074
67
$157,030
10
$74,150
3
$195,230
4
$37,202
APPLICATIONS DENIED
2
$165,875
55
$113,570
129
$176,127
37
$58,444
4
$137,068
25
$34,329
APPLICATIONS WITHDRAWN
0
$0
16
$232,262
94
$170,129
11
$147,243
4
$143,785
0
$0
FILES CLOSED FOR INCOMPLETENESS
0
$0
10
$177,378
41
$223,893
2
$98,385
0
$0
1
$80,560
Aggregated Statistics For Year 2004 (Based on 8 partial tracts)
A) FHA, FSA/RHS & VA Home Purchase Loans
B) Conventional Home Purchase Loans
C) Refinancings
D) Home Improvement Loans
E) Loans on Dwellings For 5+ Families
F) Non-occupant Loans on < 5 Family Dwellings (A B C & D)
G) Loans On Manufactured Home Dwelling (A B C & D)
Number
Average Value
Number
Average Value
Number
Average Value
Number
Average Value
Number
Average Value
Number
Average Value
Number
Average Value
LOANS ORIGINATED
11
$175,618
263
$180,712
407
$143,230
90
$51,652
1
$554,020
14
$134,784
9
$44,529
APPLICATIONS APPROVED, NOT ACCEPTED
0
$0
29
$195,224
64
$148,317
16
$64,177
0
$0
4
$132,702
3
$17,997
APPLICATIONS DENIED
2
$173,875
29
$146,407
115
$157,600
23
$96,997
0
$0
3
$238,670
12
$35,353
APPLICATIONS WITHDRAWN
0
$0
20
$189,462
93
$166,644
7
$52,316
0
$0
3
$136,823
2
$34,820
FILES CLOSED FOR INCOMPLETENESS
1
$96,830
8
$134,088
18
$173,358
3
$60,040
0
$0
0
$0
2
$30,205
Aggregated Statistics For Year 2003 (Based on 8 partial tracts)
A) FHA, FSA/RHS & VA Home Purchase Loans
B) Conventional Home Purchase Loans
C) Refinancings
D) Home Improvement Loans
F) Non-occupant Loans on < 5 Family Dwellings (A B C & D)
Number
Average Value
Number
Average Value
Number
Average Value
Number
Average Value
Number
Average Value
LOANS ORIGINATED
8
$162,520
232
$183,932
975
$150,673
55
$38,982
20
$105,430
APPLICATIONS APPROVED, NOT ACCEPTED
1
$102,180
25
$180,020
113
$140,152
15
$34,392
3
$74,553
APPLICATIONS DENIED
0
$0
22
$112,840
116
$148,794
16
$36,683
5
$84,722
APPLICATIONS WITHDRAWN
1
$101,380
22
$174,990
105
$155,742
2
$51,185
1
$142,970
FILES CLOSED FOR INCOMPLETENESS
0
$0
6
$200,017
22
$125,797
2
$29,310
0
$0
Aggregated Statistics For Year 2002 (Based on 8 partial tracts)
A) FHA, FSA/RHS & VA Home Purchase Loans
B) Conventional Home Purchase Loans
C) Refinancings
D) Home Improvement Loans
F) Non-occupant Loans on < 5 Family Dwellings (A B C & D)
Number
Average Value
Number
Average Value
Number
Average Value
Number
Average Value
Number
Average Value
LOANS ORIGINATED
13
$136,839
224
$167,594
611
$146,213
53
$27,218
11
$101,702
APPLICATIONS APPROVED, NOT ACCEPTED
1
$123,650
21
$150,614
81
$127,198
19
$37,432
3
$107,773
APPLICATIONS DENIED
1
$112,330
29
$99,947
100
$130,748
14
$40,375
5
$117,546
APPLICATIONS WITHDRAWN
1
$224,620
12
$181,147
80
$136,210
8
$28,172
1
$203,010
FILES CLOSED FOR INCOMPLETENESS
0
$0
4
$142,872
21
$139,405
1
$10,570
0
$0
Aggregated Statistics For Year 2001 (Based on 8 partial tracts)
A) FHA, FSA/RHS & VA Home Purchase Loans
B) Conventional Home Purchase Loans
C) Refinancings
D) Home Improvement Loans
F) Non-occupant Loans on < 5 Family Dwellings (A B C & D)
Number
Average Value
Number
Average Value
Number
Average Value
Number
Average Value
Number
Average Value
LOANS ORIGINATED
13
$112,494
266
$153,527
376
$124,894
67
$31,655
12
$104,350
APPLICATIONS APPROVED, NOT ACCEPTED
0
$0
29
$100,871
53
$96,164
17
$31,833
0
$0
APPLICATIONS DENIED
1
$76,790
49
$64,142
116
$102,071
13
$21,679
4
$53,605
APPLICATIONS WITHDRAWN
0
$0
17
$149,497
61
$121,193
6
$31,503
1
$190,370
FILES CLOSED FOR INCOMPLETENESS
0
$0
2
$112,250
18
$92,762
3
$27,733
1
$27,980
Aggregated Statistics For Year 2000 (Based on 8 partial tracts)
A) FHA, FSA/RHS & VA Home Purchase Loans
B) Conventional Home Purchase Loans
C) Refinancings
D) Home Improvement Loans
E) Loans on Dwellings For 5+ Families
F) Non-occupant Loans on < 5 Family Dwellings (A B C & D)
Number
Average Value
Number
Average Value
Number
Average Value
Number
Average Value
Number
Average Value
Number
Average Value
LOANS ORIGINATED
7
$127,816
232
$143,152
125
$95,934
50
$27,695
1
$201,750
6
$58,562
APPLICATIONS APPROVED, NOT ACCEPTED
0
$0
28
$117,808
32
$134,980
16
$24,208
0
$0
2
$38,685
APPLICATIONS DENIED
0
$0
56
$70,462
67
$83,358
14
$32,799
0
$0
3
$52,543
APPLICATIONS WITHDRAWN
0
$0
12
$118,897
25
$78,820
7
$27,184
0
$0
0
$0
FILES CLOSED FOR INCOMPLETENESS
0
$0
4
$186,018
16
$120,257
1
$19,520
0
$0
0
$0
Aggregated Statistics For Year 1999 (Based on 4 partial tracts)
A) FHA, FSA/RHS & VA Home Purchase Loans
B) Conventional Home Purchase Loans
C) Refinancings
D) Home Improvement Loans
F) Non-occupant Loans on < 5 Family Dwellings (A B C & D)
2006 - 2018 National Fire Incident Reporting System (NFIRS) incidents
According to the data from the years 2006 - 2018 the average number of fires per year is 13. The highest number of fire incidents - 42 took place in 2017, and the least - 0 in 2008. The data has an increasing trend.
When looking into fire subcategories, the most incidents belonged to: Structure Fires (61.1%), and Outside Fires (25.1%).
Fire incident types reported to NFIRS in Zip Code 18069


 Nearest zip codes: 18195, 18078, 18051, 18104, 18087, 18106.


 According to the data from the years 2006 - 2018 the average number of fires per year is 13. The highest number of fire incidents - 42 took place in 2017, and the least - 0 in 2008. The data has an increasing trend.
 When looking into fire subcategories, the most incidents belonged to: Structure Fires (61.1%), and Outside Fires (25.1%).