Estimated zip code population in 2022: 4,229 Zip code population in 2010: 3,868 Zip code population in 2000: 3,122
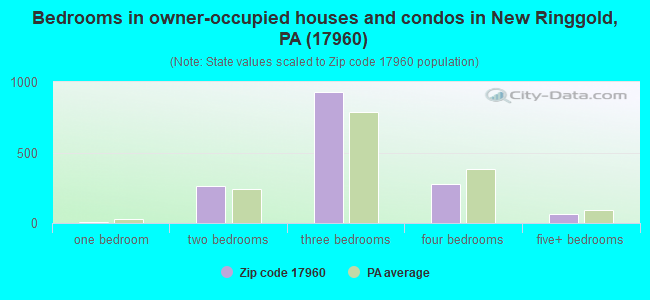
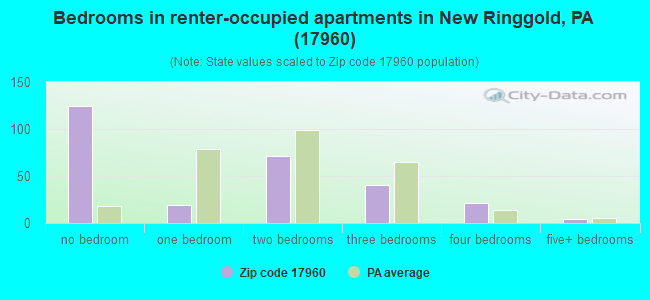
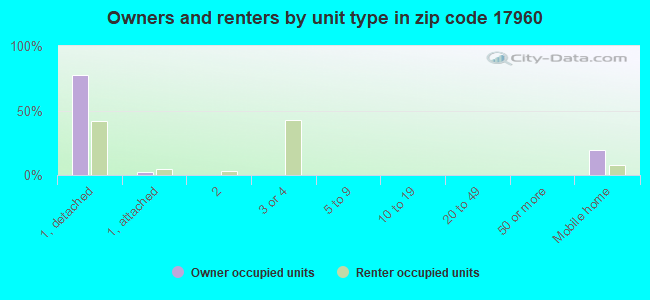
Houses and condos: 1,975 Renter-occupied apartments: 267
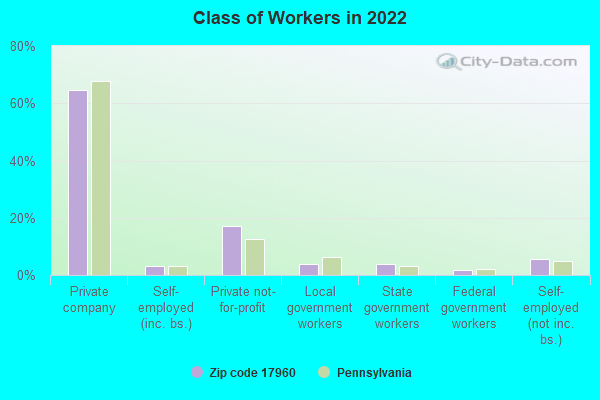
% of renters here:
15%
State:
31%
March 2022 cost of living index in zip code 17960: 93.0 (less than average, U.S. average is 100)
Land area: 51.6 sq. mi. Water area: 0.0 sq. mi.
Population density: 82 people per square mile
(very low).
OSM Map
General Map
Google Map
MSN Map
OSM Map
General Map
Google Map
MSN Map
OSM Map
General Map
Google Map
MSN Map
OSM Map
General Map
Google Map
MSN Map
Please wait while loading the map...
Real estate property taxes paid for housing units in 2022:
This zip code:
1.3% ($2,955)
Pennsylvania:
1.3% ($3,094)
Median real estate property taxes paid for housing units with mortgages in 2022: $3,742 (1.5%) Median real estate property taxes paid for housing units with no mortgage in 2022: $2,476 (1.2%)
Estimated median house/condo value in 2022: $235,298
17960:
$235,298
Pennsylvania:
$245,500
According to our research of Pennsylvania and other state lists, there were 7 registered sex offenders living in 17960 zip code as of July 03, 2024. The ratio of all residents to sex offenders in zip code 17960 is 552 to 1. The ratio of registered sex offenders to all residents in this zip code is near the state average.
Median resident age:
This zip code:
49.7 years
Pennsylvania median age:
40.9 years
Average household size:
This zip code:
2.3 people
Pennsylvania:
2.4 people
Averages for the 2020 tax year for zip code 17960, filed in 2021:
Average Adjusted Gross Income (AGI) in 2020: $68,038 (Individual Income Tax Returns)
Here:
$68,038
State:
$75,707
Salary/wage: $58,895 (reported on 76.0% of returns)
Here:
$58,895
State:
$62,806
(% of AGI for various income ranges: 1052.8% for AGIs below $25k, 3244.8% for AGIs $25k-50k, 6063.5% for AGIs $50k-75k, 8911.3% for AGIs $75k-100k, 16775.0% for AGIs $100k-200k, 49363.3% for AGIs over 200k)
Taxable interest for individuals: $1,264 (reported on 36.0% of returns)
This zip code:
$1,264
Pennsylvania:
$1,633
(% of AGI for various income ranges: 39.7% for AGIs below $25k, 33.5% for AGIs $25k-50k, 103.5% for AGIs $50k-75k, 86.0% for AGIs $75k-100k, 88.0% for AGIs $100k-200k, 400.0% for AGIs over 200k)
Ordinary dividends: $3,579 (reported on 26.5% of returns)
Here:
$3,579
State:
$7,382
(% of AGI for various income ranges: 55.6% for AGIs below $25k, 55.2% for AGIs $25k-50k, 135.2% for AGIs $50k-75k, 159.3% for AGIs $75k-100k, 294.5% for AGIs $100k-200k, 1290.0% for AGIs over 200k)
Net capital gain/loss in AGI: +$9,331 (reported on 21.0% of returns)
Here:
+$9,331
State:
+$23,522
(% of AGI for various income ranges: 30.3% for AGIs below $25k, 59.0% for AGIs $25k-50k, 168.7% for AGIs $50k-75k, 119.3% for AGIs $75k-100k, 481.0% for AGIs $100k-200k, 6993.3% for AGIs over 200k)
Profit/loss from business: +$15,321 (reported on 12.0% of returns)
Here:
+$15,321
State:
+$16,274
(% of AGI for various income ranges: 103.9% for AGIs below $25k, 141.9% for AGIs $25k-50k, 225.2% for AGIs $50k-75k, 587.3% for AGIs $75k-100k, 732.0% for AGIs $100k-200k)
Taxable individual retirement arrangement distribution: $15,343 (reported on 15.0% of returns)
17960:
$15,343
Pennsylvania:
$18,583
(% of AGI for various income ranges: 136.7% for AGIs below $25k, 199.0% for AGIs $25k-50k, 195.2% for AGIs $50k-75k, 414.7% for AGIs $75k-100k, 1211.5% for AGIs $100k-200k)
Total itemized deductions: $33,178 (reported on 4.5% of returns)
Here:
$33,178
State:
$34,850
(% of AGI for various income ranges: 519.6% for AGIs $50k-75k, 348.0% for AGIs $100k-200k, 3650.0% for AGIs over 200k)
Charity contributions: $9,829 (reported on 3.5% of returns)
Here:
$9,829
State:
$12,392
(% of AGI for various income ranges: 217.3% for AGIs $75k-100k, 1206.7% for AGIs over 200k)
Taxes paid: $8,367 (reported on 4.5% of returns)
17960:
$8,367
State:
$8,200
(% of AGI for various income ranges: 131.3% for AGIs $50k-75k, 108.5% for AGIs $100k-200k, 780.0% for AGIs over 200k)
Earned income credit: $2,061 (reported on 9.0% of returns)
Here:
$2,061
State:
$2,100
(% of AGI for various income ranges: 57.5% for AGIs below $25k, 52.9% for AGIs $25k-50k)
Percentage of individuals using paid preparers for their 2020 taxes: 92.0%
Here:
92%
State:
92%
(% for various income ranges: 91.9% for AGIs below $25k, 92.9% for AGIs $25k-50k, 93.8% for AGIs $50k-75k, 90.9% for AGIs $75k-100k, 91.2% for AGIs $100k-200k, 87.5% for AGIs over 200k)
Averages for the 2012 tax year for zip code 17960, filed in 2013:
Average Adjusted Gross Income (AGI) in 2012: $53,079 (Individual Income Tax Returns)
Here:
$53,079
State:
$61,346
Salary/wage: $47,579 (reported on 79.4% of returns)
Here:
$47,579
State:
$51,902
(% of AGI for various income ranges: 59.0% for AGIs below $25k, 72.8% for AGIs $25k-50k, 77.4% for AGIs $50k-75k, 77.0% for AGIs $75k-100k, 76.2% for AGIs $100k-200k, 49.8% for AGIs over 200k)
Taxable interest for individuals: $1,113 (reported on 41.3% of returns)
This zip code:
$1,113
Pennsylvania:
$1,588
(% of AGI for various income ranges: 2.2% for AGIs below $25k, 0.8% for AGIs $25k-50k, 0.8% for AGIs $50k-75k, 0.9% for AGIs $75k-100k, 0.5% for AGIs $100k-200k, 1.0% for AGIs over 200k)
Ordinary dividends: $2,757 (reported on 28.0% of returns)
Here:
$2,757
State:
$5,827
(% of AGI for various income ranges: 2.9% for AGIs below $25k, 1.0% for AGIs $25k-50k, 1.3% for AGIs $50k-75k, 1.4% for AGIs $75k-100k, 1.6% for AGIs $100k-200k, 1.2% for AGIs over 200k)
Net capital gain/loss in AGI: +$3,255 (reported on 16.4% of returns)
Here:
+$3,255
State:
+$14,495
(% of AGI for various income ranges: 0.3% for AGIs $50k-75k, 0.3% for AGIs $75k-100k, 0.8% for AGIs $100k-200k, 5.1% for AGIs over 200k)
Profit/loss from business: +$11,259 (reported on 11.6% of returns)
Here:
+$11,259
State:
+$16,268
(% of AGI for various income ranges: 5.6% for AGIs below $25k, 2.8% for AGIs $25k-50k, 1.7% for AGIs $50k-75k, 1.5% for AGIs $75k-100k, 3.7% for AGIs $100k-200k)
Taxable individual retirement arrangement distribution: $10,381 (reported on 13.8% of returns)
17960:
$10,381
Pennsylvania:
$14,550
(% of AGI for various income ranges: 5.1% for AGIs below $25k, 2.8% for AGIs $25k-50k, 2.0% for AGIs $50k-75k, 1.9% for AGIs $75k-100k, 4.2% for AGIs $100k-200k)
Total itemized deductions: $19,413 (20% of AGI, reported on 28.6% of returns)
Here:
$19,413
State:
$23,538
Here:
19.5% of AGI
State:
18.4% of AGI
(% of AGI for various income ranges: 9.2% for AGIs below $25k, 8.1% for AGIs $25k-50k, 9.6% for AGIs $50k-75k, 10.0% for AGIs $75k-100k, 12.5% for AGIs $100k-200k, 11.4% for AGIs over 200k)
Charity contributions: $2,912 (reported on 22.2% of returns)
Here:
$2,912
State:
$4,025
(% of AGI for various income ranges: 0.5% for AGIs below $25k, 1.0% for AGIs $25k-50k, 0.8% for AGIs $50k-75k, 0.8% for AGIs $75k-100k, 1.5% for AGIs $100k-200k, 2.3% for AGIs over 200k)
Taxes paid: $7,811 (reported on 28.6% of returns)
17960:
$7,811
State:
$9,982
(% of AGI for various income ranges: 2.2% for AGIs below $25k, 2.3% for AGIs $25k-50k, 3.3% for AGIs $50k-75k, 4.2% for AGIs $75k-100k, 5.7% for AGIs $100k-200k, 5.8% for AGIs over 200k)
Earned income credit: $1,820 (reported on 10.6% of returns)
Here:
$1,820
State:
$2,106
(% of AGI for various income ranges: 3.2% for AGIs below $25k, 0.7% for AGIs $25k-50k)
Percentage of individuals using paid preparers for their 2012 taxes: 57.7%
Here:
58%
State:
53%
(% for various income ranges: 53.6% for AGIs below $25k, 56.8% for AGIs $25k-50k, 56.7% for AGIs $50k-75k, 60.0% for AGIs $75k-100k, 63.6% for AGIs $100k-200k, 100.0% for AGIs over 200k)
Averages for the 2004 tax year for zip code 17960, filed in 2005:
Average Adjusted Gross Income (AGI) in 2004: $43,471 (Individual Income Tax Returns)
Here:
$43,471
State:
$48,049
Salary/wage: $39,860 (reported on 80.8% of returns)
Here:
$39,860
State:
$42,646
(% of AGI for various income ranges: 117.1% for AGIs below $10k, 60.4% for AGIs $10k-25k, 81.1% for AGIs $25k-50k, 86.5% for AGIs $50k-75k, 84.2% for AGIs $75k-100k, 54.0% for AGIs over 100k)
Taxable interest for individuals: $1,329 (reported on 53.9% of returns)
This zip code:
$1,329
Pennsylvania:
$1,657
(% of AGI for various income ranges: 10.5% for AGIs below $10k, 4.0% for AGIs $10k-25k, 1.1% for AGIs $25k-50k, 0.8% for AGIs $50k-75k, 1.8% for AGIs $75k-100k, 1.5% for AGIs over 100k)
Taxable dividends: $2,211 (reported on 33.4% of returns)
Here:
$2,211
State:
$3,566
(% of AGI for various income ranges: 6.2% for AGIs below $10k, 3.0% for AGIs $10k-25k, 1.4% for AGIs $25k-50k, 0.7% for AGIs $50k-75k, 0.9% for AGIs $75k-100k, 2.7% for AGIs over 100k)
Net capital gain/loss: +$10,453 (reported on 22.5% of returns)
Here:
+$10,453
State:
+$9,716
(% of AGI for various income ranges: 3.9% for AGIs below $10k, 2.8% for AGIs $10k-25k, 0.4% for AGIs $25k-50k, 1.1% for AGIs $50k-75k, 2.3% for AGIs $75k-100k, 15.8% for AGIs over 100k)
Profit/loss from business: +$7,829 (reported on 14.6% of returns)
Here:
+$7,829
State:
+$14,267
(% of AGI for various income ranges: 2.4% for AGIs below $10k, 5.3% for AGIs $10k-25k, 2.5% for AGIs $25k-50k, 2.4% for AGIs $50k-75k, 0.9% for AGIs $75k-100k, 3.2% for AGIs over 100k)
Profit/loss from farming: +$2,333 (reported on 1.8% of returns)
Here:
+$2,333
State:
+$274
IRA payment deduction: $3,118 (reported on 3.8% of returns)
17960:
$3,118
Pennsylvania:
$2,903
Total itemized deductions: $15,598 (19% of AGI, reported on 29.6% of returns)
Here:
$15,598
State:
$18,804
Here:
19.3% of AGI
State:
19.5% of AGI
(% of AGI for various income ranges: 13.4% for AGIs below $10k, 8.0% for AGIs $10k-25k, 9.4% for AGIs $25k-50k, 10.7% for AGIs $50k-75k, 12.7% for AGIs $75k-100k, 10.7% for AGIs over 100k)
Charity contributions deductions: $2,493 (3% of AGI, reported on 26.2% of returns)
Here:
$2,493
State:
$3,337
Here:
2.9% of AGI
State:
3.3% of AGI
(% of AGI for various income ranges: 0.4% for AGIs below $10k, 0.6% for AGIs $10k-25k, 1.0% for AGIs $25k-50k, 1.2% for AGIs $50k-75k, 1.5% for AGIs $75k-100k, 2.5% for AGIs over 100k)
Total tax: $5,915 (reported on 77.3% of returns)
17960:
$5,915
State:
$8,008
(% of AGI for various income ranges: 4.3% for AGIs below $10k, 4.5% for AGIs $10k-25k, 6.6% for AGIs $25k-50k, 8.7% for AGIs $50k-75k, 10.5% for AGIs $75k-100k, 17.2% for AGIs over 100k)
Earned income credit: $1,436 (reported on 9.0% of returns)
Here:
$1,436
State:
$1,643
Percentage of individuals using paid preparers for their 2004 taxes: 62.1%
Here:
62%
State:
56%
(% for various income ranges: 59.2% for AGIs below $10k, 62.7% for AGIs $10k-25k, 62.8% for AGIs $25k-50k, 60.9% for AGIs $50k-75k, 59.8% for AGIs $75k-100k, 72.0% for AGIs over 100k)
Household received Food Stamps/SNAP in the past 12 months: 180 Household did not receive Food Stamps/SNAP in the past 12 months: 1,628
Women who had a birth in the past 12 months: 29 (31 now married, 0 unmarried) Women who did not have a birth in the past 12 months: 666 (345 now married, 317 unmarried)
Housing units in zip code 17960 with a mortgage: 807 (98 second mortgage, 2 home equity loan, 81 both second mortgage and home equity loan) Houses without a mortgage: 180
Median monthly owner costs for units with a mortgage: $1,435 Median monthly owner costs for units without a mortgage: $694
Residents with income below the poverty level in 2022:
This zip code:
5.2%
Whole state:
11.8%
Residents with income below 50% of the poverty level in 2022:
This zip code:
2.6%
Whole state:
6.1%
Median number of rooms in houses and condos:
Here:
6.5
State:
6.8
Median number of rooms in apartments:
Here:
4.5
State:
4.3
Notable locations in this zip code not listed on our city pages
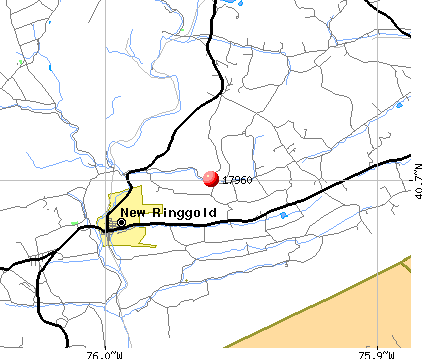
Streams, rivers, and creeks: Keenigs Creek (A), Rip Rap Run (B), Deep Hollow Run (C), Indian Run (D), Stump Run (E), Cold Run (F), Koenigs Creek (G). Display/hide their locations on the map
In group quarters: 3 (-1 institutionalized population)
Size of family households: 660 2-persons, 322 3-persons, 145 4-persons, 91 5-persons, 13 6-persons, 7 7-or-more-persons
Size of nonfamily households: 509 1-person, 54 2-persons, 3 3-persons
697 married couples with children.
105 single-parent households (13 men, 92 women).
94.9% of residents of 17960 zip code speak English at home.
1.3% of residents speak Spanish at home (100% very well).
3.6% of residents speak other Indo-European language at home (64% very well, 36% well).
0.4% of residents speak Asian or Pacific Island language at home (100% very well).
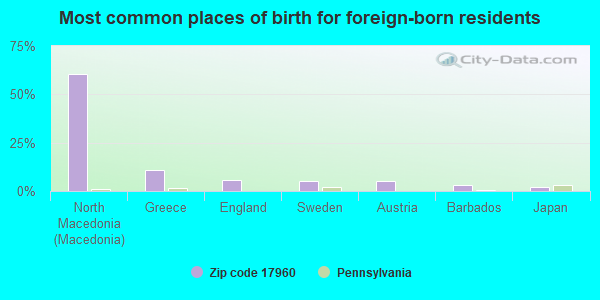
Foreign born population: 138 (3.3%) (93.4% of them are naturalized citizens)
This zip code:
3.3%
Whole state:
7.5%
60%North Macedonia (Macedonia)
11%Greece
6%England
5%Sweden
5%Austria
3%Barbados
2%Japan
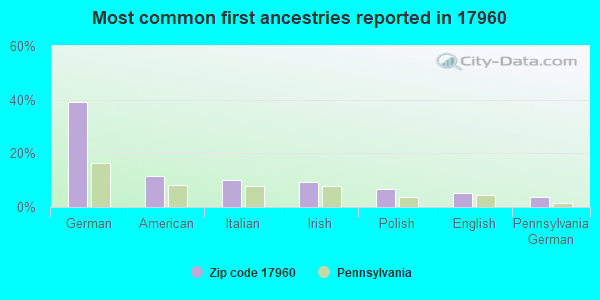
39%German
11%American
10%Italian
9%Irish
7%Polish
5%English
4%Pennsylvania German
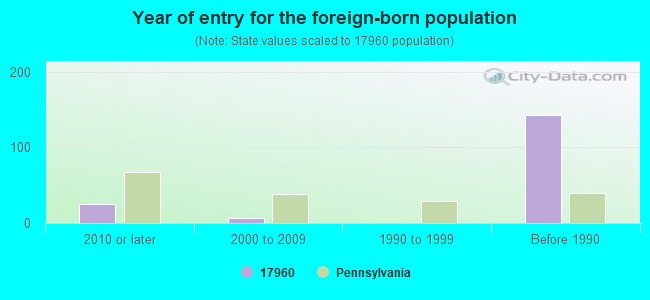
Year of entry for the foreign-born population
252010 or later
62000 to 2009
01990 to 1999
143Before 1990
Housing units lacking complete plumbing facilities: 1.1% Housing units lacking complete kitchen facilities: 2.0%
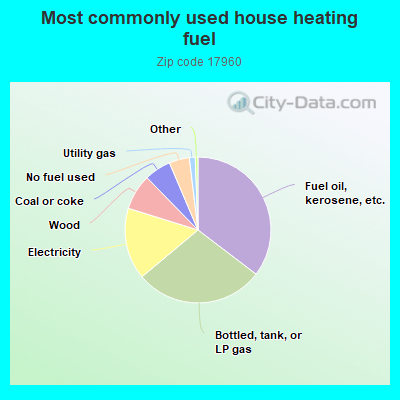
35.4%Fuel oil, kerosene, etc.
28.6%Bottled, tank, or LP gas
15.9%Electricity
7.9%Wood
5.9%Coal or coke
4.5%No fuel used
1.3%Utility gas
Population in 1990: 4,284.
Place of birth for U.S.-born residents:
This state: 3,463
Northeast: 325
Midwest: 82
South: 91
West: 57
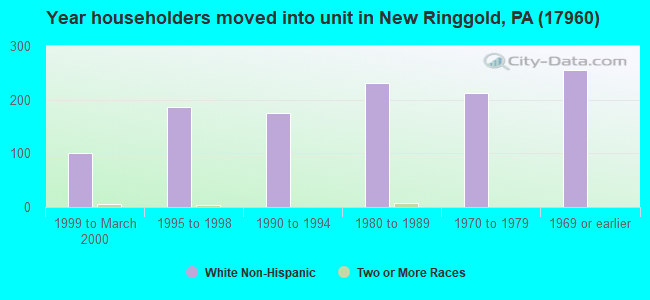
74% of the 17960 zip code residents lived in the same house 5 years ago. Out of people who lived in different houses, 63% lived in this county. Out of people who lived in different counties, 50% lived in Pennsylvania.
89% of the 17960 zip code residents lived in the same house 1 year ago. Out of people who lived in different houses, 26% moved from this county. Out of people who lived in different houses, 44% moved from different county within same state. Out of people who lived in different houses, 27% moved from different state. Out of people who lived in different houses, 3% moved from abroad.
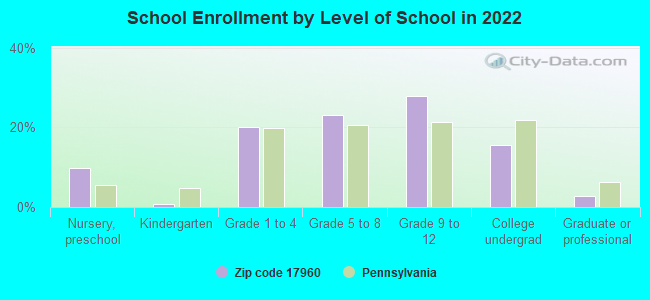
Private vs. public school enrollment:
Students in private schools in grades 1 to 8 (elementary and middle school): 47
Here:
13.3%
Pennsylvania:
15.7%
Students in private schools in grades 9 to 12 (high school):
Here:
0.0%
Pennsylvania:
13.4%
Students in private undergraduate colleges: 36
Here:
28.4%
Pennsylvania:
39.8%
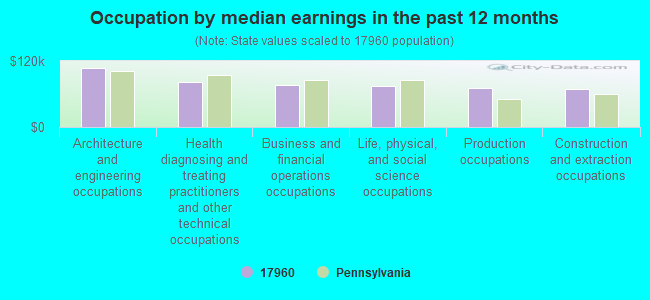
Occupation by median earnings in the past 12 months ($)
106,984Architecture and engineering occupations
81,295Health diagnosing and treating practitioners and other technical occupations
75,810Business and financial operations occupations
74,240Life, physical, and social science occupations
70,200Production occupations
69,340Construction and extraction occupations
Companies with federal contracts located in this zip code:
EFFECTIVE CONTROLS, INC (2079 WEST PENN PIKE in NEW RINGGOLD, PA; small business) : $93,846 in 9 contractsfrom 2003 to 2006
Contracts for Air Purification Equipment, Clean Work Stations, Controlled Environment and Related Equipment, Motor Vehicle Maintenance and Repair Shop Specialized Equipment, Fans, Air Circulators, and Blower Equipment by Army Signed by year:2000: $0; 2001: $0; 2002: $0; 2003: $5,880; 2004: $26,937; 2005: $43,815; 2006: $17,214.
Biggest contracts:
$39,812 with Army for Air Purification Equipment. Signed on 2005-08-04. Completion date: 2005-09-07.
$11,598 with Army for Clean Work Stations, Controlled Environment and Related Equipment. Signed on 2006-05-30. Completion date: 2006-07-14.
$9,401 with Army for Motor Vehicle Maintenance and Repair Shop Specialized Equipment. Signed on 2004-09-01. Completion date: 2004-10-15.
$7,280 with Army for Fans, Air Circulators, and Blower Equipment. Signed on 2004-12-10. Completion date: 2004-12-27.
Top industries in this zip code by the number of employees in 2005:
2003 - 2018 National Fire Incident Reporting System (NFIRS) incidents
According to the data from the years 2003 - 2018 the average number of fire incidents per year is 9. The highest number of fire incidents - 36 took place in 2016, and the least - 0 in 2004. The data has a growing trend.
When looking into fire subcategories, the most incidents belonged to: Structure Fires (60.8%), and Outside Fires (25.7%).
Fire incident types reported to NFIRS in Zip Code 17960

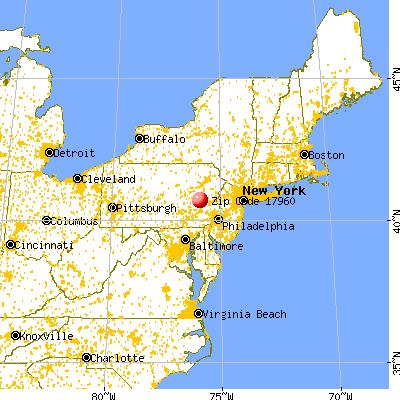


 Nearest zip codes: 18252, 19529, 17982, 17961, 18211, 17952.


 : $93,846 in 9 contracts from 2003 to 2006
 According to the data from the years 2003 - 2018 the average number of fire incidents per year is 9. The highest number of fire incidents - 36 took place in 2016, and the least - 0 in 2004. The data has a growing trend.
 When looking into fire subcategories, the most incidents belonged to: Structure Fires (60.8%), and Outside Fires (25.7%).