Estimated zip code population in 2022: 14,328 Zip code population in 2010: 14,564 Zip code population in 2000: 15,345
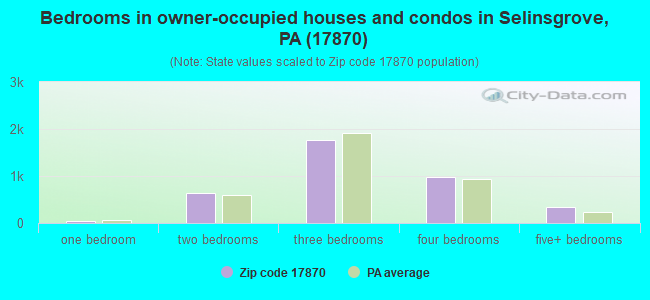
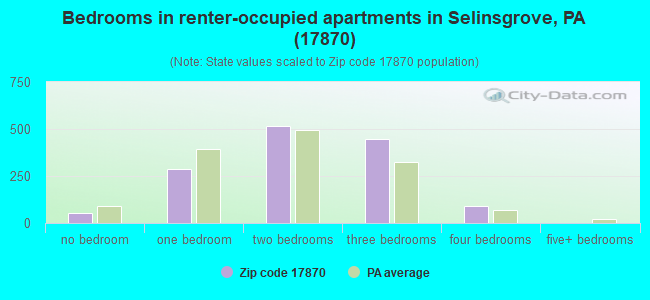
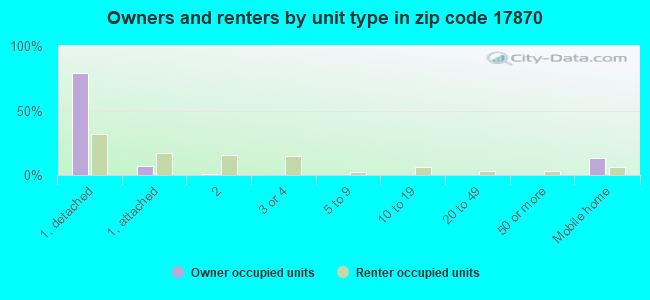
Houses and condos: 5,717 Renter-occupied apartments: 1,405
% of renters here:
27%
State:
31%
March 2022 cost of living index in zip code 17870: 87.1 (less than average, U.S. average is 100)
Land area: 45.1 sq. mi. Water area: 0.8 sq. mi.
Population density: 318 people per square mile
(very low).
OSM Map
General Map
Google Map
MSN Map
OSM Map
General Map
Google Map
MSN Map
OSM Map
General Map
Google Map
MSN Map
OSM Map
General Map
Google Map
MSN Map
Please wait while loading the map...
Real estate property taxes paid for housing units in 2022:
This zip code:
1.1% ($2,533)
Pennsylvania:
1.3% ($3,094)
Median real estate property taxes paid for housing units with mortgages in 2022: $2,962 (1.2%) Median real estate property taxes paid for housing units with no mortgage in 2022: $2,065 (0.9%)
Estimated median house/condo value in 2022: $238,445
17870:
$238,445
Pennsylvania:
$245,500
According to our research of Pennsylvania and other state lists, there were 12 registered sex offenders living in 17870 zip code as of July 04, 2024. The ratio of all residents to sex offenders in zip code 17870 is 1,282 to 1. The ratio of registered sex offenders to all residents in this zip code is lower than the state average.
Median resident age:
This zip code:
38.7 years
Pennsylvania median age:
40.9 years
Average household size:
This zip code:
2.3 people
Pennsylvania:
2.4 people
Averages for the 2020 tax year for zip code 17870, filed in 2021:
Average Adjusted Gross Income (AGI) in 2020: $64,664 (Individual Income Tax Returns)
Here:
$64,664
State:
$75,707
Salary/wage: $53,219 (reported on 78.6% of returns)
Here:
$53,219
State:
$62,806
(% of AGI for various income ranges: 1142.6% for AGIs below $25k, 3362.8% for AGIs $25k-50k, 5949.1% for AGIs $50k-75k, 8717.6% for AGIs $75k-100k, 16156.3% for AGIs $100k-200k, 68788.6% for AGIs over 200k)
Taxable interest for individuals: $1,198 (reported on 34.3% of returns)
This zip code:
$1,198
Pennsylvania:
$1,633
(% of AGI for various income ranges: 23.2% for AGIs below $25k, 28.4% for AGIs $25k-50k, 43.7% for AGIs $50k-75k, 67.6% for AGIs $75k-100k, 92.5% for AGIs $100k-200k, 1291.4% for AGIs over 200k)
Ordinary dividends: $4,775 (reported on 23.3% of returns)
Here:
$4,775
State:
$7,382
(% of AGI for various income ranges: 36.3% for AGIs below $25k, 45.1% for AGIs $25k-50k, 106.6% for AGIs $50k-75k, 170.0% for AGIs $75k-100k, 374.7% for AGIs $100k-200k, 3845.7% for AGIs over 200k)
Net capital gain/loss in AGI: +$11,704 (reported on 18.5% of returns)
Here:
+$11,704
State:
+$23,522
(% of AGI for various income ranges: 18.4% for AGIs below $25k, 35.1% for AGIs $25k-50k, 93.4% for AGIs $50k-75k, 236.5% for AGIs $75k-100k, 593.7% for AGIs $100k-200k, 11998.6% for AGIs over 200k)
Profit/loss from business: +$15,378 (reported on 12.2% of returns)
Here:
+$15,378
State:
+$16,274
(% of AGI for various income ranges: 84.4% for AGIs below $25k, 116.3% for AGIs $25k-50k, 237.5% for AGIs $50k-75k, 127.0% for AGIs $75k-100k, 641.2% for AGIs $100k-200k, 5775.7% for AGIs over 200k)
Taxable individual retirement arrangement distribution: $15,641 (reported on 12.5% of returns)
17870:
$15,641
Pennsylvania:
$18,583
(% of AGI for various income ranges: 96.1% for AGIs below $25k, 91.3% for AGIs $25k-50k, 297.3% for AGIs $50k-75k, 404.3% for AGIs $75k-100k, 695.1% for AGIs $100k-200k, 3975.7% for AGIs over 200k)
Total itemized deductions: $33,518 (reported on 4.4% of returns)
Here:
$33,518
State:
$34,850
(% of AGI for various income ranges: 75.2% for AGIs $25k-50k, 169.9% for AGIs $50k-75k, 227.6% for AGIs $75k-100k, 479.2% for AGIs $100k-200k, 5430.0% for AGIs over 200k)
Charity contributions: $16,218 (reported on 3.4% of returns)
Here:
$16,218
State:
$12,392
(% of AGI for various income ranges: 10.2% for AGIs $25k-50k, 18.8% for AGIs $50k-75k, 60.7% for AGIs $75k-100k, 140.2% for AGIs $100k-200k, 3312.9% for AGIs over 200k)
Taxes paid: $6,907 (reported on 4.4% of returns)
17870:
$6,907
State:
$8,200
(% of AGI for various income ranges: 9.4% for AGIs $25k-50k, 38.7% for AGIs $50k-75k, 48.9% for AGIs $75k-100k, 134.1% for AGIs $100k-200k, 924.3% for AGIs over 200k)
Earned income credit: $1,968 (reported on 11.9% of returns)
Here:
$1,968
State:
$2,100
(% of AGI for various income ranges: 68.3% for AGIs below $25k, 52.2% for AGIs $25k-50k)
Percentage of individuals using paid preparers for their 2020 taxes: 93.0%
Here:
93%
State:
92%
(% for various income ranges: 90.1% for AGIs below $25k, 94.4% for AGIs $25k-50k, 92.7% for AGIs $50k-75k, 94.0% for AGIs $75k-100k, 95.5% for AGIs $100k-200k, 95.8% for AGIs over 200k)
Averages for the 2012 tax year for zip code 17870, filed in 2013:
Average Adjusted Gross Income (AGI) in 2012: $50,663 (Individual Income Tax Returns)
Here:
$50,663
State:
$61,346
Salary/wage: $43,891 (reported on 81.2% of returns)
Here:
$43,891
State:
$51,902
(% of AGI for various income ranges: 66.8% for AGIs below $25k, 75.8% for AGIs $25k-50k, 75.2% for AGIs $50k-75k, 76.7% for AGIs $75k-100k, 72.8% for AGIs $100k-200k, 51.8% for AGIs over 200k)
Taxable interest for individuals: $1,521 (reported on 38.4% of returns)
This zip code:
$1,521
Pennsylvania:
$1,588
(% of AGI for various income ranges: 1.9% for AGIs below $25k, 0.8% for AGIs $25k-50k, 0.7% for AGIs $50k-75k, 0.7% for AGIs $75k-100k, 0.7% for AGIs $100k-200k, 2.5% for AGIs over 200k)
Ordinary dividends: $3,871 (reported on 25.1% of returns)
Here:
$3,871
State:
$5,827
(% of AGI for various income ranges: 2.7% for AGIs below $25k, 1.4% for AGIs $25k-50k, 1.3% for AGIs $50k-75k, 1.5% for AGIs $75k-100k, 1.7% for AGIs $100k-200k, 3.5% for AGIs over 200k)
Net capital gain/loss in AGI: +$6,362 (reported on 16.5% of returns)
Here:
+$6,362
State:
+$14,495
(% of AGI for various income ranges: 0.4% for AGIs below $25k, 0.7% for AGIs $25k-50k, 0.7% for AGIs $50k-75k, 1.2% for AGIs $75k-100k, 1.5% for AGIs $100k-200k, 7.5% for AGIs over 200k)
Profit/loss from business: +$12,357 (reported on 12.8% of returns)
Here:
+$12,357
State:
+$16,268
(% of AGI for various income ranges: 5.4% for AGIs below $25k, 3.4% for AGIs $25k-50k, 2.2% for AGIs $50k-75k, 1.7% for AGIs $75k-100k, 3.7% for AGIs $100k-200k, 3.3% for AGIs over 200k)
Taxable individual retirement arrangement distribution: $10,178 (reported on 11.8% of returns)
17870:
$10,178
Pennsylvania:
$14,550
(% of AGI for various income ranges: 4.0% for AGIs below $25k, 2.3% for AGIs $25k-50k, 2.2% for AGIs $50k-75k, 2.4% for AGIs $75k-100k, 3.6% for AGIs $100k-200k)
Self-employment retirement plans: $18,733 (reported on 0.5% of returns)
17870:
$18,733
Pennsylvania:
$20,922
Total itemized deductions: $20,980 (19% of AGI, reported on 24.8% of returns)
Here:
$20,980
State:
$23,538
Here:
19.3% of AGI
State:
18.4% of AGI
(% of AGI for various income ranges: 6.6% for AGIs below $25k, 6.2% for AGIs $25k-50k, 8.4% for AGIs $50k-75k, 11.0% for AGIs $75k-100k, 12.8% for AGIs $100k-200k, 13.9% for AGIs over 200k)
Charity contributions: $5,059 (reported on 20.3% of returns)
Here:
$5,059
State:
$4,025
(% of AGI for various income ranges: 0.6% for AGIs below $25k, 0.8% for AGIs $25k-50k, 1.1% for AGIs $50k-75k, 1.6% for AGIs $75k-100k, 2.2% for AGIs $100k-200k, 5.1% for AGIs over 200k)
Taxes paid: $8,303 (reported on 24.6% of returns)
17870:
$8,303
State:
$9,982
(% of AGI for various income ranges: 1.2% for AGIs below $25k, 1.6% for AGIs $25k-50k, 2.9% for AGIs $50k-75k, 4.4% for AGIs $75k-100k, 6.0% for AGIs $100k-200k, 6.1% for AGIs over 200k)
Earned income credit: $1,795 (reported on 14.1% of returns)
Here:
$1,795
State:
$2,106
(% of AGI for various income ranges: 4.0% for AGIs below $25k, 0.9% for AGIs $25k-50k)
Percentage of individuals using paid preparers for their 2012 taxes: 56.2%
Here:
56%
State:
53%
(% for various income ranges: 50.4% for AGIs below $25k, 57.1% for AGIs $25k-50k, 60.0% for AGIs $50k-75k, 60.3% for AGIs $75k-100k, 63.2% for AGIs $100k-200k, 84.6% for AGIs over 200k)
Averages for the 2004 tax year for zip code 17870, filed in 2005:
Average Adjusted Gross Income (AGI) in 2004: $42,855 (Individual Income Tax Returns)
Here:
$42,855
State:
$48,049
Salary/wage: $38,624 (reported on 82.6% of returns)
Here:
$38,624
State:
$42,646
(% of AGI for various income ranges: 92.0% for AGIs below $10k, 67.7% for AGIs $10k-25k, 78.7% for AGIs $25k-50k, 80.7% for AGIs $50k-75k, 82.0% for AGIs $75k-100k, 63.4% for AGIs over 100k)
Taxable interest for individuals: $1,713 (reported on 52.4% of returns)
This zip code:
$1,713
Pennsylvania:
$1,657
(% of AGI for various income ranges: 6.7% for AGIs below $10k, 3.4% for AGIs $10k-25k, 1.4% for AGIs $25k-50k, 1.4% for AGIs $50k-75k, 1.6% for AGIs $75k-100k, 2.8% for AGIs over 100k)
Taxable dividends: $3,073 (reported on 30.7% of returns)
Here:
$3,073
State:
$3,566
(% of AGI for various income ranges: 5.3% for AGIs below $10k, 2.5% for AGIs $10k-25k, 1.4% for AGIs $25k-50k, 1.5% for AGIs $50k-75k, 1.6% for AGIs $75k-100k, 3.4% for AGIs over 100k)
Net capital gain/loss: +$4,997 (reported on 22.3% of returns)
Here:
+$4,997
State:
+$9,716
(% of AGI for various income ranges: -0.8% for AGIs below $10k, 0.7% for AGIs $10k-25k, 1.1% for AGIs $25k-50k, 1.3% for AGIs $50k-75k, 1.6% for AGIs $75k-100k, 6.0% for AGIs over 100k)
Profit/loss from business: +$12,420 (reported on 13.1% of returns)
Here:
+$12,420
State:
+$14,267
(% of AGI for various income ranges: 2.2% for AGIs below $10k, 4.9% for AGIs $10k-25k, 3.5% for AGIs $25k-50k, 2.9% for AGIs $50k-75k, 2.8% for AGIs $75k-100k, 4.9% for AGIs over 100k)
IRA payment deduction: $2,938 (reported on 3.1% of returns)
17870:
$2,938
Pennsylvania:
$2,903
(% of AGI for various income ranges: 0.2% for AGIs $10k-25k, 0.3% for AGIs $25k-50k, 0.2% for AGIs $50k-75k, 0.2% for AGIs $75k-100k, 0.2% for AGIs over 100k)
Self-employed pension: $13,795 (reported on 0.7% of returns)
Here:
$13,795
Pennsylvania:
$14,674
Total itemized deductions: $16,375 (19% of AGI, reported on 27.4% of returns)
Here:
$16,375
State:
$18,804
Here:
19.3% of AGI
State:
19.5% of AGI
(% of AGI for various income ranges: 5.4% for AGIs below $10k, 5.5% for AGIs $10k-25k, 7.9% for AGIs $25k-50k, 10.9% for AGIs $50k-75k, 12.8% for AGIs $75k-100k, 12.7% for AGIs over 100k)
Charity contributions deductions: $3,581 (4% of AGI, reported on 23.5% of returns)
Here:
$3,581
State:
$3,337
Here:
4.0% of AGI
State:
3.3% of AGI
(% of AGI for various income ranges: 0.3% for AGIs below $10k, 0.6% for AGIs $10k-25k, 1.1% for AGIs $25k-50k, 1.5% for AGIs $50k-75k, 2.1% for AGIs $75k-100k, 3.4% for AGIs over 100k)
Total tax: $6,155 (reported on 76.2% of returns)
17870:
$6,155
State:
$8,008
(% of AGI for various income ranges: 2.1% for AGIs below $10k, 4.2% for AGIs $10k-25k, 7.0% for AGIs $25k-50k, 8.6% for AGIs $50k-75k, 10.5% for AGIs $75k-100k, 18.5% for AGIs over 100k)
Earned income credit: $1,500 (reported on 11.4% of returns)
Here:
$1,500
State:
$1,643
Percentage of individuals using paid preparers for their 2004 taxes: 58.3%
Here:
58%
State:
56%
(% for various income ranges: 51.8% for AGIs below $10k, 58.3% for AGIs $10k-25k, 59.3% for AGIs $25k-50k, 59.1% for AGIs $50k-75k, 60.3% for AGIs $75k-100k, 70.2% for AGIs over 100k)
Likely homosexual households (counted as self-reported same-sex unmarried-partner households)
Lesbian couples: 0.0% of all households
Gay men: 0.5% of all households
Household received Food Stamps/SNAP in the past 12 months: 463 Household did not receive Food Stamps/SNAP in the past 12 months: 4,685
Women who had a birth in the past 12 months: 139 (52 now married, 77 unmarried) Women who did not have a birth in the past 12 months: 3,584 (1,011 now married, 2,586 unmarried)
Housing units in zip code 17870 with a mortgage: 1,800 (176 second mortgage, 170 both second mortgage and home equity loan) Houses without a mortgage: 70
Median monthly owner costs for units with a mortgage: $1,436 Median monthly owner costs for units without a mortgage: $573
Residents with income below the poverty level in 2022:
This zip code:
7.7%
Whole state:
11.8%
Residents with income below 50% of the poverty level in 2022:
This zip code:
4.6%
Whole state:
6.1%
Median number of rooms in houses and condos:
Here:
6.8
State:
6.8
Median number of rooms in apartments:
Here:
4.4
State:
4.3
Notable locations in this zip code not listed on our city pages
Notable locations in zip code 17870: Shikellamy Overlook (A), Susquehanna Valley Country Club (B), James W Garrett Sports Complex (C), Sassafras Complex (D), Clement Station (E), Clifford Station (F), EMTS Ambulance Service (G), Aikens Hall (H), Apfelbaum Hall (I), Blough-Weis Library (J), Bogar Hall (K), Center for Music and Art (L), Degenstein Campus Center (M), Hassinger Hall (N), Isaacs House (O), Jacobs Fitness Center (P), Phi Mu Delta (Q), Scholar's House (R), Selins Grove (S), Shobert Hall (T). Display/hide their locations on the map
Parks in zip code 17870 include: Rolling Green Amusement Park (1), State Game Lands Number 212 (2), Nicholas A Lopardo Football and Track Stadium (3), Douglas E Arthur Practice Football Field (4), Shikellamy State Park (5). Display/hide their locations on the map
In group quarters: 2,697 (-1 institutionalized population)
Size of family households: 1,667 2-persons, 701 3-persons, 473 4-persons, 281 5-persons, 82 6-persons, 7 7-or-more-persons
Size of nonfamily households: 1,624 1-person, 287 2-persons, 43 3-persons
1,359 married couples with children.
656 single-parent households (230 men, 426 women).
93.3% of residents of 17870 zip code speak English at home.
2.1% of residents speak Spanish at home (76% very well, 11% well, 13% not well).
3.1% of residents speak other Indo-European language at home (77% very well, 16% well, 6% not well).
0.7% of residents speak Asian or Pacific Island language at home (100% very well).
0.6% of residents speak other language at home (100% very well).
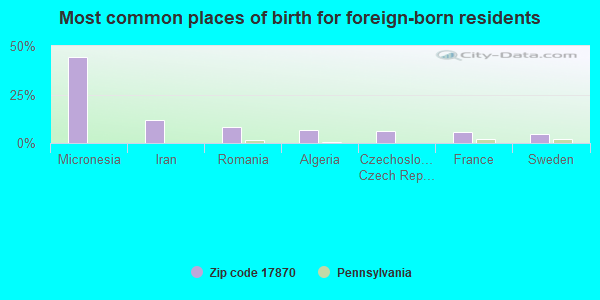
Foreign born population: 207 (1.4%) (56.5% of them are naturalized citizens)
This zip code:
1.4%
Whole state:
7.5%
44%Micronesia
12%Iran
8%Romania
7%Algeria
6%Czechoslovakia (includes Czech Republic and Slovakia)
6%France
5%Sweden
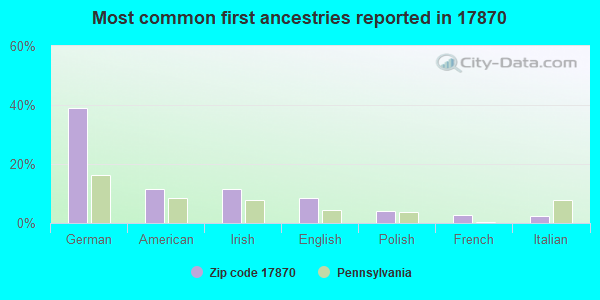
39%German
12%American
11%Irish
8%English
4%Polish
3%French
2%Italian
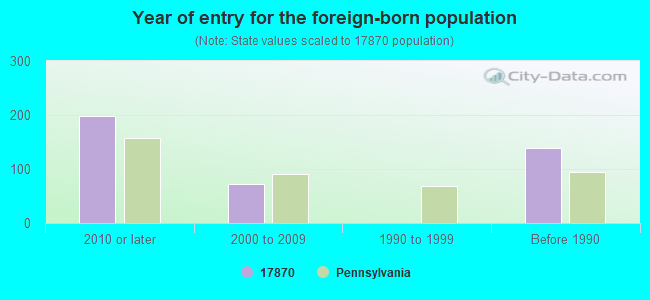
Year of entry for the foreign-born population
1992010 or later
722000 to 2009
01990 to 1999
139Before 1990
Facilities with environmental interests located in this zip code:
AMP INCORPORATED SELINSGROVE (713 BRIDGE ST in SELINSGROVE, PA)
AIR MINOR (AIRS/AFS) HAZARDOUS WASTE BIENNIAL REPORTER (Resource Conservation and Recovery Act (tracking hazardous waste)) (Resource Conservation and Recovery Act (tracking hazardous waste)) TRI REPORTER (Tracking of toxic chemicals releasing facilities) Business SIC classification: HAND AND EDGE TOOLS, EXCEPT MACHINE TOOLS AND HANDSAWS; METAL STAMPINGS; FABRICATED METAL PRODUCTS; POWER-DRIVEN HANDTOOLS Alternative names: A M P INC, AMP INC. BLDG. 37, TYCO ELECTRONICS COR/SELINSGROVE PLT
AUBREY ALEXANDER TOYOTA (RT 11 & 15, RD#4 in SELINGROVE, PA)
AIR MINOR (AIRS/AFS) Business SIC classification: MOTOR VEHICLE DEALERS (NEW AND USED)
BECKER VOLKSWAGEN INC (RTS 11 & 15 in SELINGSGROVE, PA)
Small Quantity Generators, between 100 kg and 1000 kg of hazardous waste/month (Resource Conservation and Recovery Act (tracking hazardous waste)) - notification Organizations: OPERNAME (CONTACT/OPERATOR)
, BECKER, WILLIAM (CONTACT/OWNER)
Housing units lacking complete plumbing facilities: 1.5% Housing units lacking complete kitchen facilities: 4.8%
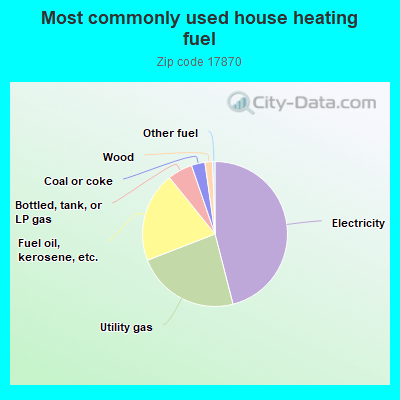
45.6%Electricity
22.9%Utility gas
19.9%Fuel oil, kerosene, etc.
5.5%Bottled, tank, or LP gas
3.0%Coal or coke
1.7%Wood
0.5%Other fuel
Population in 1990: 14,796. Population change in the 1990s: +549 (+3.7%).
Place of birth for U.S.-born residents:
This state: 10,847
Northeast: 1,825
Midwest: 273
South: 829
West: 114
61% of the 17870 zip code residents lived in the same house 5 years ago. Out of people who lived in different houses, 40% lived in this county. Out of people who lived in different counties, 50% lived in Pennsylvania.
92% of the 17870 zip code residents lived in the same house 1 year ago. Out of people who lived in different houses, 34% moved from this county. Out of people who lived in different houses, 41% moved from different county within same state. Out of people who lived in different houses, 26% moved from different state.
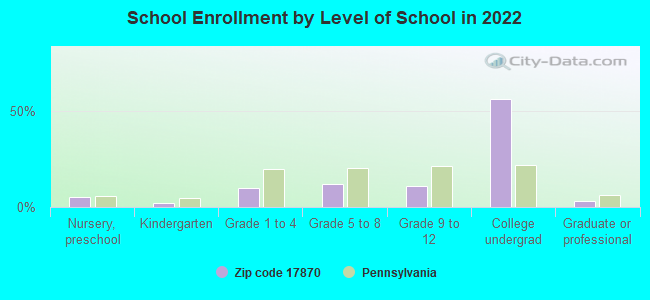
Private vs. public school enrollment:
Students in private schools in grades 1 to 8 (elementary and middle school): 81
Here:
8.8%
Pennsylvania:
15.7%
Students in private schools in grades 9 to 12 (high school): 20
Here:
4.3%
Pennsylvania:
13.4%
Students in private undergraduate colleges: 2,288
Here:
97.2%
Pennsylvania:
39.8%
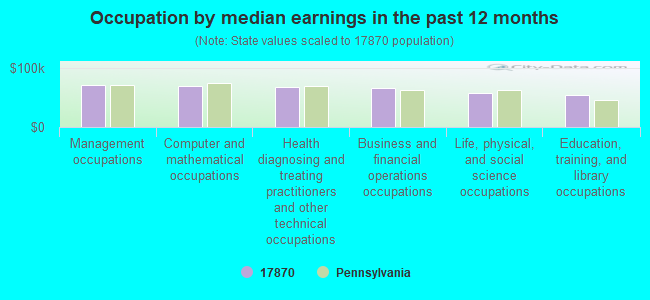
Occupation by median earnings in the past 12 months ($)
70,714Management occupations
69,142Computer and mathematical occupations
68,713Health diagnosing and treating practitioners and other technical occupations
66,268Business and financial operations occupations
58,264Life, physical, and social science occupations
54,513Education, training, and library occupations
Companies with federal contracts located in this zip code:
BRAKETECHNIQUE, INC (11 UNIVERSAL ROAD in SELINSGROVE, PA; small business) : $602,073 in 32 contractsfrom 2000 to 2006
Contracts for Torque Converters and Speed Changers, Vehicular Power Transmission Components, Non-nuclear Ship Repair (East) Ship repair (including overhauls and conversions) performed on non-nuclear propelled and nonpropelled ships east of the 108th meridian, Vessel Freight, and moreby Navy, Defense Logistics Agency, U.S. Army Corps of Engineers - civil program financing only, Army, and others Signed by year:2000: $181,352; 2001: $78,614; 2002: $30,375; 2003: $0; 2004: $109,106; 2005: $72,792; 2006: $129,834.
Biggest contracts:
$181,352 with Navy for Torque Converters and Speed Changers. Signed on 2000-10-27. Completion date: 2001-04-05.
$44,728 with Defense Logistics Agency for Vehicular Power Transmission Components. Signed on 2001-10-12. Completion date: 2001-12-11.
$41,289 with Navy for Non-nuclear Ship Repair (East) Ship repair (including overhauls and conversions) performed on non-nuclear propelled and nonpropelled ships east of the 108th meridian. Taking place in VA. Signed on 2006-01-11. Completion date: 2006-04-20.
$41,234 with Navy for Vessel Freight. Taking place in VA. Signed on 2006-06-20. Completion date: 2006-09-19.
L/B WATER SERVICE INC (550 S HIGH ST in SELINSGROVE, PA; small business) : $25,912 in 4 contractsfrom 2003 to 2005
$9,000 with Army for Hose, Pipe, Tube, Lubrication, and Railing Fittings. Signed on 2005-09-14. Completion date: 2005-11-22.
$6,531 with Bureau of Prisoners/Federal Prison System for Hose, Pipe, Tube, Lubrication, and Railing Fittings. Signed on 2005-03-16. Completion date: 2005-03-31.
$6,318 with Bureau of Prisoners/Federal Prison System for Plastics Fabricated Materials. Signed on 2004-11-17. Completion date: 2004-11-30.
$4,063 with Army for Hardware, Commercial. Signed on 2003-01-17. Completion date: 2003-02-05.
Top industries in this zip code by the number of employees in 2005:
Educational Services: Colleges, Universities, and Professional Schools (over 1000 employees: 1 establishment)
Health Care and Social Assistance: Nursing Care Facilities (100-249: 1, 20-49: 1)
Health Care and Social Assistance: Services for the Elderly and Persons with Disabilities (100-249: 1, 1-4: 1)
People in group quarters in 2010:
1,604 people in college/university student housing
328 people in state prisons
153 people in nursing facilities/skilled-nursing facilities
105 people in local jails and other municipal confinement facilities
9 people in group homes intended for adults
People in group quarters in 2000:
1,316 people in college dormitories (includes college quarters off campus)
524 people in schools, hospitals, or wards for the intellectually disabled
220 people in nursing homes
121 people in local jails and other confinement facilities (including police lockups)
32 people in federal prisons and detention centers
11 people in homes for the mentally retarded
7 people in other noninstitutional group quarters
Fatal accident statistics in 2014:
Fatal accident count: 3
Vehicles involved in fatal accidents: 6
Fatal accidents caused by drunken drivers: 0
Fatalities: 3
Persons involved in fatal accidents: 9
Pedestrians involved in fatal accidents: 0
Fatal accident statistics in 2013:
Fatal accident count: 1
Vehicles involved in fatal accidents: 2
Fatal accidents caused by drunken drivers: 1
Fatalities: 1
Persons involved in fatal accidents: 3
Pedestrians involved in fatal accidents: 0
2003 - 2018 National Fire Incident Reporting System (NFIRS) incidents
Based on the data from the years 2003 - 2018 the average number of fire incidents per year is 14. The highest number of fires - 59 took place in 2018, and the least - 0 in 2005. The data has a growing trend.
When looking into fire subcategories, the most incidents belonged to: Structure Fires (68.3%), and Outside Fires (19.6%).
Fire incident types reported to NFIRS in Zip Code 17870


 Nearest zip codes: 17889, 17876, 17827, 17855, 17864, 17823.


 Based on the data from the years 2003 - 2018 the average number of fire incidents per year is 14. The highest number of fires - 59 took place in 2018, and the least - 0 in 2005. The data has a growing trend.
 When looking into fire subcategories, the most incidents belonged to: Structure Fires (68.3%), and Outside Fires (19.6%).