Estimated zip code population in 2022: 3,678 Zip code population in 2010: 3,738 Zip code population in 2000: 3,634
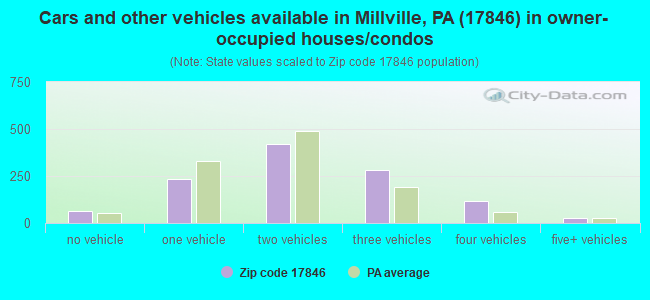
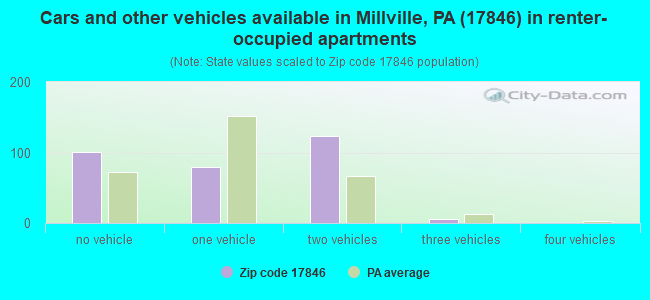
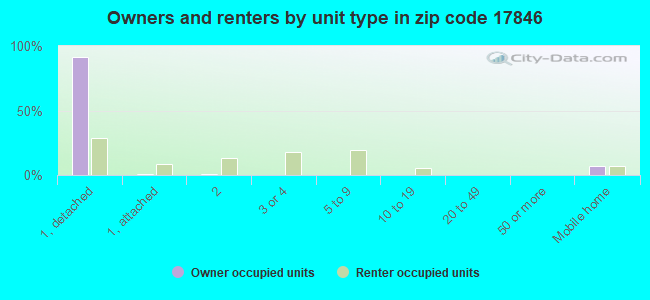
Houses and condos: 1,660 Renter-occupied apartments: 309
% of renters here:
21%
State:
31%
March 2022 cost of living index in zip code 17846: 92.0 (less than average, U.S. average is 100)
Land area: 46.4 sq. mi. Water area: 0.2 sq. mi.
Population density: 79 people per square mile
(very low).
OSM Map
General Map
Google Map
MSN Map
OSM Map
General Map
Google Map
MSN Map
OSM Map
General Map
Google Map
MSN Map
OSM Map
General Map
Google Map
MSN Map
Please wait while loading the map...
Real estate property taxes paid for housing units in 2022:
This zip code:
1.0% ($2,142)
Pennsylvania:
1.3% ($3,094)
Median real estate property taxes paid for housing units with mortgages in 2022: $2,187 (1.0%) Median real estate property taxes paid for housing units with no mortgage in 2022: $2,093 (1.0%)
Business Search- 14 Million verified businesses
Males: 1,735
(47.2%)
Females: 1,943
(52.8%)
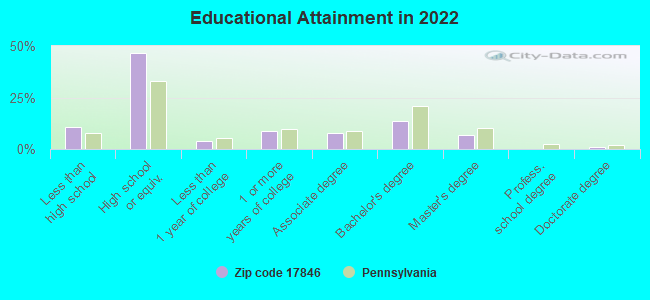
For population 25 years and over in 17846:
High school or higher: 87.9%
Bachelor's degree or higher: 21.5%
Graduate or professional degree: 8.0%
Unemployed: 2.9%
Mean travel time to work (commute): 24.1 minutes
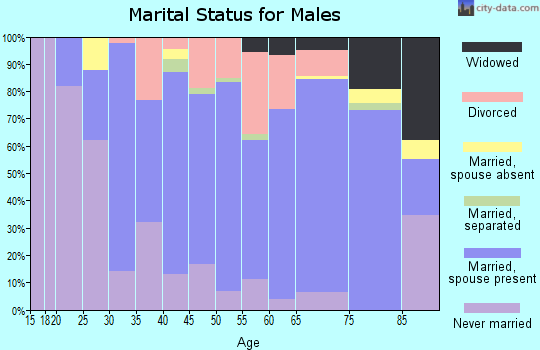
For population 15 years and over in 17846:
Never married: 24.8%
Now married: 54.8%
Separated: 1.2%
Widowed: 7.5%
Divorced: 11.6%
Zip code 17846 compared to state average:
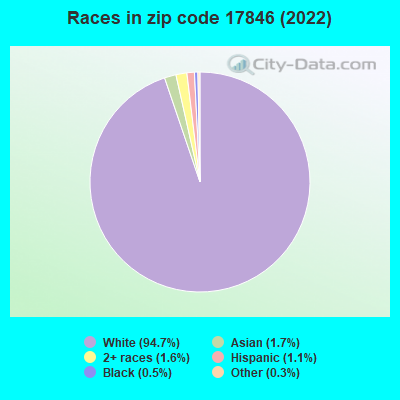
Black race population percentage significantly below state average.
Hispanic race population percentage significantly below state average.
Median age above state average.
Foreign-born population percentage significantly below state average.
Length of stay since moving in significantly above state average.
Percentage of population with a bachelor's degree or higher below state average.
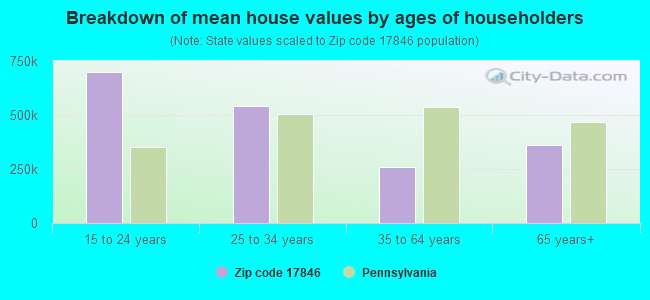
Estimated median house/condo value in 2022: $221,297
17846:
$221,297
Pennsylvania:
$245,500
According to our research of Pennsylvania and other state lists, there were 7 registered sex offenders living in 17846 zip code as of July 04, 2024. The ratio of all residents to sex offenders in zip code 17846 is 552 to 1. The ratio of registered sex offenders to all residents in this zip code is near the state average.
Median resident age:
This zip code:
45.5 years
Pennsylvania median age:
40.9 years
Average household size:
This zip code:
2.4 people
Pennsylvania:
2.4 people
Averages for the 2020 tax year for zip code 17846, filed in 2021:
Average Adjusted Gross Income (AGI) in 2020: $56,859 (Individual Income Tax Returns)
Here:
$56,859
State:
$75,707
Salary/wage: $49,986 (reported on 79.4% of returns)
Here:
$49,986
State:
$62,806
(% of AGI for various income ranges: 1053.8% for AGIs below $25k, 3450.3% for AGIs $25k-50k, 6078.0% for AGIs $50k-75k, 9548.6% for AGIs $75k-100k, 15213.7% for AGIs $100k-200k)
Taxable interest for individuals: $1,052 (reported on 29.7% of returns)
This zip code:
$1,052
Pennsylvania:
$1,633
(% of AGI for various income ranges: 45.0% for AGIs below $25k, 11.2% for AGIs $25k-50k, 68.0% for AGIs $50k-75k, 42.9% for AGIs $75k-100k, 77.5% for AGIs $100k-200k)
Ordinary dividends: $3,291 (reported on 19.4% of returns)
Here:
$3,291
State:
$7,382
(% of AGI for various income ranges: 34.4% for AGIs below $25k, 67.0% for AGIs $25k-50k, 36.0% for AGIs $50k-75k, 65.7% for AGIs $75k-100k, 385.6% for AGIs $100k-200k)
Net capital gain/loss in AGI: +$8,685 (reported on 15.4% of returns)
Here:
+$8,685
State:
+$23,522
(% of AGI for various income ranges: 9.1% for AGIs below $25k, 24.8% for AGIs $25k-50k, 122.5% for AGIs $50k-75k, 173.6% for AGIs $75k-100k, 1090.0% for AGIs $100k-200k)
Profit/loss from business: +$16,887 (reported on 13.1% of returns)
Here:
+$16,887
State:
+$16,274
(% of AGI for various income ranges: 101.8% for AGIs below $25k, 134.2% for AGIs $25k-50k, 308.5% for AGIs $50k-75k, 224.3% for AGIs $75k-100k, 1352.5% for AGIs $100k-200k)
Taxable individual retirement arrangement distribution: $13,835 (reported on 11.4% of returns)
17846:
$13,835
Pennsylvania:
$18,583
(% of AGI for various income ranges: 100.3% for AGIs below $25k, 153.3% for AGIs $25k-50k, 122.5% for AGIs $50k-75k, 383.6% for AGIs $75k-100k, 711.2% for AGIs $100k-200k)
Total itemized deductions: $27,517 (reported on 3.4% of returns)
Here:
$27,517
State:
$34,850
(% of AGI for various income ranges: 205.2% for AGIs $25k-50k, 608.8% for AGIs $100k-200k)
Charity contributions: $11,500 (reported on 1.7% of returns)
Here:
$11,500
State:
$12,392
(% of AGI for various income ranges: 215.6% for AGIs $100k-200k)
Taxes paid: $6,483 (reported on 3.4% of returns)
17846:
$6,483
State:
$8,200
(% of AGI for various income ranges: 36.7% for AGIs $25k-50k, 167.5% for AGIs $100k-200k)
Earned income credit: $1,875 (reported on 11.4% of returns)
Here:
$1,875
State:
$2,100
(% of AGI for various income ranges: 57.1% for AGIs below $25k, 54.8% for AGIs $25k-50k)
Percentage of individuals using paid preparers for their 2020 taxes: 92.0%
Here:
92%
State:
92%
(% for various income ranges: 90.9% for AGIs below $25k, 93.2% for AGIs $25k-50k, 88.9% for AGIs $50k-75k, 95.2% for AGIs $75k-100k, 95.8% for AGIs $100k-200k, 75.0% for AGIs over 200k)
Averages for the 2012 tax year for zip code 17846, filed in 2013:
Average Adjusted Gross Income (AGI) in 2012: $47,089 (Individual Income Tax Returns)
Here:
$47,089
State:
$61,346
Salary/wage: $43,013 (reported on 81.6% of returns)
Here:
$43,013
State:
$51,902
(% of AGI for various income ranges: 65.7% for AGIs below $25k, 80.4% for AGIs $25k-50k, 76.4% for AGIs $50k-75k, 78.2% for AGIs $75k-100k, 70.2% for AGIs $100k-200k)
Taxable interest for individuals: $895 (reported on 35.1% of returns)
This zip code:
$895
Pennsylvania:
$1,588
(% of AGI for various income ranges: 2.1% for AGIs below $25k, 0.7% for AGIs $25k-50k, 0.6% for AGIs $50k-75k, 0.2% for AGIs $75k-100k, 0.5% for AGIs $100k-200k)
Ordinary dividends: $2,292 (reported on 21.8% of returns)
Here:
$2,292
State:
$5,827
(% of AGI for various income ranges: 2.2% for AGIs below $25k, 0.9% for AGIs $25k-50k, 0.9% for AGIs $50k-75k, 0.7% for AGIs $75k-100k, 1.1% for AGIs $100k-200k)
Net capital gain/loss in AGI: +$2,115 (reported on 15.5% of returns)
Here:
+$2,115
State:
+$14,495
(% of AGI for various income ranges: 0.3% for AGIs below $25k, 0.5% for AGIs $25k-50k, 1.8% for AGIs $100k-200k)
Profit/loss from business: +$11,876 (reported on 14.4% of returns)
Here:
+$11,876
State:
+$16,268
(% of AGI for various income ranges: 8.3% for AGIs below $25k, 3.9% for AGIs $25k-50k, 2.0% for AGIs $50k-75k, 3.6% for AGIs $75k-100k, 3.2% for AGIs $100k-200k)
Taxable individual retirement arrangement distribution: $10,762 (reported on 12.1% of returns)
17846:
$10,762
Pennsylvania:
$14,550
(% of AGI for various income ranges: 5.7% for AGIs below $25k, 2.4% for AGIs $25k-50k, 4.7% for AGIs $50k-75k, 2.3% for AGIs $100k-200k)
Total itemized deductions: $17,308 (19% of AGI, reported on 23.0% of returns)
Here:
$17,308
State:
$23,538
Here:
19.2% of AGI
State:
18.4% of AGI
(% of AGI for various income ranges: 4.5% for AGIs below $25k, 4.9% for AGIs $25k-50k, 8.3% for AGIs $50k-75k, 9.6% for AGIs $75k-100k, 11.4% for AGIs $100k-200k)
Charity contributions: $3,100 (reported on 16.1% of returns)
Here:
$3,100
State:
$4,025
(% of AGI for various income ranges: 0.5% for AGIs $25k-50k, 0.8% for AGIs $50k-75k, 1.4% for AGIs $75k-100k, 1.7% for AGIs $100k-200k)
Taxes paid: $6,850 (reported on 23.0% of returns)
17846:
$6,850
State:
$9,982
(% of AGI for various income ranges: 1.2% for AGIs below $25k, 1.4% for AGIs $25k-50k, 2.7% for AGIs $50k-75k, 3.7% for AGIs $75k-100k, 5.5% for AGIs $100k-200k)
Earned income credit: $1,962 (reported on 14.9% of returns)
Here:
$1,962
State:
$2,106
(% of AGI for various income ranges: 4.6% for AGIs below $25k, 0.9% for AGIs $25k-50k)
Percentage of individuals using paid preparers for their 2012 taxes: 56.9%
Here:
57%
State:
53%
(% for various income ranges: 54.5% for AGIs below $25k, 54.3% for AGIs $25k-50k, 64.3% for AGIs $50k-75k, 62.5% for AGIs $75k-100k, 55.6% for AGIs $100k-200k)
Averages for the 2004 tax year for zip code 17846, filed in 2005:
Average Adjusted Gross Income (AGI) in 2004: $36,858 (Individual Income Tax Returns)
Here:
$36,858
State:
$48,049
Salary/wage: $33,418 (reported on 85.0% of returns)
Here:
$33,418
State:
$42,646
(% of AGI for various income ranges: 95.6% for AGIs below $10k, 74.3% for AGIs $10k-25k, 79.6% for AGIs $25k-50k, 83.2% for AGIs $50k-75k, 78.4% for AGIs $75k-100k, 63.7% for AGIs over 100k)
Taxable interest for individuals: $1,005 (reported on 47.4% of returns)
This zip code:
$1,005
Pennsylvania:
$1,657
(% of AGI for various income ranges: 5.6% for AGIs below $10k, 2.5% for AGIs $10k-25k, 1.3% for AGIs $25k-50k, 0.7% for AGIs $50k-75k, 1.1% for AGIs $75k-100k, 0.8% for AGIs over 100k)
Taxable dividends: $1,579 (reported on 25.8% of returns)
Here:
$1,579
State:
$3,566
(% of AGI for various income ranges: 4.1% for AGIs below $10k, 1.6% for AGIs $10k-25k, 0.9% for AGIs $25k-50k, 0.9% for AGIs $50k-75k, 1.2% for AGIs $75k-100k, 0.8% for AGIs over 100k)
Net capital gain/loss: +$4,681 (reported on 18.2% of returns)
Here:
+$4,681
State:
+$9,716
(% of AGI for various income ranges: -3.9% for AGIs below $10k, 1.3% for AGIs $10k-25k, 1.4% for AGIs $25k-50k, 0.4% for AGIs $50k-75k, 4.2% for AGIs $75k-100k, 5.8% for AGIs over 100k)
Profit/loss from business: +$8,218 (reported on 15.8% of returns)
Here:
+$8,218
State:
+$14,267
(% of AGI for various income ranges: 8.6% for AGIs below $10k, 8.1% for AGIs $10k-25k, 4.2% for AGIs $25k-50k, 2.3% for AGIs $50k-75k, 2.7% for AGIs $75k-100k, 1.5% for AGIs over 100k)
IRA payment deduction: $2,895 (reported on 2.2% of returns)
17846:
$2,895
Pennsylvania:
$2,903
Total itemized deductions: $14,657 (20% of AGI, reported on 21.0% of returns)
Here:
$14,657
State:
$18,804
Here:
19.5% of AGI
State:
19.5% of AGI
(% of AGI for various income ranges: 3.5% for AGIs $10k-25k, 6.8% for AGIs $25k-50k, 10.1% for AGIs $50k-75k, 10.5% for AGIs $75k-100k, 10.6% for AGIs over 100k)
Charity contributions deductions: $2,355 (3% of AGI, reported on 16.7% of returns)
Here:
$2,355
State:
$3,337
Here:
2.9% of AGI
State:
3.3% of AGI
(% of AGI for various income ranges: 1.5% for AGIs below $10k, 0.7% for AGIs $25k-50k, 1.0% for AGIs $50k-75k, 1.5% for AGIs $75k-100k, 1.8% for AGIs over 100k)
Total tax: $4,797 (reported on 74.6% of returns)
17846:
$4,797
State:
$8,008
(% of AGI for various income ranges: 2.6% for AGIs below $10k, 4.8% for AGIs $10k-25k, 6.6% for AGIs $25k-50k, 8.1% for AGIs $50k-75k, 11.2% for AGIs $75k-100k, 18.9% for AGIs over 100k)
Earned income credit: $1,400 (reported on 13.7% of returns)
Here:
$1,400
State:
$1,643
Percentage of individuals using paid preparers for their 2004 taxes: 60.9%
Here:
61%
State:
56%
(% for various income ranges: 56.4% for AGIs below $10k, 58.2% for AGIs $10k-25k, 63.8% for AGIs $25k-50k, 64.2% for AGIs $50k-75k, 60.2% for AGIs $75k-100k, 71.0% for AGIs over 100k)
Likely homosexual households (counted as self-reported same-sex unmarried-partner households)
Lesbian couples: 0.0% of all households
Gay men: 0.1% of all households
Household received Food Stamps/SNAP in the past 12 months: 125 Household did not receive Food Stamps/SNAP in the past 12 months: 1,337
Women who had a birth in the past 12 months: 31 (33 now married, 0 unmarried) Women who did not have a birth in the past 12 months: 834 (353 now married, 480 unmarried)
Housing units in zip code 17846 with a mortgage: 564 (53 second mortgage, 42 both second mortgage and home equity loan) Houses without a mortgage: 37
Median monthly owner costs for units with a mortgage: $1,296 Median monthly owner costs for units without a mortgage: $475
Residents with income below the poverty level in 2022:
This zip code:
12.4%
Whole state:
11.8%
Residents with income below 50% of the poverty level in 2022:
This zip code:
9.1%
Whole state:
6.1%
Median number of rooms in houses and condos:
Here:
6.6
State:
6.8
Median number of rooms in apartments:
Here:
4.3
State:
4.3
Notable locations in this zip code not listed on our city pages
Streams, rivers, and creeks: West Branch Run (A), Spruce Run (B), Devil Hole Run (C), Wolfhouse Run (D), Shingle Run (E), Lick Run (F), Deerlick Run (G). Display/hide their locations on the map
In group quarters: 114 (-1 institutionalized population)
Size of family households: 462 2-persons, 223 3-persons, 143 4-persons, 95 5-persons, 3 6-persons, 30 7-or-more-persons
Size of nonfamily households: 407 1-person, 101 2-persons
553 married couples with children.
95 single-parent households (34 men, 61 women).
95.6% of residents of 17846 zip code speak English at home.
1.0% of residents speak Spanish at home (82% very well, 18% well).
2.6% of residents speak other Indo-European language at home (54% very well, 42% well, 3% not well).
0.3% of residents speak Asian or Pacific Island language at home (50% very well, 50% well).
0.1% of residents speak other language at home (100% very well).
Foreign born population: 101 (2.8%) (52.0% of them are naturalized citizens)
This zip code:
2.8%
Whole state:
7.5%
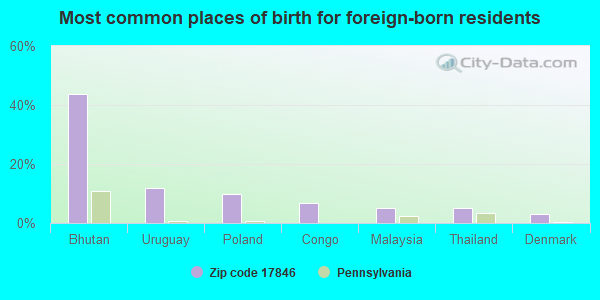
44%Bhutan
12%Uruguay
10%Poland
7%Congo
5%Malaysia
5%Thailand
3%Denmark
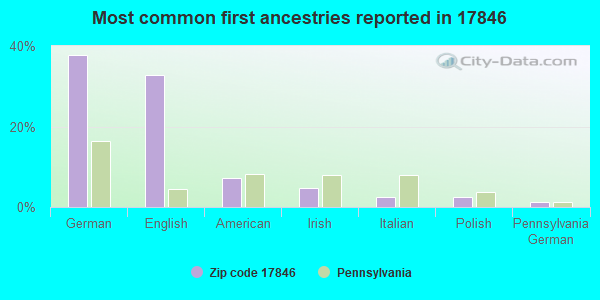
38%German
33%English
7%American
5%Irish
3%Italian
2%Polish
1%Pennsylvania German
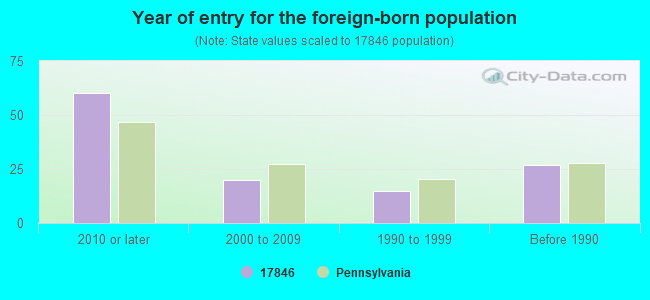
Year of entry for the foreign-born population
602010 or later
202000 to 2009
151990 to 1999
27Before 1990
Facilities with environmental interests located in this zip code:
JEFFREY W HOPPER RES (204 LEGION RD in MILLVILLE, PA)
STATE MASTER (Pennsylvania database) - PCS-PAG045033, National Pollutant Discharge Elimination System Permit National Pollutant Discharge Elimination System NON-MAJOR (Tracking pollutant discharge elimination systems) - permit Business SIC classification: OPERATORS OF DWELLINGS OTHER THAN APARTMENT BUILDINGS Alternative names: DONNA K NEVIUS & RANDY S NEVIUS SFTF, HOPPER, JEFFREY, NEVIUS, RANDY & DONNA, RANDY & DONNA NEVIUS
BLOOMSBURG UNIV (MAIN CAMPUS in BLOOMSBURG, PA)
COMPLIANCE ACTIVITY (Tracking inspections of insecticide, fungicide, and rodenticide, and toxic substances)
Housing units lacking complete plumbing facilities: 1.7% Housing units lacking complete kitchen facilities: 2.6%
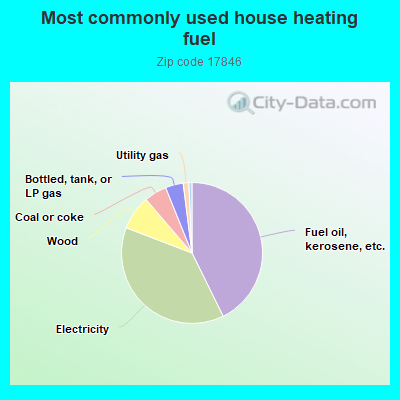
42.8%Fuel oil, kerosene, etc.
38.2%Electricity
7.9%Wood
5.2%Coal or coke
4.1%Bottled, tank, or LP gas
1.3%Utility gas
Population in 1990: 5,496.
Place of birth for U.S.-born residents:
This state: 3,211
Northeast: 137
Midwest: 59
South: 111
West: 12
66% of the 17846 zip code residents lived in the same house 5 years ago. Out of people who lived in different houses, 66% lived in this county. Out of people who lived in different counties, 50% lived in Pennsylvania.
94% of the 17846 zip code residents lived in the same house 1 year ago. Out of people who lived in different houses, 66% moved from this county. Out of people who lived in different houses, 25% moved from different county within same state. Out of people who lived in different houses, 8% moved from different state. Out of people who lived in different houses, 2% moved from abroad.
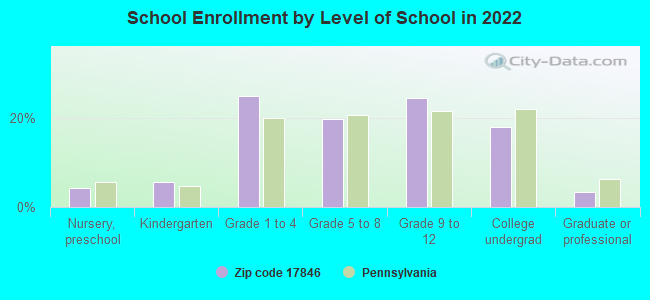
Private vs. public school enrollment:
Students in private schools in grades 1 to 8 (elementary and middle school): 47
Here:
15.1%
Pennsylvania:
15.7%
Students in private schools in grades 9 to 12 (high school): 30
Here:
17.7%
Pennsylvania:
13.4%
Students in private undergraduate colleges: 16
Here:
12.8%
Pennsylvania:
39.8%
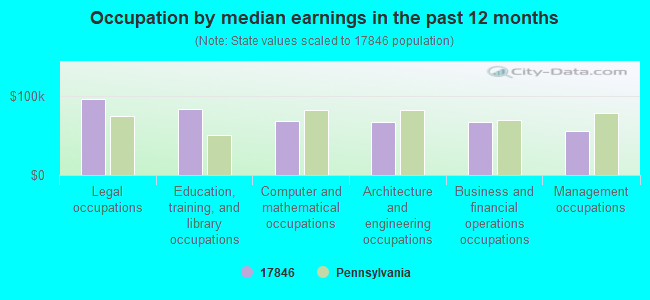
Occupation by median earnings in the past 12 months ($)
96,031Legal occupations
83,571Education, training, and library occupations
68,365Computer and mathematical occupations
67,549Architecture and engineering occupations
66,445Business and financial operations occupations
54,975Management occupations
Companies with federal contracts located in this zip code:
NEXARC INC (2606B SHORT RD in MILLVILLE, PA; small business) : $30,463 in 3 contractsfrom 2005 to 2006
$10,440 with Defense Logistics Agency for Miscellaneous Welding, Soldering, and Brazing Supplies and Accessories. Signed on 2006-04-27. Completion date: 2006-06-27.
$10,103, same as above.Signed on 2005-05-03. Completion date: 2005-07-19.
$9,920, same as above.Signed on 2005-03-31. Completion date: 2005-05-16.
Top industries in this zip code by the number of employees in 2005:
Health Care and Social Assistance: Nursing Care Facilities (100-249 employees: 1 establishment)
Administrative and Support and Waste Management and Remediation Services: Temporary Help Services (20-49: 1)
Educational Services: Elementary and Secondary Schools (20-49: 1)
Finance and Insurance: Direct Property and Casualty Insurance Carriers (20-49: 1)
Finance and Insurance: Insurance Agencies and Brokerages (5-9: 3, 1-4: 1)
Health Care and Social Assistance: Child Day Care Services (10-19: 1, 1-4: 2)
Administrative and Support and Waste Management and Remediation Services: Hazardous Waste Treatment and Disposal (10-19: 1)
People in group quarters in 2010:
88 people in nursing facilities/skilled-nursing facilities
People in group quarters in 2000:
136 people in nursing homes
Fatal accident statistics in 2013:
Fatal accident count: 4
Vehicles involved in fatal accidents: 6
Fatal accidents caused by drunken drivers: 1
Fatalities: 4
Persons involved in fatal accidents: 6
Pedestrians involved in fatal accidents: 0
Fatal accident statistics in 2010:
Fatal accident count: 2
Vehicles involved in fatal accidents: 2
Fatal accidents caused by drunken drivers: 1
Fatalities: 2
Persons involved in fatal accidents: 2
Pedestrians involved in fatal accidents: 0
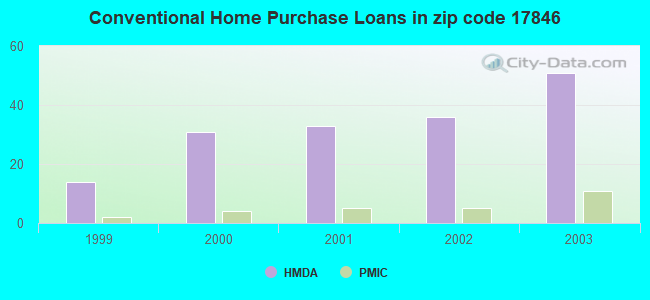
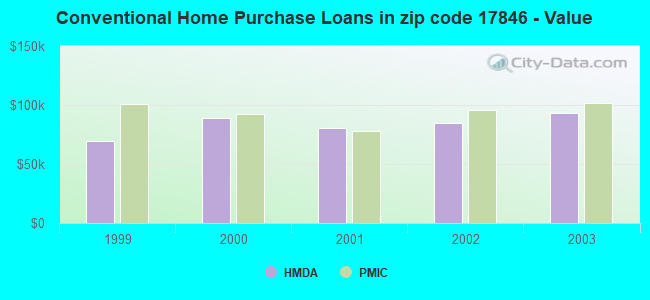
Home Mortgage Disclosure Act Aggregated Statistics For Year 2003 (Based on 2 partial tracts)
A) FHA, FSA/RHS & VA Home Purchase Loans
B) Conventional Home Purchase Loans
C) Refinancings
D) Home Improvement Loans
F) Non-occupant Loans on < 5 Family Dwellings (A B C & D)
Number
Average Value
Number
Average Value
Number
Average Value
Number
Average Value
Number
Average Value
LOANS ORIGINATED
3
$82,957
51
$93,441
135
$82,416
38
$34,921
12
$54,742
APPLICATIONS APPROVED, NOT ACCEPTED
1
$47,490
3
$88,233
17
$68,593
6
$26,088
0
$0
APPLICATIONS DENIED
0
$0
3
$43,677
62
$88,607
16
$36,440
3
$81,783
APPLICATIONS WITHDRAWN
0
$0
1
$87,940
46
$93,560
3
$32,243
2
$48,365
FILES CLOSED FOR INCOMPLETENESS
0
$0
0
$0
4
$103,330
1
$39,570
0
$0
Aggregated Statistics For Year 2002 (Based on 2 partial tracts)
A) FHA, FSA/RHS & VA Home Purchase Loans
B) Conventional Home Purchase Loans
C) Refinancings
D) Home Improvement Loans
F) Non-occupant Loans on < 5 Family Dwellings (A B C & D)
Number
Average Value
Number
Average Value
Number
Average Value
Number
Average Value
Number
Average Value
LOANS ORIGINATED
4
$89,918
36
$84,667
96
$81,051
20
$28,360
6
$75,482
APPLICATIONS APPROVED, NOT ACCEPTED
0
$0
2
$35,175
12
$76,654
0
$0
0
$0
APPLICATIONS DENIED
0
$0
4
$57,600
40
$75,364
5
$9,322
2
$19,785
APPLICATIONS WITHDRAWN
0
$0
1
$50,130
31
$95,344
1
$21,980
0
$0
FILES CLOSED FOR INCOMPLETENESS
0
$0
1
$50,130
4
$61,338
0
$0
0
$0
Aggregated Statistics For Year 2001 (Based on 2 partial tracts)
A) FHA, FSA/RHS & VA Home Purchase Loans
B) Conventional Home Purchase Loans
C) Refinancings
D) Home Improvement Loans
E) Loans on Dwellings For 5+ Families
F) Non-occupant Loans on < 5 Family Dwellings (A B C & D)
Number
Average Value
Number
Average Value
Number
Average Value
Number
Average Value
Number
Average Value
Number
Average Value
LOANS ORIGINATED
1
$111,680
33
$80,505
91
$67,269
21
$34,883
1
$452,890
2
$29,020
APPLICATIONS APPROVED, NOT ACCEPTED
0
$0
4
$68,812
13
$66,022
4
$41,332
0
$0
0
$0
APPLICATIONS DENIED
0
$0
15
$72,228
24
$63,207
4
$12,092
0
$0
1
$59,800
APPLICATIONS WITHDRAWN
0
$0
3
$100,250
21
$76,005
1
$21,980
0
$0
0
$0
FILES CLOSED FOR INCOMPLETENESS
0
$0
0
$0
4
$98,492
0
$0
0
$0
0
$0
Aggregated Statistics For Year 2000 (Based on 2 partial tracts)
A) FHA, FSA/RHS & VA Home Purchase Loans
B) Conventional Home Purchase Loans
C) Refinancings
D) Home Improvement Loans
F) Non-occupant Loans on < 5 Family Dwellings (A B C & D)
Number
Average Value
Number
Average Value
Number
Average Value
Number
Average Value
Number
Average Value
LOANS ORIGINATED
2
$68,155
31
$88,905
33
$54,576
33
$22,412
4
$36,275
APPLICATIONS APPROVED, NOT ACCEPTED
0
$0
3
$82,370
8
$65,955
2
$24,625
0
$0
APPLICATIONS DENIED
0
$0
5
$83,368
26
$71,874
10
$9,673
1
$43,970
APPLICATIONS WITHDRAWN
0
$0
2
$32,975
20
$67,626
3
$10,260
0
$0
FILES CLOSED FOR INCOMPLETENESS
0
$0
1
$57,160
4
$50,345
0
$0
0
$0
Aggregated Statistics For Year 1999 (Based on 1 partial tract)
A) FHA, FSA/RHS & VA Home Purchase Loans
B) Conventional Home Purchase Loans
C) Refinancings
D) Home Improvement Loans
F) Non-occupant Loans on < 5 Family Dwellings (A B C & D)


 Nearest zip codes: 17859, 17742, 17774, 17815, 17884, 17822.