Estimated zip code population in 2022: 2,048 Zip code population in 2010: 2,245 Zip code population in 2000: 2,155
Houses and condos: 986 Renter-occupied apartments: 142
% of renters here:
20%
State:
31%
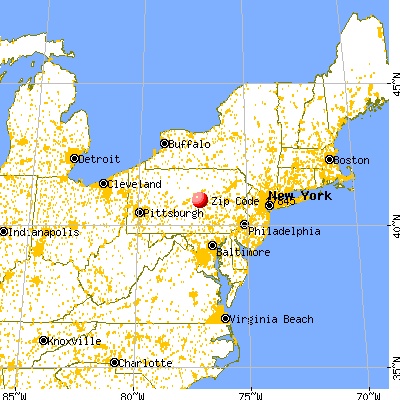
March 2022 cost of living index in zip code 17845: 92.8 (less than average, U.S. average is 100)
Land area: 65.5 sq. mi. Water area: 0.5 sq. mi.
Population density: 31 people per square mile
(very low).
OSM Map
General Map
Google Map
MSN Map
OSM Map
General Map
Google Map
MSN Map
OSM Map
General Map
Google Map
MSN Map
OSM Map
General Map
Google Map
MSN Map
Please wait while loading the map...
Real estate property taxes paid for housing units in 2022:
This zip code:
0.9% ($1,871)
Pennsylvania:
1.3% ($3,094)
Median real estate property taxes paid for housing units with mortgages in 2022: $2,137 (0.9%) Median real estate property taxes paid for housing units with no mortgage in 2022: $1,672 (0.9%)
Business Search- 14 Million verified businesses
Males: 996
(48.6%)
Females: 1,051
(51.4%)
For population 25 years and over in 17845:
High school or higher: 80.3%
Bachelor's degree or higher: 10.7%
Graduate or professional degree: 3.1%
Unemployed: 4.0%
Mean travel time to work (commute): 23.0 minutes
For population 15 years and over in 17845:
Never married: 26.3%
Now married: 55.6%
Separated: 1.7%
Widowed: 9.2%
Divorced: 7.2%
Zip code 17845 compared to state average:
Black race population percentage significantly below state average.
Hispanic race population percentage significantly below state average.
Foreign-born population percentage significantly below state average.
Renting percentage below state average.
Length of stay since moving in significantly above state average.
Number of college students below state average.
Percentage of population with a bachelor's degree or higher significantly below state average.
Estimated median house/condo value in 2022: $214,460
17845:
$214,460
Pennsylvania:
$245,500
According to our research of Pennsylvania and other state lists, there were 3 registered sex offenders living in 17845 zip code as of July 03, 2024. The ratio of all residents to sex offenders in zip code 17845 is 688 to 1. The ratio of registered sex offenders to all residents in this zip code is near the state average.
Median resident age:
This zip code:
39.5 years
Pennsylvania median age:
40.9 years
Average household size:
This zip code:
2.8 people
Pennsylvania:
2.4 people
Averages for the 2020 tax year for zip code 17845, filed in 2021:
Average Adjusted Gross Income (AGI) in 2020: $49,814 (Individual Income Tax Returns)
Here:
$49,814
State:
$75,707
Salary/wage: $41,728 (reported on 72.7% of returns)
Here:
$41,728
State:
$62,806
(% of AGI for various income ranges: 1133.5% for AGIs below $25k, 3340.4% for AGIs $25k-50k, 6228.6% for AGIs $50k-75k, 7740.0% for AGIs $75k-100k, 13643.3% for AGIs $100k-200k)
Taxable interest for individuals: $919 (reported on 32.7% of returns)
This zip code:
$919
Pennsylvania:
$1,633
(% of AGI for various income ranges: 53.0% for AGIs below $25k, 40.4% for AGIs $25k-50k, 20.0% for AGIs $50k-75k, 13.8% for AGIs $75k-100k, 148.3% for AGIs $100k-200k)
Ordinary dividends: $1,853 (reported on 13.6% of returns)
Here:
$1,853
State:
$7,382
(% of AGI for various income ranges: 11.0% for AGIs below $25k, 17.1% for AGIs $25k-50k, 71.4% for AGIs $50k-75k, 191.7% for AGIs $100k-200k)
Net capital gain/loss in AGI: +$8,550 (reported on 12.7% of returns)
Here:
+$8,550
State:
+$23,522
(% of AGI for various income ranges: 8.0% for AGIs below $25k, 69.2% for AGIs $25k-50k, 245.7% for AGIs $50k-75k, 1118.3% for AGIs $100k-200k)
Profit/loss from business: +$16,400 (reported on 20.0% of returns)
Here:
+$16,400
State:
+$16,274
(% of AGI for various income ranges: 304.0% for AGIs below $25k, 239.2% for AGIs $25k-50k, 425.0% for AGIs $50k-75k, 327.5% for AGIs $75k-100k, 2615.0% for AGIs $100k-200k)
Taxable individual retirement arrangement distribution: $12,045 (reported on 10.0% of returns)
17845:
$12,045
Pennsylvania:
$18,583
(% of AGI for various income ranges: 102.5% for AGIs below $25k, 66.7% for AGIs $25k-50k, 231.4% for AGIs $50k-75k, 795.0% for AGIs $75k-100k)
Total itemized deductions: $37,450 (reported on 1.8% of returns)
Here:
$37,450
State:
$34,850
(% of AGI for various income ranges: 312.1% for AGIs $25k-50k)
Taxes paid: $7,300 (reported on 1.8% of returns)
17845:
$7,300
State:
$8,200
(% of AGI for various income ranges: 60.8% for AGIs $25k-50k)
Earned income credit: $2,053 (reported on 13.6% of returns)
Here:
$2,053
State:
$2,100
(% of AGI for various income ranges: 87.5% for AGIs below $25k, 55.4% for AGIs $25k-50k)
Percentage of individuals using paid preparers for their 2020 taxes: 92.7%
Here:
93%
State:
92%
(% for various income ranges: 91.4% for AGIs below $25k, 93.9% for AGIs $25k-50k, 95.0% for AGIs $50k-75k, 90.0% for AGIs $75k-100k, 91.7% for AGIs $100k-200k)
Averages for the 2012 tax year for zip code 17845, filed in 2013:
Average Adjusted Gross Income (AGI) in 2012: $38,117 (Individual Income Tax Returns)
Here:
$38,117
State:
$61,346
Salary/wage: $32,817 (reported on 78.0% of returns)
Here:
$32,817
State:
$51,902
(% of AGI for various income ranges: 67.8% for AGIs below $25k, 68.6% for AGIs $25k-50k, 72.2% for AGIs $50k-75k, 68.5% for AGIs $75k-100k, 51.2% for AGIs $100k-200k)
Taxable interest for individuals: $922 (reported on 32.0% of returns)
This zip code:
$922
Pennsylvania:
$1,588
(% of AGI for various income ranges: 0.8% for AGIs below $25k, 0.8% for AGIs $25k-50k, 0.2% for AGIs $50k-75k, 0.2% for AGIs $75k-100k, 2.6% for AGIs $100k-200k)
Ordinary dividends: $1,773 (reported on 11.0% of returns)
Here:
$1,773
State:
$5,827
(% of AGI for various income ranges: 1.1% for AGIs below $25k, 0.1% for AGIs $25k-50k, 0.2% for AGIs $50k-75k, 1.6% for AGIs $75k-100k)
Net capital gain/loss in AGI: +$5,650 (reported on 12.0% of returns)
Here:
+$5,650
State:
+$14,495
(% of AGI for various income ranges: 0.6% for AGIs $25k-50k, 1.2% for AGIs $50k-75k, 7.9% for AGIs $75k-100k)
Profit/loss from business: +$11,386 (reported on 21.0% of returns)
Here:
+$11,386
State:
+$16,268
(% of AGI for various income ranges: 9.3% for AGIs below $25k, 8.1% for AGIs $25k-50k, 5.6% for AGIs $50k-75k, 7.0% for AGIs $75k-100k)
Taxable individual retirement arrangement distribution: $11,912 (reported on 8.0% of returns)
17845:
$11,912
Pennsylvania:
$14,550
(% of AGI for various income ranges: 2.2% for AGIs below $25k, 3.4% for AGIs $25k-50k, 7.8% for AGIs $75k-100k)
Total itemized deductions: $17,150 (25% of AGI, reported on 14.0% of returns)
Here:
$17,150
State:
$23,538
Here:
24.8% of AGI
State:
18.4% of AGI
(% of AGI for various income ranges: 5.9% for AGIs $25k-50k, 5.8% for AGIs $50k-75k, 8.9% for AGIs $75k-100k, 11.4% for AGIs $100k-200k)
Charity contributions: $4,850 (reported on 10.0% of returns)
Here:
$4,850
State:
$4,025
(% of AGI for various income ranges: 1.1% for AGIs $25k-50k, 0.9% for AGIs $50k-75k, 4.3% for AGIs $75k-100k)
Taxes paid: $5,693 (reported on 14.0% of returns)
17845:
$5,693
State:
$9,982
(% of AGI for various income ranges: 1.4% for AGIs $25k-50k, 2.0% for AGIs $50k-75k, 3.6% for AGIs $75k-100k, 4.0% for AGIs $100k-200k)
Earned income credit: $2,111 (reported on 18.0% of returns)
Here:
$2,111
State:
$2,106
(% of AGI for various income ranges: 4.8% for AGIs below $25k, 1.2% for AGIs $25k-50k)
Percentage of individuals using paid preparers for their 2012 taxes: 58.0%
Here:
58%
State:
53%
(% for various income ranges: 51.2% for AGIs below $25k, 63.3% for AGIs $25k-50k, 61.1% for AGIs $50k-75k, 57.1% for AGIs $75k-100k, 75.0% for AGIs $100k-200k)
Averages for the 2004 tax year for zip code 17845, filed in 2005:
Average Adjusted Gross Income (AGI) in 2004: $32,175 (Individual Income Tax Returns)
Here:
$32,175
State:
$48,049
Salary/wage: $29,763 (reported on 74.7% of returns)
Here:
$29,763
State:
$42,646
(% of AGI for various income ranges: 86.2% for AGIs below $10k, 57.1% for AGIs $10k-25k, 77.5% for AGIs $25k-50k, 76.5% for AGIs $50k-75k, 64.9% for AGIs $75k-100k, 30.3% for AGIs over 100k)
Taxable interest for individuals: $1,053 (reported on 44.4% of returns)
This zip code:
$1,053
Pennsylvania:
$1,657
(% of AGI for various income ranges: 9.2% for AGIs below $10k, 2.0% for AGIs $10k-25k, 1.2% for AGIs $25k-50k, 1.0% for AGIs $50k-75k, 0.6% for AGIs $75k-100k, 2.1% for AGIs over 100k)
Taxable dividends: $1,100 (reported on 14.5% of returns)
Here:
$1,100
State:
$3,566
(% of AGI for various income ranges: 2.4% for AGIs below $10k, 0.5% for AGIs $10k-25k, 0.5% for AGIs $25k-50k, 0.5% for AGIs $50k-75k, 0.6% for AGIs $75k-100k)
Net capital gain/loss: +$4,389 (reported on 12.6% of returns)
Here:
+$4,389
State:
+$9,716
(% of AGI for various income ranges: 2.4% for AGIs below $10k, 0.1% for AGIs $10k-25k, 0.8% for AGIs $25k-50k, 3.1% for AGIs $50k-75k, 4.4% for AGIs over 100k)
Profit/loss from business: +$9,253 (reported on 19.8% of returns)
Here:
+$9,253
State:
+$14,267
(% of AGI for various income ranges: 20.9% for AGIs below $10k, 15.1% for AGIs $10k-25k, 4.6% for AGIs $25k-50k, 3.4% for AGIs $50k-75k, 6.2% for AGIs $75k-100k)
Profit/loss from farming: +$11,869 (reported on 6.8% of returns)
Here:
+$11,869
State:
+$274
(% of AGI for various income ranges: 5.9% for AGIs below $10k, 3.0% for AGIs $10k-25k, 2.5% for AGIs $25k-50k, 3.6% for AGIs $50k-75k)
IRA payment deduction: $2,950 (reported on 2.2% of returns)
17845:
$2,950
Pennsylvania:
$2,903
Total itemized deductions: $14,544 (25% of AGI, reported on 16.6% of returns)
Here:
$14,544
State:
$18,804
Here:
25.3% of AGI
State:
19.5% of AGI
(% of AGI for various income ranges: 5.6% for AGIs $10k-25k, 6.2% for AGIs $25k-50k, 7.7% for AGIs $50k-75k, 8.9% for AGIs $75k-100k, 15.1% for AGIs over 100k)
Charity contributions deductions: $2,942 (5% of AGI, reported on 13.4% of returns)
Here:
$2,942
State:
$3,337
Here:
5.2% of AGI
State:
3.3% of AGI
(% of AGI for various income ranges: 1.2% for AGIs $10k-25k, 1.0% for AGIs $25k-50k, 1.0% for AGIs $50k-75k, 4.8% for AGIs $75k-100k)
Total tax: $3,377 (reported on 73.5% of returns)
17845:
$3,377
State:
$8,008
(% of AGI for various income ranges: 4.8% for AGIs below $10k, 5.2% for AGIs $10k-25k, 6.0% for AGIs $25k-50k, 7.4% for AGIs $50k-75k, 10.1% for AGIs $75k-100k, 17.3% for AGIs over 100k)
Earned income credit: $1,504 (reported on 15.5% of returns)
Here:
$1,504
State:
$1,643
Percentage of individuals using paid preparers for their 2004 taxes: 61.2%
Here:
61%
State:
56%
(% for various income ranges: 62.7% for AGIs below $10k, 61.7% for AGIs $10k-25k, 56.1% for AGIs $25k-50k, 64.4% for AGIs $50k-75k, 72.4% for AGIs $75k-100k, 78.9% for AGIs over 100k)
Household received Food Stamps/SNAP in the past 12 months: 55 Household did not receive Food Stamps/SNAP in the past 12 months: 640
Women who had a birth in the past 12 months: 28 (27 now married, 2 unmarried) Women who did not have a birth in the past 12 months: 387 (199 now married, 186 unmarried)
Housing units in zip code 17845 with a mortgage: 262 (24 second mortgage, 22 both second mortgage and home equity loan) Houses without a mortgage: 39
Median monthly owner costs for units with a mortgage: $1,382 Median monthly owner costs for units without a mortgage: $471
Residents with income below the poverty level in 2022:
This zip code:
16.4%
Whole state:
11.8%
Residents with income below 50% of the poverty level in 2022:
This zip code:
13.7%
Whole state:
6.1%
Median number of rooms in houses and condos:
Here:
6.8
State:
6.8
Median number of rooms in apartments:
Here:
6.1
State:
4.3
Notable locations in this zip code not listed on our city pages
Notable locations in zip code 17845: Laurelton State Village Farms (A), Camp Loka (B), Karoondinha Camp (C), Laurelton State Village (D), Nik-O-Mahs Camp (E), Pennsylvania Department of Conservation and Natural Resources District 7 Bold Eagle Division (F), Union County West End Fire Company (G). Display/hide their locations on the map
Streams, rivers, and creeks: Henstep Run (A), Stony Run (B), Furnace Run (C), Spruce Run (D), Little Weikert Run (E), Coral Run (F), Cold Run (G), Sheesley Run (H), Lick Run (I). Display/hide their locations on the map
In group quarters: 63 (-1 institutionalized population)
Size of family households: 225 2-persons, 104 3-persons, 55 4-persons, 84 5-persons, 8 6-persons, 37 7-or-more-persons
Size of nonfamily households: 145 1-person, 35 2-persons
475 married couples with children.
81 single-parent households (43 men, 38 women).
91.3% of residents of 17845 zip code speak English at home.
0.1% of residents speak Spanish at home (100% very well).
7.6% of residents speak other Indo-European language at home (72% very well, 25% well, 3% not well).
0.6% of residents speak Asian or Pacific Island language at home (91% very well, 9% well).
Foreign born population: 18 (0.9%) (83.9% of them are naturalized citizens)
This zip code:
0.9%
Whole state:
7.5%
44%Taiwan
33%France
6%Sweden
52%German
12%American
11%English
7%Swiss
1%Irish
1%French
1%European
Year of entry for the foreign-born population
02010 or later
22000 to 2009
01990 to 1999
17Before 1990
Housing units lacking complete plumbing facilities: 9.9% Housing units lacking complete kitchen facilities: 9.2%
35.0%Fuel oil, kerosene, etc.
19.2%Wood
19.1%Electricity
13.4%Bottled, tank, or LP gas
6.6%Coal or coke
3.1%No fuel used
2.2%Other fuel
1.9%Utility gas
Population in 1990: 2,111. Population change in the 1990s: +44 (+2.1%).
Place of birth for U.S.-born residents:
This state: 1,793
Northeast: 99
Midwest: 27
South: 65
West: 25
64% of the 17845 zip code residents lived in the same house 5 years ago. Out of people who lived in different houses, 52% lived in this county. Out of people who lived in different counties, 50% lived in Pennsylvania.
95% of the 17845 zip code residents lived in the same house 1 year ago. Out of people who lived in different houses, 75% moved from this county. Out of people who lived in different houses, 26% moved from different county within same state.
Private vs. public school enrollment:
Students in private schools in grades 1 to 8 (elementary and middle school): 111
Here:
35.9%
Pennsylvania:
15.7%
Students in private schools in grades 9 to 12 (high school): 12
Here:
10.1%
Pennsylvania:
13.4%
Students in private undergraduate colleges: 7
Here:
25.1%
Pennsylvania:
39.8%
Occupation by median earnings in the past 12 months ($)
83,292Transportation occupations
65,756Health diagnosing and treating practitioners and other technical occupations
61,956Law enforcement workers including supervisors
51,488Management occupations
45,608Architecture and engineering occupations
45,213Business and financial operations occupations
Top industries in this zip code by the number of employees in 2005:
Health Care and Social Assistance: Nursing Care Facilities (20-49: 1)
Other Services (except Public Administration): Civic and Social Organizations (20-49: 1)
Construction: Site Preparation Contractors (5-9: 1)
Other Services (except Public Administration): Commercial and Industrial Machinery and Equipment (except Automotive and Electronic) Repair and Maintenance (5-9: 1)
Educational Services: Elementary and Secondary Schools (5-9: 1)
Construction: New Single-Family Housing Construction (except Operative Builders) (1-4: 3)
Construction: Plumbing, Heating, and Air-Conditioning Contractors (1-4: 2)
Health Care and Social Assistance: Child Day Care Services (1-4: 1)
People in group quarters in 2010:
54 people in nursing facilities/skilled-nursing facilities
People in group quarters in 2000:
50 people in nursing homes
Fatal accident statistics in 2014:
Fatal accident count: 3
Vehicles involved in fatal accidents: 3
Fatal accidents caused by drunken drivers: 0
Fatalities: 3
Persons involved in fatal accidents: 3
Pedestrians involved in fatal accidents: 1
Fatal accident statistics in 2012:
Fatal accident count: 1
Vehicles involved in fatal accidents: 1
Fatal accidents caused by drunken drivers: 1
Fatalities: 1
Persons involved in fatal accidents: 3
Pedestrians involved in fatal accidents: 0
Most common first names in zip code 17845 among deceased individuals
Name
Count
Lived (average)
Mary
21
79.5 years
Robert
20
72.7 years
John
18
76.5 years
Florence
15
83.0 years
Charles
15
74.3 years
William
15
77.0 years
Helen
13
79.4 years
George
13
74.9 years
Elizabeth
10
81.2 years
Harold
9
71.2 years
Most common last names in zip code 17845 among deceased individuals
Last name
Count
Lived (average)
Boop
20
75.7 years
Bingaman
15
75.7 years
Zimmerman
13
78.7 years
Keister
12
69.2 years
Catherman
8
76.2 years
Snyder
7
75.4 years
Smith
7
79.0 years
Miller
6
71.5 years
Shively
6
80.8 years
Ruhl
6
82.8 years
Discuss Hartleton, Pennsylvania (PA) on our hugely popular Pennsylvania forum.


 Nearest zip codes: 17835, 17829, 17880, 17885, 17813, 16882.


