Estimated zip code population in 2022: 1,706 Zip code population in 2010: 1,634 Zip code population in 2000: 1,935
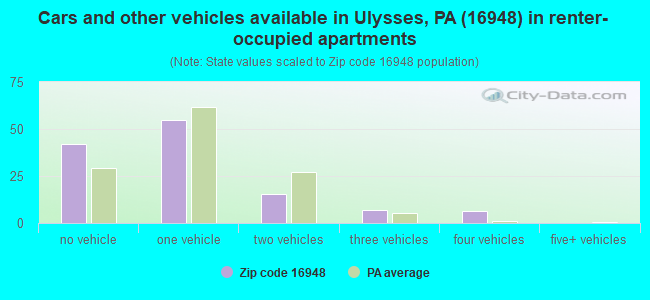
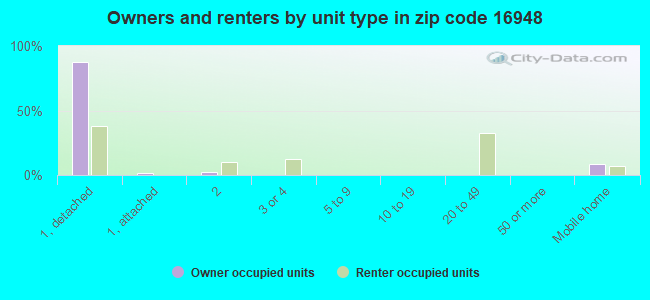
Houses and condos: 1,174 Renter-occupied apartments: 125
% of renters here:
20%
State:
31%
March 2022 cost of living index in zip code 16948: 91.4 (less than average, U.S. average is 100)
Land area: 92.4 sq. mi. Water area: 0.0 sq. mi.
Population density: 18 people per square mile
(very low).
OSM Map
General Map
Google Map
MSN Map
OSM Map
General Map
Google Map
MSN Map
OSM Map
General Map
Google Map
MSN Map
OSM Map
General Map
Google Map
MSN Map
Please wait while loading the map...
Real estate property taxes paid for housing units in 2022:
This zip code:
1.1% ($1,739)
Pennsylvania:
1.3% ($3,094)
Median real estate property taxes paid for housing units with mortgages in 2022: $1,872 (1.1%) Median real estate property taxes paid for housing units with no mortgage in 2022: $1,658 (1.1%)
Business Search- 14 Million verified businesses
Males: 877
(51.4%)
Females: 829
(48.6%)
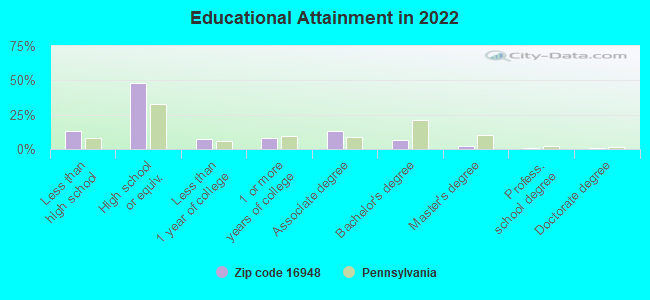
For population 25 years and over in 16948:
High school or higher: 85.1%
Bachelor's degree or higher: 10.1%
Graduate or professional degree: 3.7%
Unemployed: 5.9%
Mean travel time to work (commute): 25.3 minutes
For population 15 years and over in 16948:
Never married: 25.1%
Now married: 56.7%
Separated: 0.2%
Widowed: 8.4%
Divorced: 9.5%
Zip code 16948 compared to state average:
Median household income below state average.
Median house value below state average.
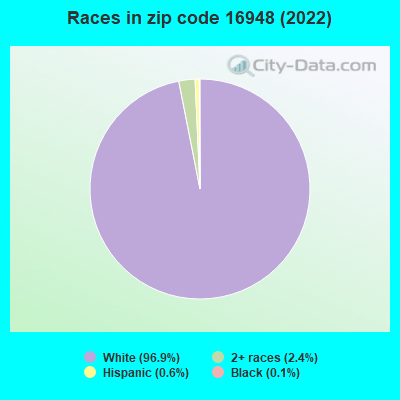
Black race population percentage significantly below state average.
Hispanic race population percentage significantly below state average.
Foreign-born population percentage significantly below state average.
Renting percentage below state average.
Length of stay since moving in significantly above state average.
Number of college students below state average.
Percentage of population with a bachelor's degree or higher significantly below state average.
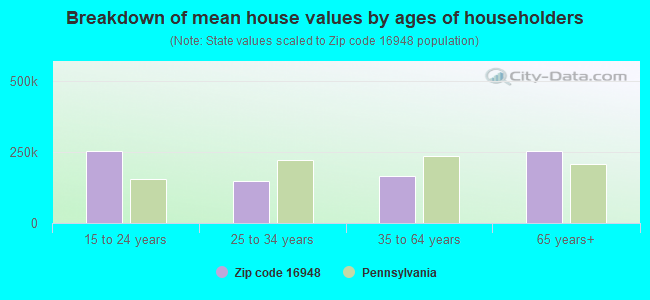
Estimated median house/condo value in 2022: $162,798
16948:
$162,798
Pennsylvania:
$245,500
According to our research of Pennsylvania and other state lists, there was 1 registered sex offender living in 16948 zip code as of July 04, 2024. The ratio of all residents to sex offenders in zip code 16948 is 1,695 to 1. The ratio of registered sex offenders to all residents in this zip code is much lower than the state average.
Median resident age:
This zip code:
38.1 years
Pennsylvania median age:
40.9 years
Average household size:
This zip code:
2.7 people
Pennsylvania:
2.4 people
Averages for the 2020 tax year for zip code 16948, filed in 2021:
Average Adjusted Gross Income (AGI) in 2020: $49,788 (Individual Income Tax Returns)
Here:
$49,788
State:
$75,707
Salary/wage: $43,569 (reported on 69.6% of returns)
Here:
$43,569
State:
$62,806
(% of AGI for various income ranges: 1046.9% for AGIs below $25k, 3398.3% for AGIs $25k-50k, 5947.5% for AGIs $50k-75k, 8760.0% for AGIs $75k-100k, 13796.0% for AGIs $100k-200k)
Taxable interest for individuals: $855 (reported on 29.0% of returns)
This zip code:
$855
Pennsylvania:
$1,633
(% of AGI for various income ranges: 13.1% for AGIs below $25k, 5.8% for AGIs $25k-50k, 5.0% for AGIs $50k-75k, 32.5% for AGIs $75k-100k, 252.0% for AGIs $100k-200k)
Ordinary dividends: $3,117 (reported on 17.4% of returns)
Here:
$3,117
State:
$7,382
(% of AGI for various income ranges: 29.4% for AGIs below $25k, 53.3% for AGIs $25k-50k, 48.8% for AGIs $50k-75k, 448.0% for AGIs $100k-200k)
Net capital gain/loss in AGI: +$20,467 (reported on 13.0% of returns)
Here:
+$20,467
State:
+$23,522
(% of AGI for various income ranges: 11.9% for AGIs below $25k, 188.3% for AGIs $25k-50k, 3194.0% for AGIs $100k-200k)
Profit/loss from business: +$17,085 (reported on 18.8% of returns)
Here:
+$17,085
State:
+$16,274
(% of AGI for various income ranges: 278.1% for AGIs below $25k, 457.5% for AGIs $25k-50k, 1185.0% for AGIs $50k-75k, 697.5% for AGIs $75k-100k)
Taxable individual retirement arrangement distribution: $12,071 (reported on 10.1% of returns)
16948:
$12,071
Pennsylvania:
$18,583
(% of AGI for various income ranges: 51.9% for AGIs below $25k, 200.0% for AGIs $25k-50k, 1305.0% for AGIs $75k-100k)
Earned income credit: $2,592 (reported on 17.4% of returns)
Here:
$2,592
State:
$2,100
(% of AGI for various income ranges: 126.2% for AGIs below $25k, 90.8% for AGIs $25k-50k)
Percentage of individuals using paid preparers for their 2020 taxes: 88.4%
Here:
88%
State:
92%
(% for various income ranges: 80.8% for AGIs below $25k, 88.2% for AGIs $25k-50k, 90.9% for AGIs $50k-75k, 100.0% for AGIs $75k-100k, 100.0% for AGIs $100k-200k)
Averages for the 2012 tax year for zip code 16948, filed in 2013:
Average Adjusted Gross Income (AGI) in 2012: $42,578 (Individual Income Tax Returns)
Here:
$42,578
State:
$61,346
Salary/wage: $34,846 (reported on 75.4% of returns)
Here:
$34,846
State:
$51,902
(% of AGI for various income ranges: 62.1% for AGIs below $25k, 65.8% for AGIs $25k-50k, 66.7% for AGIs $50k-75k, 72.1% for AGIs $75k-100k, 49.2% for AGIs $100k-200k)
Taxable interest for individuals: $696 (reported on 34.8% of returns)
This zip code:
$696
Pennsylvania:
$1,588
(% of AGI for various income ranges: 1.9% for AGIs below $25k, 0.5% for AGIs $25k-50k, 0.3% for AGIs $50k-75k, 0.7% for AGIs $75k-100k, 0.1% for AGIs $100k-200k)
Ordinary dividends: $1,692 (reported on 18.8% of returns)
Here:
$1,692
State:
$5,827
(% of AGI for various income ranges: 2.2% for AGIs below $25k, 1.4% for AGIs $25k-50k, 1.0% for AGIs $75k-100k)
Net capital gain/loss in AGI: +$7,800 (reported on 14.5% of returns)
Here:
+$7,800
State:
+$14,495
(% of AGI for various income ranges: 2.0% for AGIs $25k-50k, 11.7% for AGIs $75k-100k)
Profit/loss from business: +$13,064 (reported on 20.3% of returns)
Here:
+$13,064
State:
+$16,268
(% of AGI for various income ranges: 11.1% for AGIs below $25k, 9.4% for AGIs $25k-50k, 16.7% for AGIs $50k-75k)
Taxable individual retirement arrangement distribution: $10,525 (reported on 11.6% of returns)
16948:
$10,525
Pennsylvania:
$14,550
Total itemized deductions: $21,530 (21% of AGI, reported on 14.5% of returns)
Here:
$21,530
State:
$23,538
Here:
20.6% of AGI
State:
18.4% of AGI
(% of AGI for various income ranges: 12.2% for AGIs below $25k, 13.8% for AGIs $50k-75k, 10.9% for AGIs $100k-200k)
Charity contributions: $4,867 (reported on 8.7% of returns)
Here:
$4,867
State:
$4,025
Taxes paid: $7,720 (reported on 14.5% of returns)
16948:
$7,720
State:
$9,982
(% of AGI for various income ranges: 3.1% for AGIs below $25k, 4.5% for AGIs $50k-75k, 4.7% for AGIs $100k-200k)
Earned income credit: $2,136 (reported on 20.3% of returns)
Here:
$2,136
State:
$2,106
(% of AGI for various income ranges: 6.0% for AGIs below $25k, 1.3% for AGIs $25k-50k)
Percentage of individuals using paid preparers for their 2012 taxes: 65.2%
Here:
65%
State:
53%
(% for various income ranges: 60.6% for AGIs below $25k, 62.5% for AGIs $25k-50k, 75.0% for AGIs $50k-75k, 71.4% for AGIs $75k-100k, 80.0% for AGIs $100k-200k)
Averages for the 2004 tax year for zip code 16948, filed in 2005:
Average Adjusted Gross Income (AGI) in 2004: $30,584 (Individual Income Tax Returns)
Here:
$30,584
State:
$48,049
Salary/wage: $26,780 (reported on 77.9% of returns)
Here:
$26,780
State:
$42,646
(% of AGI for various income ranges: 68.9% for AGIs below $10k, 65.5% for AGIs $10k-25k, 75.8% for AGIs $25k-50k, 77.8% for AGIs $50k-75k, 76.5% for AGIs $75k-100k)
Taxable interest for individuals: $1,165 (reported on 46.8% of returns)
This zip code:
$1,165
Pennsylvania:
$1,657
(% of AGI for various income ranges: 7.7% for AGIs below $10k, 3.3% for AGIs $10k-25k, 2.1% for AGIs $25k-50k, 0.3% for AGIs $50k-75k, 1.3% for AGIs $75k-100k, 0.5% for AGIs over 100k)
Taxable dividends: $1,327 (reported on 23.2% of returns)
Here:
$1,327
State:
$3,566
(% of AGI for various income ranges: 1.4% for AGIs below $10k, 0.7% for AGIs $10k-25k, 1.5% for AGIs $25k-50k, 0.5% for AGIs $50k-75k, 1.6% for AGIs $75k-100k)
Net capital gain/loss: +$5,106 (reported on 15.9% of returns)
Here:
+$5,106
State:
+$9,716
(% of AGI for various income ranges: 1.3% for AGIs below $10k, 1.3% for AGIs $10k-25k, 4.1% for AGIs $25k-50k, 0.4% for AGIs $50k-75k, 6.9% for AGIs $75k-100k)
Profit/loss from business: +$6,705 (reported on 24.3% of returns)
Here:
+$6,705
State:
+$14,267
(% of AGI for various income ranges: 12.9% for AGIs below $10k, 10.6% for AGIs $10k-25k, 5.7% for AGIs $25k-50k, 5.3% for AGIs $50k-75k, 0.4% for AGIs $75k-100k)
IRA payment deduction: $1,700 (reported on 1.4% of returns)
16948:
$1,700
Pennsylvania:
$2,903
Total itemized deductions: $14,030 (23% of AGI, reported on 14.0% of returns)
Here:
$14,030
State:
$18,804
Here:
23.3% of AGI
State:
19.5% of AGI
(% of AGI for various income ranges: 5.9% for AGIs $10k-25k, 5.1% for AGIs $25k-50k, 7.0% for AGIs $50k-75k, 13.8% for AGIs $75k-100k)
Charity contributions deductions: $3,580 (6% of AGI, reported on 9.7% of returns)
Here:
$3,580
State:
$3,337
Here:
5.9% of AGI
State:
3.3% of AGI
(% of AGI for various income ranges: 1.2% for AGIs $10k-25k, 0.9% for AGIs $25k-50k, 1.5% for AGIs $50k-75k, 1.7% for AGIs $75k-100k)
Total tax: $3,678 (reported on 68.0% of returns)
16948:
$3,678
State:
$8,008
(% of AGI for various income ranges: 2.4% for AGIs below $10k, 4.4% for AGIs $10k-25k, 5.4% for AGIs $25k-50k, 9.2% for AGIs $50k-75k, 10.6% for AGIs $75k-100k, 20.0% for AGIs over 100k)
Earned income credit: $1,636 (reported on 21.2% of returns)
Here:
$1,636
State:
$1,643
Percentage of individuals using paid preparers for their 2004 taxes: 69.9%
Here:
70%
State:
56%
(% for various income ranges: 55.3% for AGIs below $10k, 73.2% for AGIs $10k-25k, 78.6% for AGIs $25k-50k, 72.9% for AGIs $50k-75k, 97.5% for AGIs $75k-100k)
Likely homosexual households (counted as self-reported same-sex unmarried-partner households)
Lesbian couples: 0.3% of all households
Gay men: 0.0% of all households
Household received Food Stamps/SNAP in the past 12 months: 136 Household did not receive Food Stamps/SNAP in the past 12 months: 488
Women who had a birth in the past 12 months: 21 (18 now married, 3 unmarried) Women who did not have a birth in the past 12 months: 313 (150 now married, 162 unmarried)
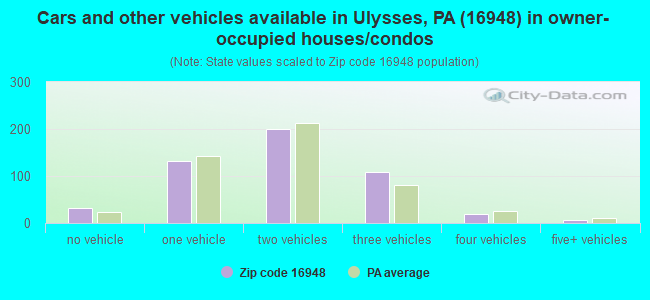
Housing units in zip code 16948 with a mortgage: 262 (19 second mortgage, 19 both second mortgage and home equity loan) Houses without a mortgage: 11
Median monthly owner costs for units with a mortgage: $1,165 Median monthly owner costs for units without a mortgage: $510
Residents with income below the poverty level in 2022:
This zip code:
19.2%
Whole state:
11.8%
Residents with income below 50% of the poverty level in 2022:
This zip code:
11.4%
Whole state:
6.1%
Median number of rooms in houses and condos:
Here:
6.9
State:
6.8
Median number of rooms in apartments:
Here:
4.8
State:
4.3
Notable locations in this zip code not listed on our city pages
Streams, rivers, and creeks: Lehman Run (A), Losey Run (B), Ninemile Run (C), Jones Run (D), Genesee Forks (E), Ludington Run (F), California Creek (G), Cabin Run (H), Buckseller Run (I). Display/hide their locations on the map
Size of family households: 220 2-persons, 89 3-persons, 61 4-persons, 18 5-persons, 18 6-persons, 26 7-or-more-persons
Size of nonfamily households: 170 1-person, 17 2-persons
351 married couples with children.
67 single-parent households (16 men, 51 women).
87.2% of residents of 16948 zip code speak English at home.
12.7% of residents speak other Indo-European language at home (48% very well, 39% well, 14% not well).
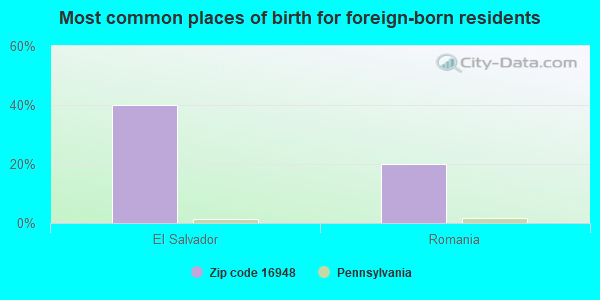
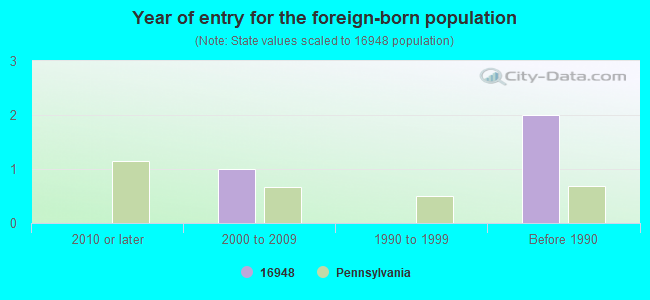
Foreign born population: 5 (0.3%) (100.0% of them are naturalized citizens)
This zip code:
0.3%
Whole state:
7.5%
40%El Salvador
20%Romania
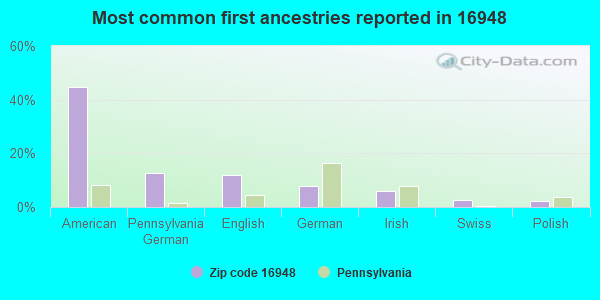
45%American
13%Pennsylvania German
12%English
8%German
6%Irish
3%Swiss
2%Polish
Year of entry for the foreign-born population
02010 or later
12000 to 2009
01990 to 1999
2Before 1990
Housing units lacking complete plumbing facilities: 11.8% Housing units lacking complete kitchen facilities: 9.7%
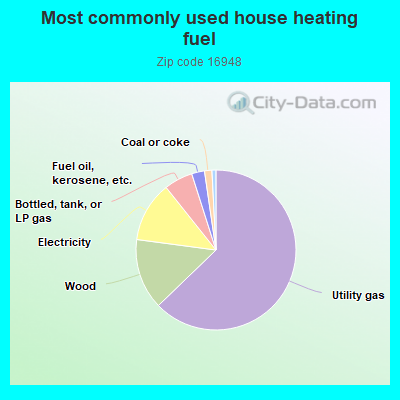
62.8%Utility gas
14.3%Wood
12.2%Electricity
5.8%Bottled, tank, or LP gas
2.6%Fuel oil, kerosene, etc.
1.5%Coal or coke
0.8%No fuel used
Population in 1990: 727. Population change in the 1990s: +1,208 (+166.2%).
Place of birth for U.S.-born residents:
This state: 1,260
Northeast: 259
Midwest: 137
South: 29
West: 11
68% of the 16948 zip code residents lived in the same house 5 years ago. Out of people who lived in different houses, 50% lived in this county. Out of people who lived in different counties, 50% lived in Pennsylvania.
94% of the 16948 zip code residents lived in the same house 1 year ago. Out of people who lived in different houses, 66% moved from this county. Out of people who lived in different houses, 25% moved from different county within same state. Out of people who lived in different houses, 9% moved from different state.
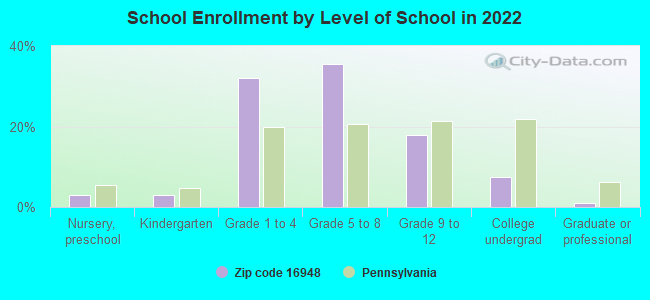
Private vs. public school enrollment:
Students in private schools in grades 1 to 8 (elementary and middle school): 82
Here:
33.1%
Pennsylvania:
15.7%
Students in private schools in grades 9 to 12 (high school): 2
Here:
4.3%
Pennsylvania:
13.4%
Students in private undergraduate colleges: 4
Here:
17.5%
Pennsylvania:
39.8%
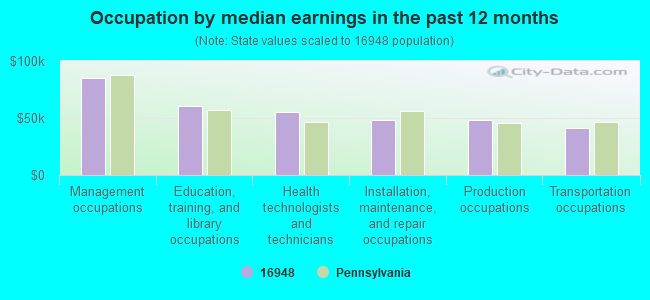
Occupation by median earnings in the past 12 months ($)
85,402Management occupations
60,730Education, training, and library occupations
55,034Health technologists and technicians
48,611Installation, maintenance, and repair occupations
48,015Production occupations
40,838Transportation occupations
Top industries in this zip code by the number of employees in 2005:
Arts, Entertainment, and Recreation: Skiing Facilities (20-49 employees: 1 establishment)
Accommodation and Food Services: Full-Service Restaurants (10-19: 1, 5-9: 1)
Other Services (except Public Administration): General Automotive Repair (10-19: 1, 1-4: 1)
Accommodation and Food Services: Hotels (except Casino Hotels) and Motels (10-19: 1)
Other Services (except Public Administration): Religious Organizations (5-9: 1, 1-4: 2)
Construction: New Single-Family Housing Construction (except Operative Builders) (5-9: 1, 1-4: 1)
Most common first names in zip code 16948 among deceased individuals
Name
Count
Lived (average)
George
15
72.5 years
John
12
70.5 years
James
11
69.9 years
William
11
76.7 years
Ruth
10
76.6 years
Robert
9
72.8 years
Charles
6
70.7 years
Frank
6
77.0 years
Harold
6
75.2 years
Lawrence
6
71.6 years
Most common last names in zip code 16948 among deceased individuals
Last name
Count
Lived (average)
Thompson
8
81.3 years
Hamilton
7
84.7 years
Cowburn
7
78.9 years
Flynn
6
72.0 years
Tubbs
6
75.7 years
Stevens
6
57.4 years
Clark
6
72.2 years
Lampman
5
75.6 years
Lehman
5
78.2 years
Henry
5
80.0 years
Discuss Ulysses, Pennsylvania (PA) on our hugely popular Pennsylvania forum.


 Nearest zip codes: 16937, 16941, 16927, 16923, 16943, 14897.