Estimated zip code population in 2022: 82
Zip code population in 2010: 152
Zip code population in 2000: 129
Houses and condos: 39
Renter-occupied apartments: 7
| % of renters here: | 25% |
| State: | 31% |
91.5
(less than average, U.S. average is 100)
Land area: 1.6
sq. mi.
Water area: 0.0
sq. mi.
| Population density: 52 people per square mile | | (very low). |
![Age and Sex of Residents in zip code 15760]()
- OSM Map
- General Map
- Google Map
- MSN Map
- OSM Map
- General Map
- Google Map
- MSN Map
- OSM Map
- General Map
- Google Map
- MSN Map
- OSM Map
- General Map
- Google Map
- MSN Map
Please wait while loading the map...
Median real estate property taxes paid for housing units with no mortgage in 2022: $249
Business Search - 14 Million verified businesses
| Males: 49 |  (60.2%) (60.2%) |
| Females: 32 |  (39.8%) (39.8%) |
For population 25 years and over in 15760:
- High school or higher: 92.9%
- Bachelor's degree or higher: 13.5%
- Graduate or professional degree: 4.6%
- Unemployed: 10.4%
- Mean travel time to work (commute): 31.6 minutes
For population 15 years and over in 15760:
- Never married: 44.1%
- Now married: 39.9%
- Separated: 0.0%
- Widowed: 4.4%
- Divorced: 11.6%
Zip code 15760 compared to state average:
- Median house value significantly below state average.
- Unemployed percentage above state average.
- Black race population percentage significantly below state average.
- Hispanic race population percentage significantly below state average.
- Median age significantly below state average.
- Foreign-born population percentage significantly below state average.
- Length of stay since moving in significantly above state average.
- House age above state average.
- Percentage of population with a bachelor's degree or higher significantly below state average.

- 6377.8%White
- 1822.2%Two or more races
Data:
100%
rural population.
Median resident age:| This zip code: | 25.7 years |
| Pennsylvania median age: | 40.9 years |
Average household size:| This zip code: | 2.9 people |
| Pennsylvania: | 2.4 people |
Averages for the 2004 tax year for zip code 15760, filed in 2005:
Average Adjusted Gross Income (AGI) in 2004: $21,920 (Individual Income Tax Returns)
| Here: | $21,920 |
| State: | $48,049 |
Salary/wage: $19,386 (reported on 88.0% of returns)
| Here: | $19,386 |
| State: | $42,646 |
Total tax: $2,143 (reported on 56.0% of returns)
Earned income credit: $2,300 (reported on 20.0% of returns)
Percentage of individuals using paid preparers for their 2004 taxes: 80.0%
Estimated median household income in 2022: | This zip code: | $54,786 |
| Pennsylvania: | $71,798 |
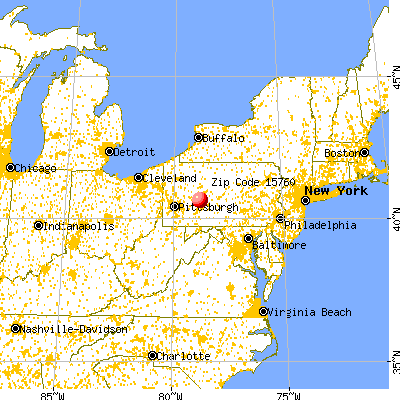
![15760 map]() Nearest zip codes: 15775
Nearest zip codes: 15775,
15714,
15738,
15762,
15737,
15773.
Percentage of family households:| This zip code: | 79.1% |
| Pennsylvania: | 42.6% |
Percentage of households with unmarried partners:| This zip code: | 51.4% |
| Pennsylvania: | 46.5% |
No gay or lesbian households reported
Household received Food Stamps/SNAP in the past 12 months: 0
Household did not receive Food Stamps/SNAP in the past 12 months: 28
Women who did not have a birth in the past 12 months: 13 (3 now married, 10 unmarried)
Housing units in zip code 15760 with a mortgage: 4
Residents with income below the poverty level in 2022:
| This zip code: | 13.0% |
| Whole state: | 11.8% |
| This zip code: | 13.0% |
| Whole state: | 6.1% |
Median number of rooms in houses and condos:

- Year house built (houses)
- 02020 or later
- 02010 to 2019
- 02000 to 2009
- 01990 to 1999
- 01980 to 1989
- 151970 to 1979
- 01960 to 1969
- 41950 to 1959
- 01940 to 1949
- 201939 or earlier
![Zip code 15760 satellite photo by USGS]()
Zip code 15760 household income distribution in 2022
![Zip code 15760 household income distribution in 2022]()
- 2$15,000 to $19,999
- 15$50,000 to $59,999
- 4$60,000 to $74,999
- 1$125,000 to $149,999
- 3$150,000 to $199,999
Estimate of home value of owner-occupied houses/condos in 2022 in zip code 15760
![Estimate of home value of owner-occupied houses/condos in 2022 in zip code 15760]()
- 6$35,000 to $39,999
- 7$40,000 to $49,999
- 1$200,000 to $249,999
- 4$300,000 to $399,999
Rent paid by renters in 2022 in zip code 15760
![Rent paid by renters in 2022 in zip code 15760]()
- 3$450 to $499
- 3No cash rent
Estimated median house (or condo) value in 2022 for:
- White Non-Hispanic householders: $325,287
Mean price in 2022:
Detached houses: $118,313| Here: | $118,313 |
| State: | $317,202 |
Housing units in structures:
- One, detached: 28
- Mobile homes: 10
Unemployment: 10.4%
Means of transportation to work in zip code 15760
![Means of transportation to work in zip code 15760]()
- 49.3%19Drove a car alone
- 33.8%13Carpooled
- 13.0%5Worked at home
Travel time to work (commute) in zip code 15760
![Travel time to work (commute) in zip code 15760]()
- 55 to 9 minutes
- 330 to 34 minutes
- 335 to 39 minutes
- 1940 to 44 minutes
Percentage of zip code residents living and working in this county: 63.2%
Household type by relationship:
Households: 82
- Male householders: 2 (2 living alone), Female householders: 27 (3 living alone)
14 spouses (14 opposite-sex spouses), 4 unmarried partners, (4 opposite-sex unmarried partners), 36 children (36 natural, 0 adopted, 0 stepchildren), 0 grandchildren, 0 brothers or sisters, 0 parents, 0 foster children, 0 other relatives, 0 non-relatives
Size of family households: 9 2-persons, 5 3-persons, 3 4-persons, 3 6-persons
Size of nonfamily households: 5 1-person
12 married couples with children.
13 single-parent households (13 women).
97.6% of residents of 15760 zip code speak English at home.
Foreign born population: 0 (0.0%)
![Zip code 15760 topographic map]()
Housing units lacking complete plumbing facilities: 24.4%
Housing units lacking complete kitchen facilities: 25.5%
- 69.2%Fuel oil, kerosene, etc.
- 32.8%Coal or coke
Population in 1990: 959.
Place of birth for U.S.-born residents:
86% of the 15760 zip code residents lived in the same house 5 years ago.
Out of people who lived in different houses, 100% lived in this county.
100% of the 15760 zip code residents lived in the same house 1 year ago.
Private vs. public school enrollment:
Students in private schools in grades 1 to 8 (elementary and middle school):
| Here: | 0.0% |
| Pennsylvania: | 15.7% |
| Here: | 0.0% |
| Pennsylvania: | 13.4% |
4
| Here: | 100.0% |
| Pennsylvania: | 39.8% |
Top industries in this zip code by the number of employees in 2005:
- Construction: Poured Concrete Foundation and Structure Contractors (10-19 employees: 1 establishment, 1-4 employees: 1 establishment)
Home Mortgage Disclosure Act Aggregated Statistics For Year 2009
(Based on 2 partial tracts)
|
| B) Conventional
Home Purchase Loans | C) Refinancings
| D) Home Improvement Loans
|
|---|
| Number | Average Value | Number | Average Value | Number | Average Value |
|---|
| LOANS ORIGINATED | 1 | $54,510 | 1 | $120,270 | 1 | $11,540 |
| APPLICATIONS APPROVED, NOT ACCEPTED | 0 | $0 | 0 | $0 | 0 | $0 |
| APPLICATIONS DENIED | 0 | $0 | 1 | $46,050 | 0 | $0 |
| APPLICATIONS WITHDRAWN | 0 | $0 | 1 | $67,990 | 0 | $0 |
| FILES CLOSED FOR INCOMPLETENESS | 0 | $0 | 0 | $0 | 0 | $0 |
Aggregated Statistics For Year 2008
(Based on 2 partial tracts)
|
| C) Refinancings
| D) Home Improvement Loans
|
|---|
| Number | Average Value | Number | Average Value |
|---|
| LOANS ORIGINATED | 1 | $100,420 | 1 | $30,430 |
| APPLICATIONS APPROVED, NOT ACCEPTED | 0 | $0 | 0 | $0 |
| APPLICATIONS DENIED | 1 | $102,520 | 1 | $27,950 |
| APPLICATIONS WITHDRAWN | 0 | $0 | 0 | $0 |
| FILES CLOSED FOR INCOMPLETENESS | 0 | $0 | 0 | $0 |
Aggregated Statistics For Year 2007
(Based on 2 partial tracts)
|
| B) Conventional
Home Purchase Loans | C) Refinancings
| D) Home Improvement Loans
|
|---|
| Number | Average Value | Number | Average Value | Number | Average Value |
|---|
| LOANS ORIGINATED | 1 | $69,510 | 2 | $53,315 | 1 | $28,720 |
| APPLICATIONS APPROVED, NOT ACCEPTED | 0 | $0 | 0 | $0 | 0 | $0 |
| APPLICATIONS DENIED | 0 | $0 | 2 | $66,175 | 1 | $32,310 |
| APPLICATIONS WITHDRAWN | 0 | $0 | 0 | $0 | 0 | $0 |
| FILES CLOSED FOR INCOMPLETENESS | 0 | $0 | 0 | $0 | 0 | $0 |
Aggregated Statistics For Year 2006
(Based on 2 partial tracts)
|
| B) Conventional
Home Purchase Loans | C) Refinancings
| D) Home Improvement Loans
|
|---|
| Number | Average Value | Number | Average Value | Number | Average Value |
|---|
| LOANS ORIGINATED | 1 | $48,080 | 2 | $79,835 | 2 | $23,500 |
| APPLICATIONS APPROVED, NOT ACCEPTED | 0 | $0 | 0 | $0 | 0 | $0 |
| APPLICATIONS DENIED | 0 | $0 | 2 | $91,870 | 1 | $25,030 |
| APPLICATIONS WITHDRAWN | 0 | $0 | 1 | $79,020 | 0 | $0 |
| FILES CLOSED FOR INCOMPLETENESS | 0 | $0 | 0 | $0 | 0 | $0 |
Aggregated Statistics For Year 2005
(Based on 2 partial tracts)
|
| B) Conventional
Home Purchase Loans | C) Refinancings
| D) Home Improvement Loans
|
|---|
| Number | Average Value | Number | Average Value | Number | Average Value |
|---|
| LOANS ORIGINATED | 1 | $75,490 | 2 | $65,110 | 1 | $24,300 |
| APPLICATIONS APPROVED, NOT ACCEPTED | 0 | $0 | 0 | $0 | 0 | $0 |
| APPLICATIONS DENIED | 0 | $0 | 2 | $73,300 | 0 | $0 |
| APPLICATIONS WITHDRAWN | 0 | $0 | 1 | $91,710 | 0 | $0 |
| FILES CLOSED FOR INCOMPLETENESS | 0 | $0 | 0 | $0 | 0 | $0 |
Aggregated Statistics For Year 2004
(Based on 2 partial tracts)
|
| B) Conventional
Home Purchase Loans | C) Refinancings
| D) Home Improvement Loans
|
|---|
| Number | Average Value | Number | Average Value | Number | Average Value |
|---|
| LOANS ORIGINATED | 1 | $61,090 | 2 | $69,930 | 2 | $20,480 |
| APPLICATIONS APPROVED, NOT ACCEPTED | 0 | $0 | 0 | $0 | 0 | $0 |
| APPLICATIONS DENIED | 0 | $0 | 2 | $58,115 | 1 | $16,630 |
| APPLICATIONS WITHDRAWN | 0 | $0 | 1 | $57,940 | 0 | $0 |
| FILES CLOSED FOR INCOMPLETENESS | 0 | $0 | 0 | $0 | 0 | $0 |
Aggregated Statistics For Year 2003
(Based on 2 partial tracts)
|
| B) Conventional
Home Purchase Loans | C) Refinancings
| D) Home Improvement Loans
|
|---|
| Number | Average Value | Number | Average Value | Number | Average Value |
|---|
| LOANS ORIGINATED | 1 | $41,120 | 4 | $54,512 | 2 | $25,915 |
| APPLICATIONS APPROVED, NOT ACCEPTED | 0 | $0 | 1 | $42,290 | 0 | $0 |
| APPLICATIONS DENIED | 0 | $0 | 2 | $71,900 | 0 | $0 |
| APPLICATIONS WITHDRAWN | 0 | $0 | 1 | $45,000 | 0 | $0 |
| FILES CLOSED FOR INCOMPLETENESS | 0 | $0 | 0 | $0 | 0 | $0 |
Aggregated Statistics For Year 2002
(Based on 2 partial tracts)
|
| B) Conventional
Home Purchase Loans | C) Refinancings
| D) Home Improvement Loans
|
|---|
| Number | Average Value | Number | Average Value | Number | Average Value |
|---|
| LOANS ORIGINATED | 1 | $67,860 | 3 | $58,087 | 1 | $22,100 |
| APPLICATIONS APPROVED, NOT ACCEPTED | 0 | $0 | 1 | $53,550 | 0 | $0 |
| APPLICATIONS DENIED | 0 | $0 | 2 | $64,600 | 0 | $0 |
| APPLICATIONS WITHDRAWN | 0 | $0 | 1 | $45,060 | 0 | $0 |
| FILES CLOSED FOR INCOMPLETENESS | 0 | $0 | 0 | $0 | 0 | $0 |
Aggregated Statistics For Year 2001
(Based on 2 partial tracts)
|
| B) Conventional
Home Purchase Loans | C) Refinancings
| D) Home Improvement Loans
|
|---|
| Number | Average Value | Number | Average Value | Number | Average Value |
|---|
| LOANS ORIGINATED | 1 | $33,040 | 2 | $39,480 | 2 | $16,535 |
| APPLICATIONS APPROVED, NOT ACCEPTED | 0 | $0 | 0 | $0 | 0 | $0 |
| APPLICATIONS DENIED | 0 | $0 | 1 | $64,330 | 0 | $0 |
| APPLICATIONS WITHDRAWN | 0 | $0 | 1 | $44,300 | 0 | $0 |
| FILES CLOSED FOR INCOMPLETENESS | 0 | $0 | 0 | $0 | 0 | $0 |
Aggregated Statistics For Year 2000
(Based on 2 partial tracts)
|
| B) Conventional
Home Purchase Loans | C) Refinancings
| D) Home Improvement Loans
|
|---|
| Number | Average Value | Number | Average Value | Number | Average Value |
|---|
| LOANS ORIGINATED | 1 | $40,040 | 1 | $58,480 | 1 | $15,580 |
| APPLICATIONS APPROVED, NOT ACCEPTED | 0 | $0 | 0 | $0 | 0 | $0 |
| APPLICATIONS DENIED | 1 | $16,120 | 1 | $55,430 | 0 | $0 |
| APPLICATIONS WITHDRAWN | 0 | $0 | 0 | $0 | 0 | $0 |
| FILES CLOSED FOR INCOMPLETENESS | 0 | $0 | 0 | $0 | 0 | $0 |
Aggregated Statistics For Year 1999
(Based on 1 partial tract)
|
| C) Refinancings
| D) Home Improvement Loans
|
|---|
| Number | Average Value | Number | Average Value |
|---|
| LOANS ORIGINATED | 1 | $32,220 | 1 | $12,310 |
| APPLICATIONS APPROVED, NOT ACCEPTED | 0 | $0 | 0 | $0 |
| APPLICATIONS DENIED | 1 | $31,920 | 0 | $0 |
| APPLICATIONS WITHDRAWN | 0 | $0 | 0 | $0 |
| FILES CLOSED FOR INCOMPLETENESS | 0 | $0 | 0 | $0 |
| Most common first names in zip code 15760 among deceased individuals |
| Name | Count | Lived (average) |
|---|
| John | 6 | 77.3 years |
| Andrew | 3 | 78.3 years |
| Joseph | 3 | 84.3 years |
| Eugene | 2 | 75.0 years |
| Dorothy | 2 | 74.0 years |
| Anna | 2 | 89.0 years |
| Elmer | 2 | 76.5 years |
| Margaret | 2 | 92.0 years |
| Michael | 2 | 67.0 years |
| William | 2 | 76.0 years |
| Most common last names in zip code 15760 among deceased individuals |
| Last name | Count | Lived (average) |
|---|
| Krupa | 5 | 79.2 years |
| Hanwell | 4 | 79.8 years |
| Conrad | 3 | 60.0 years |
| Norton | 3 | 84.3 years |
| Patterson | 3 | 80.3 years |
| Thur | 3 | 81.0 years |
| Toth | 3 | 75.7 years |
| Askew | 2 | 76.5 years |
| Kline | 2 | 75.0 years |
| Elder | 2 | 97.5 years |


 Nearest zip codes: 15775, 15714, 15738, 15762, 15737, 15773.


