Estimated zip code population in 2022: 719 Zip code population in 2010: 824 Zip code population in 2000: 796
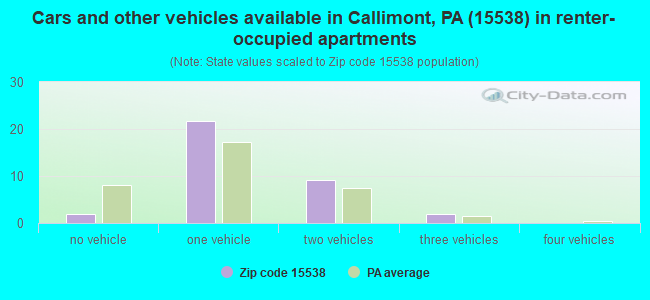
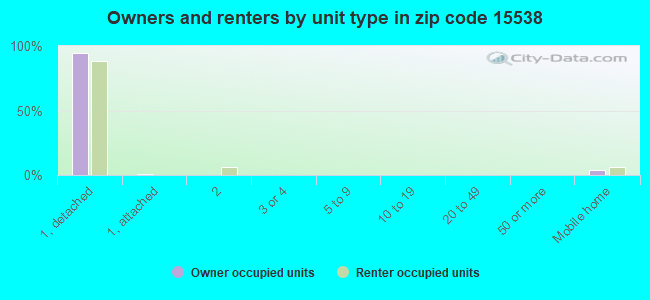
Houses and condos: 543 Renter-occupied apartments: 34
% of renters here:
12%
State:
31%
March 2022 cost of living index in zip code 15538: 91.0 (less than average, U.S. average is 100)
Land area: 74.4 sq. mi. Water area: 0.0 sq. mi.
Population density: 10 people per square mile
(very low).
OSM Map
General Map
Google Map
MSN Map
OSM Map
General Map
Google Map
MSN Map
OSM Map
General Map
Google Map
MSN Map
OSM Map
General Map
Google Map
MSN Map
Please wait while loading the map...
Real estate property taxes paid for housing units in 2022:
This zip code:
0.8% ($1,354)
Pennsylvania:
1.3% ($3,094)
Median real estate property taxes paid for housing units with mortgages in 2022: $1,556 (0.9%) Median real estate property taxes paid for housing units with no mortgage in 2022: $1,236 (0.7%)
Business Search- 14 Million verified businesses
Males: 394
(54.8%)
Females: 324
(45.2%)
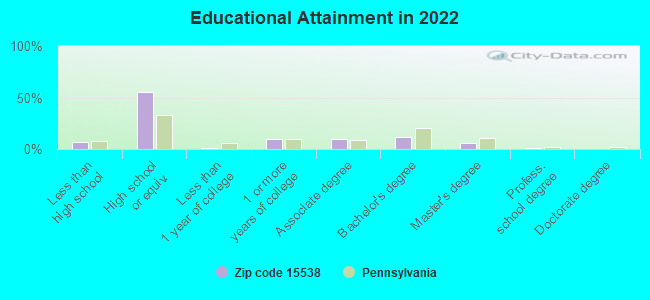
For population 25 years and over in 15538:
High school or higher: 92.4%
Bachelor's degree or higher: 18.5%
Graduate or professional degree: 6.9%
Unemployed: 4.1%
Mean travel time to work (commute): 29.9 minutes
For population 15 years and over in 15538:
Never married: 22.1%
Now married: 62.8%
Separated: 1.8%
Widowed: 3.8%
Divorced: 9.5%
Zip code 15538 compared to state average:
Black race population percentage significantly below state average.
Hispanic race population percentage significantly below state average.
Median age significantly above state average.
Foreign-born population percentage significantly below state average.
Renting percentage significantly below state average.
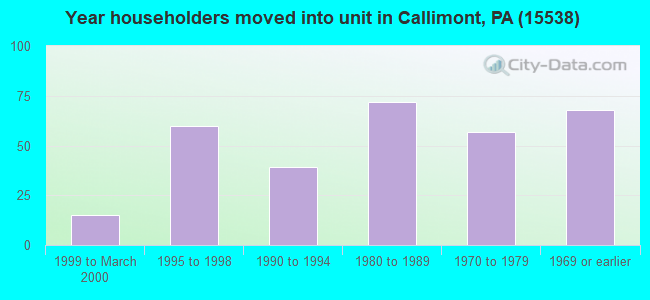
Length of stay since moving in significantly above state average.
Number of college students below state average.
Percentage of population with a bachelor's degree or higher below state average.
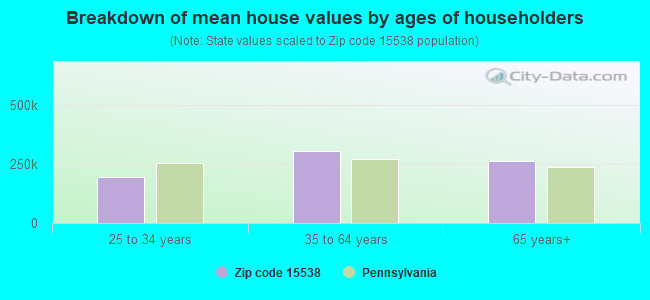
Estimated median house/condo value in 2022: $169,202
15538:
$169,202
Pennsylvania:
$245,500
According to our research of Pennsylvania and other state lists, there was 1 registered sex offender living in 15538 zip code as of July 04, 2024. The ratio of all residents to sex offenders in zip code 15538 is 807 to 1. The ratio of registered sex offenders to all residents in this zip code is lower than the state average.
Median resident age:
This zip code:
56.1 years
Pennsylvania median age:
40.9 years
Average household size:
This zip code:
2.4 people
Pennsylvania:
2.4 people
Averages for the 2020 tax year for zip code 15538, filed in 2021:
Average Adjusted Gross Income (AGI) in 2020: $51,797 (Individual Income Tax Returns)
Here:
$51,797
State:
$75,707
Salary/wage: $50,736 (reported on 73.5% of returns)
Here:
$50,736
State:
$62,806
(% of AGI for various income ranges: 1131.4% for AGIs below $25k, 3270.0% for AGIs $25k-50k, 6640.0% for AGIs $50k-75k, 11865.0% for AGIs $75k-100k, 17460.0% for AGIs $100k-200k)
Taxable interest for individuals: $907 (reported on 41.2% of returns)
This zip code:
$907
Pennsylvania:
$1,633
(% of AGI for various income ranges: 35.7% for AGIs below $25k, 110.0% for AGIs $25k-50k, 36.7% for AGIs $50k-75k, 46.7% for AGIs $100k-200k)
Ordinary dividends: $1,000 (reported on 11.8% of returns)
Here:
$1,000
State:
$7,382
(% of AGI for various income ranges: 57.1% for AGIs $25k-50k)
Net capital gain/loss in AGI: +$4,025 (reported on 11.8% of returns)
Here:
+$4,025
State:
+$23,522
(% of AGI for various income ranges: 230.0% for AGIs $25k-50k)
Profit/loss from business: +$7,400 (reported on 11.8% of returns)
Here:
+$7,400
State:
+$16,274
(% of AGI for various income ranges: 124.3% for AGIs below $25k, 696.7% for AGIs $50k-75k)
Taxable individual retirement arrangement distribution: $10,060 (reported on 14.7% of returns)
15538:
$10,060
Pennsylvania:
$18,583
(% of AGI for various income ranges: 181.4% for AGIs below $25k, 537.1% for AGIs $25k-50k)
Earned income credit: $2,075 (reported on 11.8% of returns)
Here:
$2,075
State:
$2,100
(% of AGI for various income ranges: 118.6% for AGIs below $25k)
Percentage of individuals using paid preparers for their 2020 taxes: 85.3%
Here:
85%
State:
92%
(% for various income ranges: 90.9% for AGIs below $25k, 80.0% for AGIs $25k-50k, 80.0% for AGIs $50k-75k, 100.0% for AGIs $75k-100k, 80.0% for AGIs $100k-200k)
Averages for the 2012 tax year for zip code 15538, filed in 2013:
Average Adjusted Gross Income (AGI) in 2012: $41,803 (Individual Income Tax Returns)
Here:
$41,803
State:
$61,346
Salary/wage: $40,048 (reported on 75.0% of returns)
Here:
$40,048
State:
$51,902
(% of AGI for various income ranges: 65.5% for AGIs below $25k, 78.5% for AGIs $25k-50k, 70.2% for AGIs $50k-75k, 77.4% for AGIs $75k-100k, 65.5% for AGIs $100k-200k)
Taxable interest for individuals: $450 (reported on 44.4% of returns)
This zip code:
$450
Pennsylvania:
$1,588
(% of AGI for various income ranges: 1.8% for AGIs below $25k, 0.4% for AGIs $25k-50k, 0.6% for AGIs $50k-75k, 0.4% for AGIs $75k-100k)
Ordinary dividends: $640 (reported on 13.9% of returns)
Here:
$640
State:
$5,827
Net capital gain/loss in AGI: +$650 (reported on 11.1% of returns)
Here:
+$650
State:
+$14,495
Profit/loss from business: +$10,175 (reported on 11.1% of returns)
Here:
+$10,175
State:
+$16,268
Taxable individual retirement arrangement distribution: $6,750 (reported on 11.1% of returns)
15538:
$6,750
Pennsylvania:
$14,550
Total itemized deductions: $15,100 (20% of AGI, reported on 16.7% of returns)
Here:
$15,100
State:
$23,538
Here:
19.9% of AGI
State:
18.4% of AGI
Charity contributions: $4,300 (reported on 8.3% of returns)
Here:
$4,300
State:
$4,025
Taxes paid: $4,667 (reported on 16.7% of returns)
15538:
$4,667
State:
$9,982
Earned income credit: $2,125 (reported on 11.1% of returns)
Here:
$2,125
State:
$2,106
(% of AGI for various income ranges: 5.7% for AGIs below $25k)
Percentage of individuals using paid preparers for their 2012 taxes: 61.1%
Here:
61%
State:
53%
(% for various income ranges: 57.1% for AGIs below $25k, 60.0% for AGIs $25k-50k, 80.0% for AGIs $50k-75k, 100.0% for AGIs $75k-100k)
Averages for the 2004 tax year for zip code 15538, filed in 2005:
Average Adjusted Gross Income (AGI) in 2004: $32,451 (Individual Income Tax Returns)
Here:
$32,451
State:
$48,049
Salary/wage: $32,048 (reported on 78.9% of returns)
Here:
$32,048
State:
$42,646
(% of AGI for various income ranges: 83.1% for AGIs below $10k, 64.6% for AGIs $10k-25k, 85.6% for AGIs $25k-50k, 83.8% for AGIs $50k-75k, 74.4% for AGIs $75k-100k, 63.8% for AGIs over 100k)
Taxable interest for individuals: $1,114 (reported on 48.3% of returns)
This zip code:
$1,114
Pennsylvania:
$1,657
(% of AGI for various income ranges: 11.7% for AGIs below $10k, 5.4% for AGIs $10k-25k, 1.5% for AGIs $25k-50k, 0.1% for AGIs $50k-75k, 0.9% for AGIs $75k-100k)
Taxable dividends: $638 (reported on 16.8% of returns)
Here:
$638
State:
$3,566
(% of AGI for various income ranges: 0.4% for AGIs $10k-25k, 0.8% for AGIs $25k-50k, 0.0% for AGIs $50k-75k, 0.1% for AGIs $75k-100k)
Net capital gain/loss: +$1,781 (reported on 9.2% of returns)
Here:
+$1,781
State:
+$9,716
Profit/loss from business: +$1,881 (reported on 12.1% of returns)
Here:
+$1,881
State:
+$14,267
IRA payment deduction: $2,545 (reported on 3.2% of returns)
15538:
$2,545
Pennsylvania:
$2,903
Total itemized deductions: $16,974 (24% of AGI, reported on 11.3% of returns)
Here:
$16,974
State:
$18,804
Here:
24.1% of AGI
State:
19.5% of AGI
Charity contributions deductions: $2,692 (4% of AGI, reported on 7.5% of returns)
Here:
$2,692
State:
$3,337
Here:
3.6% of AGI
State:
3.3% of AGI
Total tax: $3,813 (reported on 74.3% of returns)
15538:
$3,813
State:
$8,008
(% of AGI for various income ranges: 6.4% for AGIs below $10k, 4.8% for AGIs $10k-25k, 6.1% for AGIs $25k-50k, 9.7% for AGIs $50k-75k, 11.1% for AGIs $75k-100k, 15.7% for AGIs over 100k)
Earned income credit: $1,368 (reported on 16.5% of returns)
Here:
$1,368
State:
$1,643
Percentage of individuals using paid preparers for their 2004 taxes: 62.1%
Here:
62%
State:
56%
(% for various income ranges: 63.2% for AGIs below $10k, 63.5% for AGIs $10k-25k, 62.9% for AGIs $25k-50k, 56.9% for AGIs $50k-75k, 106.7% for AGIs $75k-100k)
Household received Food Stamps/SNAP in the past 12 months: 37 Household did not receive Food Stamps/SNAP in the past 12 months: 259
Women who had a birth in the past 12 months: 5 (5 now married, 0 unmarried) Women who did not have a birth in the past 12 months: 100 (58 now married, 41 unmarried)
Housing units in zip code 15538 with a mortgage: 98 (5 second mortgage, 5 both second mortgage and home equity loan) Houses without a mortgage: 4
Median monthly owner costs for units with a mortgage: $1,173 Median monthly owner costs for units without a mortgage: $348
Residents with income below the poverty level in 2022:
This zip code:
9.4%
Whole state:
11.8%
Residents with income below 50% of the poverty level in 2022:
This zip code:
6.8%
Whole state:
6.1%
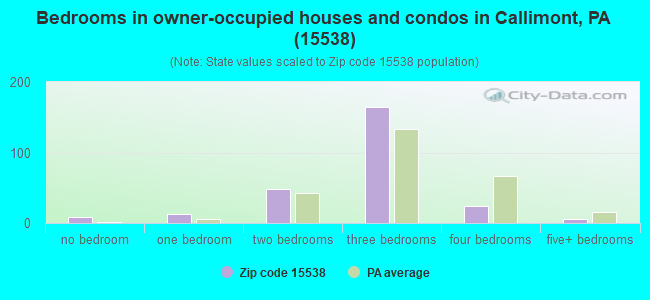
Median number of rooms in houses and condos:
Here:
6.0
State:
6.8
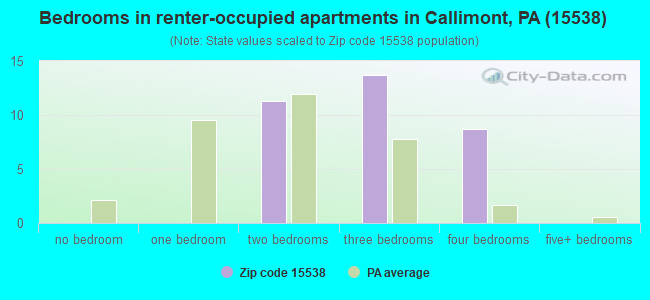
Median number of rooms in apartments:
Here:
6.0
State:
4.3
Notable locations in this zip code not listed on our city pages
Notable locations in zip code 15538: Southampton Mills (A), Mount Zion (B), Dividing Ridge (C), Roddys Station (D), Welch Station (E). Display/hide their locations on the map
Streams, rivers, and creeks: Ware Run (A), Shaffers Run (B), Savage Run (C), Panther Run (D), Mountain Run (E), Hillegas Run (F), Brush Creek (G), Bruck Run (H), Poorbaugh Run (I). Display/hide their locations on the map
Size of family households: 137 2-persons, 12 3-persons, 36 4-persons, 8 5-persons, 8 6-persons, 3 7-or-more-persons
Size of nonfamily households: 77 1-person, 13 2-persons
81 married couples with children.
5 single-parent households (4 men, 1 women).
98.6% of residents of 15538 zip code speak English at home.
0.3% of residents speak Spanish at home (100% well).
0.9% of residents speak other Indo-European language at home (50% very well, 33% well, 17% not well).
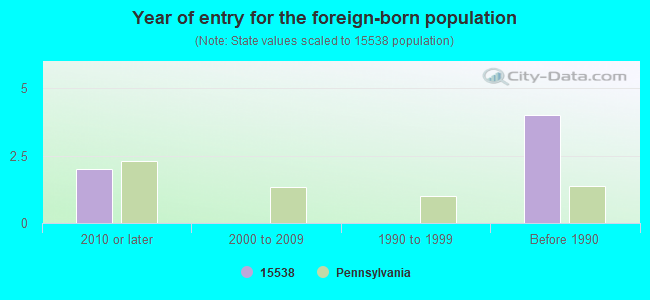
Foreign born population: 2 (0.3%) (0.0% of them are naturalized citizens)
:
0.3%
Whole state:
7.5%
50%Singapore
53%German
19%American
8%English
5%Italian
2%Irish
2%Polish
1%Scottish
Year of entry for the foreign-born population
22010 or later
02000 to 2009
01990 to 1999
4Before 1990
Housing units lacking complete plumbing facilities: 12.9% Housing units lacking complete kitchen facilities: 13.8%
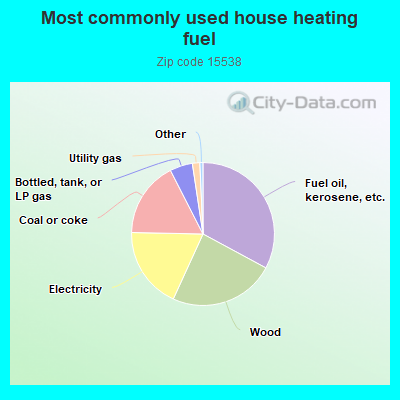
33.2%Fuel oil, kerosene, etc.
24.2%Wood
18.7%Electricity
17.3%Coal or coke
5.2%Bottled, tank, or LP gas
1.7%Utility gas
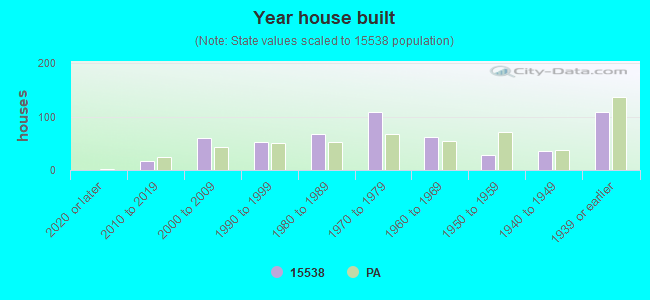
Population in 1990: 1,350.
Place of birth for U.S.-born residents:
This state: 576
Northeast: 4
Midwest: 17
South: 97
West: 13
81% of the 15538 zip code residents lived in the same house 5 years ago. Out of people who lived in different houses, 63% lived in this county. Out of people who lived in different counties, 50% lived in Pennsylvania.
96% of the 15538 zip code residents lived in the same house 1 year ago. Out of people who lived in different houses, 79% moved from this county. Out of people who lived in different houses, 21% moved from different county within same state.
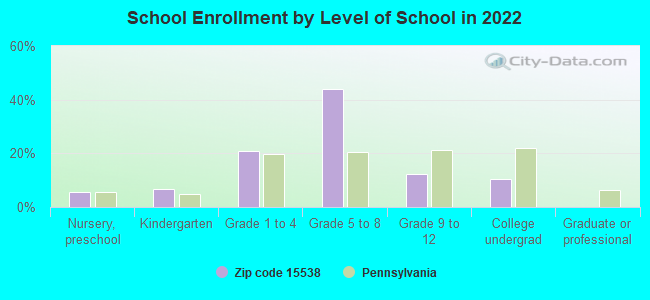
Private vs. public school enrollment:
Students in private schools in grades 1 to 8 (elementary and middle school): 10
Here:
14.9%
Pennsylvania:
15.7%
Students in private schools in grades 9 to 12 (high school): 1
Here:
7.6%
Pennsylvania:
13.4%
Students in private undergraduate colleges:
Here:
8.4%
Pennsylvania:
39.8%
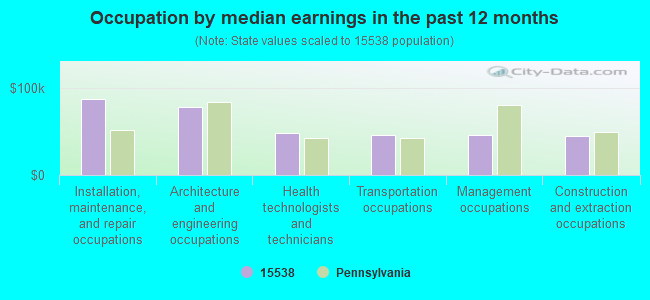
Occupation by median earnings in the past 12 months ($)
87,252Installation, maintenance, and repair occupations
78,558Architecture and engineering occupations
48,089Health technologists and technicians
46,256Transportation occupations
45,795Management occupations
45,050Construction and extraction occupations
Top industries in this zip code by the number of employees in 2005:
Mining: Drilling Oil and Gas Wells (1-4 employees: 1 establishment)
Construction: Residential Remodelers (1-4: 1)
Construction: Plumbing, Heating, and Air-Conditioning Contractors (1-4: 1)
Construction: Electrical Contractors (1-4: 1)
Accommodation and Food Services: Drinking Places (Alcoholic Beverages) (1-4: 1)
Home Mortgage Disclosure Act Aggregated Statistics For Year 2003 (Based on 2 partial tracts)
A) FHA, FSA/RHS & VA Home Purchase Loans
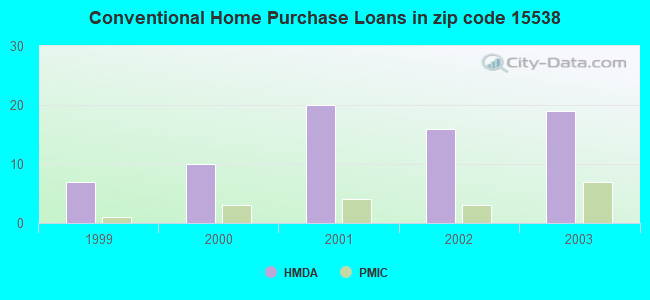
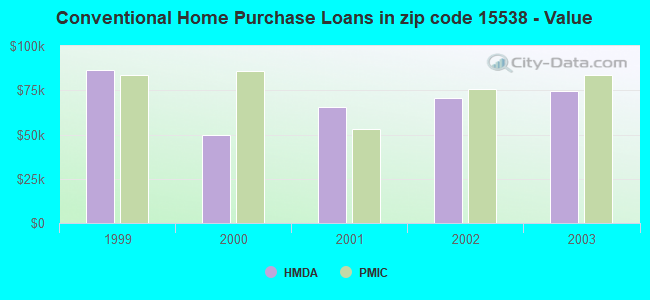
B) Conventional Home Purchase Loans
C) Refinancings
D) Home Improvement Loans
F) Non-occupant Loans on < 5 Family Dwellings (A B C & D)
Number
Average Value
Number
Average Value
Number
Average Value
Number
Average Value
Number
Average Value
LOANS ORIGINATED
3
$65,247
19
$74,637
67
$88,445
27
$32,157
1
$32,490
APPLICATIONS APPROVED, NOT ACCEPTED
0
$0
4
$120,408
15
$83,819
2
$8,935
0
$0
APPLICATIONS DENIED
1
$55,230
5
$58,804
45
$75,408
9
$35,376
1
$40,610
APPLICATIONS WITHDRAWN
0
$0
2
$82,845
24
$96,212
0
$0
0
$0
FILES CLOSED FOR INCOMPLETENESS
0
$0
0
$0
4
$103,555
2
$91,375
0
$0
Aggregated Statistics For Year 2002 (Based on 2 partial tracts)
A) FHA, FSA/RHS & VA Home Purchase Loans
B) Conventional Home Purchase Loans
C) Refinancings
D) Home Improvement Loans
F) Non-occupant Loans on < 5 Family Dwellings (A B C & D)
Number
Average Value
Number
Average Value
Number
Average Value
Number
Average Value
Number
Average Value
LOANS ORIGINATED
2
$95,025
16
$70,357
41
$59,528
17
$25,704
5
$50,194
APPLICATIONS APPROVED, NOT ACCEPTED
0
$0
4
$74,925
14
$70,487
3
$26,260
0
$0
APPLICATIONS DENIED
0
$0
8
$57,361
37
$88,574
11
$12,183
1
$3,250
APPLICATIONS WITHDRAWN
0
$0
2
$91,375
29
$67,020
1
$8,120
0
$0
FILES CLOSED FOR INCOMPLETENESS
0
$0
0
$0
2
$107,615
1
$40,610
0
$0
Aggregated Statistics For Year 2001 (Based on 2 partial tracts)
A) FHA, FSA/RHS & VA Home Purchase Loans
B) Conventional Home Purchase Loans
C) Refinancings
D) Home Improvement Loans
E) Loans on Dwellings For 5+ Families
F) Non-occupant Loans on < 5 Family Dwellings (A B C & D)
Number
Average Value
Number
Average Value
Number
Average Value
Number
Average Value
Number
Average Value
Number
Average Value
LOANS ORIGINATED
2
$84,470
20
$65,788
43
$50,659
28
$24,105
1
$12,180
7
$48,500
APPLICATIONS APPROVED, NOT ACCEPTED
1
$52,790
4
$83,658
6
$74,045
1
$16,240
0
$0
0
$0
APPLICATIONS DENIED
1
$60,910
11
$46,665
28
$58,043
5
$13,644
0
$0
2
$66,600
APPLICATIONS WITHDRAWN
1
$52,790
2
$105,180
9
$50,988
4
$14,620
0
$0
0
$0
FILES CLOSED FOR INCOMPLETENESS
0
$0
0
$0
0
$0
0
$0
0
$0
0
$0
Aggregated Statistics For Year 2000 (Based on 2 partial tracts)
A) FHA, FSA/RHS & VA Home Purchase Loans
B) Conventional Home Purchase Loans
C) Refinancings
D) Home Improvement Loans
F) Non-occupant Loans on < 5 Family Dwellings (A B C & D)
Number
Average Value
Number
Average Value
Number
Average Value
Number
Average Value
Number
Average Value
LOANS ORIGINATED
3
$59,833
10
$49,788
15
$64,651
12
$10,085
4
$29,645
APPLICATIONS APPROVED, NOT ACCEPTED
0
$0
2
$34,520
7
$57,666
2
$9,745
1
$27,610
APPLICATIONS DENIED
0
$0
10
$42,722
11
$47,625
3
$36,820
1
$30,050
APPLICATIONS WITHDRAWN
1
$32,490
3
$72,827
4
$84,875
1
$20,310
1
$97,460
FILES CLOSED FOR INCOMPLETENESS
0
$0
0
$0
0
$0
0
$0
0
$0
Aggregated Statistics For Year 1999 (Based on 1 partial tract)


 Nearest zip codes: 15545, 15530, 15564, 15534, 21524, 21545.