Estimated zip code population in 2022: 203
Zip code population in 2010: 192
Zip code population in 2000: 276
March 2022 cost of living index in zip code 15448: 85.2
(less than average, U.S. average is 100)
Land area: 1.0
sq. mi.
Water area: 0.1
sq. mi.
| Population density: 212 people per square mile | | (very low). |
![Age and Sex of Residents in zip code 15448]()
- OSM Map
- General Map
- Google Map
- MSN Map
- OSM Map
- General Map
- Google Map
- MSN Map
- OSM Map
- General Map
- Google Map
- MSN Map
- OSM Map
- General Map
- Google Map
- MSN Map
Please wait while loading the map...
Median real estate property taxes paid for housing units with mortgages in 2022: $502
Business Search - 14 Million verified businesses
| Males: 42 |  (21.1%) (21.1%) |
| Females: 160 |  (78.9%) (78.9%) |
For population 25 years and over in 15448:
- High school or higher: 94.2%
- Bachelor's degree or higher: 5.3%
- Graduate or professional degree: 0.0%
- Unemployed: 10.7%
- Mean travel time to work (commute): 22.2 minutes
For population 15 years and over in 15448:
- Never married: 41.4%
- Now married: 26.3%
- Separated: 0.0%
- Widowed: 28.4%
- Divorced: 4.0%
Zip code 15448 compared to state average:
- Median house value significantly below state average.
- Unemployed percentage above state average.
- Black race population percentage significantly below state average.
- Hispanic race population percentage significantly below state average.
- Median age significantly above state average.
- Foreign-born population percentage significantly below state average.
- Renting percentage significantly below state average.
- Length of stay since moving in significantly above state average.
- Number of rooms per house below state average.
- House age above state average.
- Number of college students significantly below state average.
- Percentage of population with a bachelor's degree or higher significantly below state average.
Data:
100%
rural population.
Estimated median house/condo value in 2022: $74,128
| 15448: | $74,128 |
| Pennsylvania: | $245,500 |
Median resident age:| This zip code: | 52.6 years |
| Pennsylvania median age: | 40.9 years |
Average household size:| This zip code: | 2.2 people |
| Pennsylvania: | 2.4 people |
Averages for the 2004 tax year for zip code 15448, filed in 2005:
Average Adjusted Gross Income (AGI) in 2004: $22,163 (Individual Income Tax Returns)
| Here: | $22,163 |
| State: | $48,049 |
Salary/wage: $21,662 (reported on 81.6% of returns)
| Here: | $21,662 |
| State: | $42,646 |
Taxable interest for individuals: $577 (reported on 26.5% of returns)
| This zip code: | $577 |
| Pennsylvania: | $1,657 |
Total tax: $2,000 (reported on 65.3% of returns)
Earned income credit: $1,762 (reported on 21.4% of returns)
Percentage of individuals using paid preparers for their 2004 taxes: 58.2%
Estimated median household income in 2022: | This zip code: | $54,889 |
| Pennsylvania: | $71,798 |
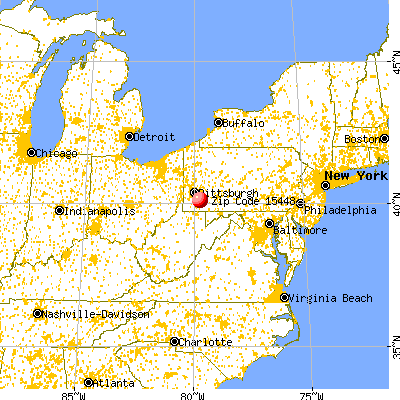
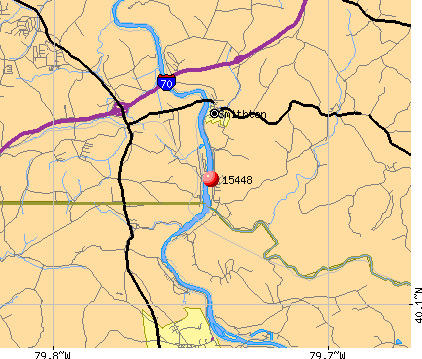
![15448 map]() Nearest zip codes: 15479
Nearest zip codes: 15479,
15492,
15428,
15695,
15482,
15012.
Percentage of family households:| This zip code: | 26.7% |
| Pennsylvania: | 42.6% |
Percentage of households with unmarried partners:| This zip code: | 0.0% |
| Pennsylvania: | 46.5% |
No gay or lesbian households reported
Household received Food Stamps/SNAP in the past 12 months: 0
Household did not receive Food Stamps/SNAP in the past 12 months: 90
Women who did not have a birth in the past 12 months: 70 (0 now married, 71 unmarried)
Housing units in zip code 15448 with a mortgage: 57 (7
second mortgage, 7
both second mortgage and home equity loan)
Median number of rooms in houses and condos:

- Year house built (houses)
- 02020 or later
- 02010 to 2019
- 02000 to 2009
- 01990 to 1999
- 01980 to 1989
- 441970 to 1979
- 01960 to 1969
- 01950 to 1959
- 151940 to 1949
- 891939 or earlier
![Zip code 15448 satellite photo by USGS]()
- Bedrooms in owner-occupied houses and condos in 15448
- 0no bedroom
- 01 bedroom
- 332 bedrooms
- 343 bedrooms
- 254 bedrooms
- 05+ bedrooms
- Cars and other vehicles available in 15448 in owner-occupied houses/condos
- 0no vehicle
- 501 vehicle
- 432 vehicles
- 03 vehicles
- 04 vehicles
- 05+ vehicles
Zip code 15448 household income distribution in 2022
![Zip code 15448 household income distribution in 2022]()
- 8$25,000 to $29,999
- 8$35,000 to $39,999
- 26$40,000 to $44,999
- 8$50,000 to $59,999
- 43$60,000 to $74,999
Estimate of home value of owner-occupied houses/condos in 2022 in zip code 15448
![Estimate of home value of owner-occupied houses/condos in 2022 in zip code 15448]()
- 8$25,000 to $29,999
- 12$50,000 to $59,999
- 26$60,000 to $69,999
- 32$80,000 to $89,999
- 7$175,000 to $199,999
Estimated median house (or condo) value in 2022 for:
- White Non-Hispanic householders: $101,224
Estimated median house or condo value in 2022: $74,128
| 15448: | $74,128 |
| Pennsylvania: | $245,500 |
$64,421 - $91,669
Mean price in 2022:
Detached houses: $80,069| Here: | $80,069 |
| State: | $317,202 |
Housing units in structures:
Unemployment: 10.7%
Means of transportation to work in zip code 15448
![Means of transportation to work in zip code 15448]()
- 75.0%98Drove a car alone
- 13.8%18Carpooled
- 6.1%8Walked
Travel time to work (commute) in zip code 15448
![Travel time to work (commute) in zip code 15448]()
- 85 to 9 minutes
- 1610 to 14 minutes
- 4315 to 19 minutes
- 2320 to 24 minutes
- 3345 to 59 minutes
Percentage of zip code residents living and working in this county: 81.5%
Household type by relationship:
Households: 203
- Male householders: 17 (8 living alone), Female householders: 75 (25 living alone)
26 spouses (26 opposite-sex spouses), 0 unmarried partners, (0 opposite-sex unmarried partners), 25 children (25 natural, 0 adopted, 0 stepchildren), 45 grandchildren, 0 brothers or sisters, 7 parents, 0 foster children, 8 other relatives, 0 non-relatives
Size of family households: 9 2-persons, 48 3-persons
Size of nonfamily households: 33 1-person
99.5% of residents of 15448 zip code speak English at home.
Foreign born population: 0 (0.0%)

- 57%Carpatho Rusyn
- 25%Russian
![Zip code 15448 topographic map]()
Housing units lacking complete plumbing facilities: 25.8%
Housing units lacking complete kitchen facilities: 36.6%
Place of birth for U.S.-born residents:
73% of the 15448 zip code residents lived in the same house 5 years ago.
Out of people who lived in different houses, 24% lived in this county.
96% of the 15448 zip code residents lived in the same house 1 year ago.
Out of people who lived in different houses, 100% moved from this county.
Top industries in this zip code by the number of employees in 2005:
- Accommodation and Food Services: Drinking Places (Alcoholic Beverages) (1-4 employees: 1 establishment)
Home Mortgage Disclosure Act Aggregated Statistics For Year 2009
(Based on 2 partial tracts)
|
| C) Refinancings
| D) Home Improvement Loans
|
|---|
| Number | Average Value | Number | Average Value |
|---|
| LOANS ORIGINATED | 2 | $119,080 | 0 | $0 |
| APPLICATIONS APPROVED, NOT ACCEPTED | 0 | $0 | 0 | $0 |
| APPLICATIONS DENIED | 1 | $194,380 | 1 | $7,550 |
| APPLICATIONS WITHDRAWN | 1 | $60,910 | 0 | $0 |
| FILES CLOSED FOR INCOMPLETENESS | 0 | $0 | 0 | $0 |
Aggregated Statistics For Year 2008
(Based on 2 partial tracts)
|
| B) Conventional
Home Purchase Loans | C) Refinancings
| D) Home Improvement Loans
|
|---|
| Number | Average Value | Number | Average Value | Number | Average Value |
|---|
| LOANS ORIGINATED | 1 | $57,220 | 1 | $97,780 | 1 | $42,130 |
| APPLICATIONS APPROVED, NOT ACCEPTED | 0 | $0 | 0 | $0 | 0 | $0 |
| APPLICATIONS DENIED | 0 | $0 | 2 | $112,790 | 1 | $50,780 |
| APPLICATIONS WITHDRAWN | 0 | $0 | 1 | $61,390 | 0 | $0 |
| FILES CLOSED FOR INCOMPLETENESS | 0 | $0 | 0 | $0 | 0 | $0 |
Aggregated Statistics For Year 2007
(Based on 2 partial tracts)
|
| B) Conventional
Home Purchase Loans | C) Refinancings
| D) Home Improvement Loans
|
|---|
| Number | Average Value | Number | Average Value | Number | Average Value |
|---|
| LOANS ORIGINATED | 1 | $188,090 | 2 | $96,915 | 1 | $47,080 |
| APPLICATIONS APPROVED, NOT ACCEPTED | 0 | $0 | 1 | $115,860 | 0 | $0 |
| APPLICATIONS DENIED | 0 | $0 | 3 | $98,747 | 0 | $0 |
| APPLICATIONS WITHDRAWN | 0 | $0 | 1 | $91,100 | 0 | $0 |
| FILES CLOSED FOR INCOMPLETENESS | 0 | $0 | 0 | $0 | 0 | $0 |
Aggregated Statistics For Year 2006
(Based on 2 partial tracts)
|
| B) Conventional
Home Purchase Loans | C) Refinancings
| D) Home Improvement Loans
|
|---|
| Number | Average Value | Number | Average Value | Number | Average Value |
|---|
| LOANS ORIGINATED | 2 | $98,330 | 5 | $83,804 | 1 | $35,680 |
| APPLICATIONS APPROVED, NOT ACCEPTED | 0 | $0 | 1 | $97,620 | 0 | $0 |
| APPLICATIONS DENIED | 1 | $48,890 | 5 | $77,248 | 1 | $38,040 |
| APPLICATIONS WITHDRAWN | 0 | $0 | 1 | $88,740 | 0 | $0 |
| FILES CLOSED FOR INCOMPLETENESS | 0 | $0 | 0 | $0 | 0 | $0 |
Aggregated Statistics For Year 2005
(Based on 2 partial tracts)
|
| B) Conventional
Home Purchase Loans | C) Refinancings
| D) Home Improvement Loans
| G) Loans On Manufactured
Home Dwelling (A B C & D) |
|---|
| Number | Average Value | Number | Average Value | Number | Average Value | Number | Average Value |
|---|
| LOANS ORIGINATED | 2 | $88,545 | 5 | $89,478 | 2 | $18,825 | 0 | $0 |
| APPLICATIONS APPROVED, NOT ACCEPTED | 0 | $0 | 0 | $0 | 0 | $0 | 0 | $0 |
| APPLICATIONS DENIED | 0 | $0 | 4 | $78,678 | 1 | $46,920 | 1 | $23,110 |
| APPLICATIONS WITHDRAWN | 0 | $0 | 1 | $116,170 | 0 | $0 | 0 | $0 |
| FILES CLOSED FOR INCOMPLETENESS | 0 | $0 | 0 | $0 | 0 | $0 | 0 | $0 |
Aggregated Statistics For Year 2004
(Based on 2 partial tracts)
|
| B) Conventional
Home Purchase Loans | C) Refinancings
| D) Home Improvement Loans
| G) Loans On Manufactured
Home Dwelling (A B C & D) |
|---|
| Number | Average Value | Number | Average Value | Number | Average Value | Number | Average Value |
|---|
| LOANS ORIGINATED | 3 | $99,980 | 4 | $110,020 | 1 | $25,070 | 0 | $0 |
| APPLICATIONS APPROVED, NOT ACCEPTED | 0 | $0 | 1 | $121,990 | 0 | $0 | 0 | $0 |
| APPLICATIONS DENIED | 1 | $32,540 | 4 | $97,778 | 1 | $56,430 | 1 | $47,080 |
| APPLICATIONS WITHDRAWN | 0 | $0 | 2 | $87,560 | 0 | $0 | 0 | $0 |
| FILES CLOSED FOR INCOMPLETENESS | 0 | $0 | 0 | $0 | 0 | $0 | 0 | $0 |
Aggregated Statistics For Year 2003
(Based on 2 partial tracts)
|
| B) Conventional
Home Purchase Loans | C) Refinancings
| D) Home Improvement Loans
|
|---|
| Number | Average Value | Number | Average Value | Number | Average Value |
|---|
| LOANS ORIGINATED | 2 | $67,320 | 8 | $59,049 | 1 | $32,380 |
| APPLICATIONS APPROVED, NOT ACCEPTED | 0 | $0 | 2 | $79,270 | 0 | $0 |
| APPLICATIONS DENIED | 1 | $28,690 | 5 | $81,100 | 1 | $13,440 |
| APPLICATIONS WITHDRAWN | 0 | $0 | 2 | $90,860 | 0 | $0 |
| FILES CLOSED FOR INCOMPLETENESS | 0 | $0 | 0 | $0 | 0 | $0 |
Aggregated Statistics For Year 2002
(Based on 2 partial tracts)
|
| B) Conventional
Home Purchase Loans | C) Refinancings
| D) Home Improvement Loans
|
|---|
| Number | Average Value | Number | Average Value | Number | Average Value |
|---|
| LOANS ORIGINATED | 1 | $97,540 | 7 | $83,193 | 1 | $47,000 |
| APPLICATIONS APPROVED, NOT ACCEPTED | 0 | $0 | 1 | $120,020 | 0 | $0 |
| APPLICATIONS DENIED | 0 | $0 | 3 | $63,877 | 1 | $6,600 |
| APPLICATIONS WITHDRAWN | 0 | $0 | 1 | $98,330 | 0 | $0 |
| FILES CLOSED FOR INCOMPLETENESS | 0 | $0 | 0 | $0 | 0 | $0 |
Aggregated Statistics For Year 2001
(Based on 2 partial tracts)
|
| B) Conventional
Home Purchase Loans | C) Refinancings
| D) Home Improvement Loans
|
|---|
| Number | Average Value | Number | Average Value | Number | Average Value |
|---|
| LOANS ORIGINATED | 2 | $51,955 | 8 | $59,334 | 1 | $41,110 |
| APPLICATIONS APPROVED, NOT ACCEPTED | 0 | $0 | 1 | $83,870 | 0 | $0 |
| APPLICATIONS DENIED | 0 | $0 | 3 | $59,630 | 1 | $6,370 |
| APPLICATIONS WITHDRAWN | 0 | $0 | 1 | $52,350 | 0 | $0 |
| FILES CLOSED FOR INCOMPLETENESS | 0 | $0 | 0 | $0 | 0 | $0 |
Aggregated Statistics For Year 2000
(Based on 2 partial tracts)
|
| B) Conventional
Home Purchase Loans | C) Refinancings
| D) Home Improvement Loans
|
|---|
| Number | Average Value | Number | Average Value | Number | Average Value |
|---|
| LOANS ORIGINATED | 1 | $41,890 | 2 | $55,215 | 1 | $20,360 |
| APPLICATIONS APPROVED, NOT ACCEPTED | 0 | $0 | 1 | $43,470 | 0 | $0 |
| APPLICATIONS DENIED | 1 | $71,600 | 1 | $105,720 | 1 | $11,630 |
| APPLICATIONS WITHDRAWN | 0 | $0 | 1 | $33,960 | 0 | $0 |
| FILES CLOSED FOR INCOMPLETENESS | 0 | $0 | 1 | $43,390 | 0 | $0 |
Aggregated Statistics For Year 1999
(Based on 1 partial tract)
|
| B) Conventional
Home Purchase Loans | C) Refinancings
| D) Home Improvement Loans
|
|---|
| Number | Average Value | Number | Average Value | Number | Average Value |
|---|
| LOANS ORIGINATED | 1 | $78,720 | 2 | $36,840 | 1 | $17,730 |
| APPLICATIONS APPROVED, NOT ACCEPTED | 0 | $0 | 1 | $41,960 | 0 | $0 |
| APPLICATIONS DENIED | 0 | $0 | 1 | $62,570 | 0 | $0 |
| APPLICATIONS WITHDRAWN | 0 | $0 | 1 | $37,080 | 0 | $0 |
| FILES CLOSED FOR INCOMPLETENESS | 0 | $0 | 0 | $0 | 0 | $0 |
Private Mortgage Insurance Companies Aggregated Statistics For Year 2006
(Based on 2 partial tracts)
|
| B) Refinancings
|
|---|
| Number | Average Value |
|---|
| LOANS ORIGINATED | 1 | $77,500 |
| APPLICATIONS APPROVED, NOT ACCEPTED | 0 | $0 |
| APPLICATIONS DENIED | 0 | $0 |
| APPLICATIONS WITHDRAWN | 0 | $0 |
| FILES CLOSED FOR INCOMPLETENESS | 0 | $0 |
| Most common first names in zip code 15448 among deceased individuals |
| Name | Count | Lived (average) |
|---|
| John | 9 | 79.9 years |
| George | 6 | 77.2 years |
| Anna | 4 | 88.3 years |
| Frank | 4 | 88.0 years |
| Joseph | 4 | 75.5 years |
| Mary | 4 | 84.5 years |
| William | 4 | 70.5 years |
| Charles | 3 | 78.9 years |
| James | 3 | 73.0 years |
| Irene | 3 | 68.3 years |
| Most common last names in zip code 15448 among deceased individuals |
| Last name | Count | Lived (average) |
|---|
| Sethman | 4 | 71.5 years |
| Toth | 4 | 76.8 years |
| Lesko | 3 | 72.3 years |
| Garber | 3 | 65.7 years |
| Snyder | 3 | 78.0 years |
| Bryan | 2 | 68.5 years |
| Gluz | 2 | 74.0 years |
| Haley | 2 | 68.4 years |
| Homer | 2 | 84.0 years |
| Johnston | 2 | 70.5 years |


 Nearest zip codes: 15479, 15492, 15428, 15695, 15482, 15012.


