Estimated zip code population in 2022: 1,540 Zip code population in 2010: 2,150 Zip code population in 2000: 2,390
Houses and condos: 797 Renter-occupied apartments: 136
% of renters here:
21%
State:
31%
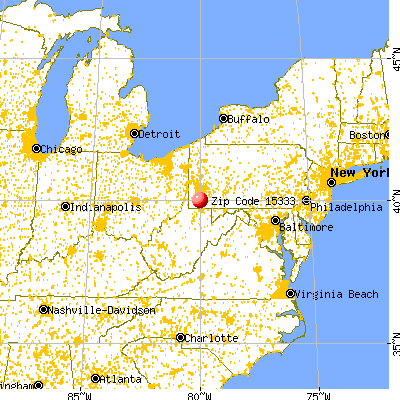
March 2022 cost of living index in zip code 15333: 88.1 (less than average, U.S. average is 100)
Land area: 13.8 sq. mi. Water area: 0.1 sq. mi.
Population density: 112 people per square mile
(very low).
OSM Map
General Map
Google Map
MSN Map
OSM Map
General Map
Google Map
MSN Map
OSM Map
General Map
Google Map
MSN Map
OSM Map
General Map
Google Map
MSN Map
Please wait while loading the map...
Real estate property taxes paid for housing units in 2022:
This zip code:
0.9% ($2,363)
Pennsylvania:
1.3% ($3,094)
Median real estate property taxes paid for housing units with mortgages in 2022: $2,772 (0.9%) Median real estate property taxes paid for housing units with no mortgage in 2022: $1,619 (0.9%)
Business Search- 14 Million verified businesses
Males: 761
(49.4%)
Females: 779
(50.6%)
For population 25 years and over in 15333:
High school or higher: 96.9%
Bachelor's degree or higher: 38.4%
Graduate or professional degree: 23.3%
Unemployed: 0.4%
Mean travel time to work (commute): 27.1 minutes
For population 15 years and over in 15333:
Never married: 25.5%
Now married: 48.7%
Separated: 0.4%
Widowed: 10.1%
Divorced: 15.3%
Zip code 15333 compared to state average:
Unemployed percentage significantly below state average.
Black race population percentage significantly below state average.
Hispanic race population percentage significantly below state average.
Foreign-born population percentage significantly below state average.
Length of stay since moving in above state average.
Estimated median house/condo value in 2022: $265,470
15333:
$265,470
Pennsylvania:
$245,500
According to our research of Pennsylvania and other state lists, there were 4 registered sex offenders living in 15333 zip code as of July 03, 2024. The ratio of all residents to sex offenders in zip code 15333 is 657 to 1. The ratio of registered sex offenders to all residents in this zip code is near the state average.
Median resident age:
This zip code:
37.2 years
Pennsylvania median age:
40.9 years
Average household size:
This zip code:
2.3 people
Pennsylvania:
2.4 people
Averages for the 2020 tax year for zip code 15333, filed in 2021:
Average Adjusted Gross Income (AGI) in 2020: $57,604 (Individual Income Tax Returns)
Here:
$57,604
State:
$75,707
Salary/wage: $48,497 (reported on 80.4% of returns)
Here:
$48,497
State:
$62,806
(% of AGI for various income ranges: 886.8% for AGIs below $25k, 3100.6% for AGIs $25k-50k, 5396.4% for AGIs $50k-75k, 8428.6% for AGIs $75k-100k, 15018.2% for AGIs $100k-200k)
Taxable interest for individuals: $512 (reported on 26.1% of returns)
This zip code:
$512
Pennsylvania:
$1,633
(% of AGI for various income ranges: 10.0% for AGIs below $25k, 6.1% for AGIs $25k-50k, 30.9% for AGIs $50k-75k, 18.6% for AGIs $75k-100k, 39.1% for AGIs $100k-200k)
Ordinary dividends: $1,913 (reported on 16.3% of returns)
Here:
$1,913
State:
$7,382
(% of AGI for various income ranges: 7.3% for AGIs below $25k, 15.0% for AGIs $25k-50k, 35.5% for AGIs $50k-75k, 28.6% for AGIs $75k-100k, 168.2% for AGIs $100k-200k)
Net capital gain/loss in AGI: +$5,810 (reported on 10.9% of returns)
Here:
+$5,810
State:
+$23,522
(% of AGI for various income ranges: 9.1% for AGIs below $25k, 128.2% for AGIs $50k-75k, 381.8% for AGIs $100k-200k)
Profit/loss from business: +$5,012 (reported on 8.7% of returns)
Here:
+$5,012
State:
+$16,274
(% of AGI for various income ranges: 115.0% for AGIs below $25k, 140.9% for AGIs $100k-200k)
Taxable individual retirement arrangement distribution: $15,022 (reported on 9.8% of returns)
15333:
$15,022
Pennsylvania:
$18,583
(% of AGI for various income ranges: 91.8% for AGIs below $25k, 485.5% for AGIs $50k-75k, 560.0% for AGIs $100k-200k)
Earned income credit: $1,908 (reported on 13.0% of returns)
Here:
$1,908
State:
$2,100
(% of AGI for various income ranges: 50.9% for AGIs below $25k, 65.0% for AGIs $25k-50k)
Percentage of individuals using paid preparers for their 2020 taxes: 90.2%
Here:
90%
State:
92%
(% for various income ranges: 90.0% for AGIs below $25k, 90.9% for AGIs $25k-50k, 92.9% for AGIs $50k-75k, 90.0% for AGIs $75k-100k, 85.7% for AGIs $100k-200k, 100.0% for AGIs over 200k)
Averages for the 2012 tax year for zip code 15333, filed in 2013:
Average Adjusted Gross Income (AGI) in 2012: $49,646 (Individual Income Tax Returns)
Here:
$49,646
State:
$61,346
Salary/wage: $46,753 (reported on 80.4% of returns)
Here:
$46,753
State:
$51,902
(% of AGI for various income ranges: 65.4% for AGIs below $25k, 74.0% for AGIs $25k-50k, 80.4% for AGIs $50k-75k, 78.2% for AGIs $75k-100k, 74.9% for AGIs $100k-200k)
Taxable interest for individuals: $612 (reported on 34.8% of returns)
This zip code:
$612
Pennsylvania:
$1,588
(% of AGI for various income ranges: 2.1% for AGIs below $25k, 0.3% for AGIs $25k-50k, 0.3% for AGIs $50k-75k, 0.4% for AGIs $75k-100k, 0.2% for AGIs $100k-200k)
Ordinary dividends: $1,619 (reported on 17.4% of returns)
Here:
$1,619
State:
$5,827
(% of AGI for various income ranges: 1.1% for AGIs below $25k, 0.5% for AGIs $25k-50k, 0.5% for AGIs $50k-75k, 0.6% for AGIs $75k-100k, 0.5% for AGIs $100k-200k)
Net capital gain/loss in AGI: +$844 (reported on 9.8% of returns)
Here:
+$844
State:
+$14,495
(% of AGI for various income ranges: 0.2% for AGIs below $25k, 0.2% for AGIs $50k-75k, 0.3% for AGIs $100k-200k)
Profit/loss from business: +$6,467 (reported on 9.8% of returns)
Here:
+$6,467
State:
+$16,268
(% of AGI for various income ranges: 3.4% for AGIs below $25k, 3.3% for AGIs $25k-50k, 2.1% for AGIs $75k-100k)
Taxable individual retirement arrangement distribution: $11,300 (reported on 10.9% of returns)
15333:
$11,300
Pennsylvania:
$14,550
(% of AGI for various income ranges: 4.1% for AGIs below $25k, 3.9% for AGIs $25k-50k, 7.2% for AGIs $75k-100k)
Total itemized deductions: $18,094 (19% of AGI, reported on 17.4% of returns)
Here:
$18,094
State:
$23,538
Here:
18.7% of AGI
State:
18.4% of AGI
(% of AGI for various income ranges: 6.7% for AGIs $25k-50k, 4.8% for AGIs $50k-75k, 6.3% for AGIs $75k-100k, 8.6% for AGIs $100k-200k)
Charity contributions: $2,315 (reported on 14.1% of returns)
Here:
$2,315
State:
$4,025
(% of AGI for various income ranges: 0.8% for AGIs below $25k, 0.4% for AGIs $50k-75k, 0.9% for AGIs $75k-100k, 1.0% for AGIs $100k-200k)
Taxes paid: $6,350 (reported on 17.4% of returns)
15333:
$6,350
State:
$9,982
(% of AGI for various income ranges: 1.6% for AGIs $25k-50k, 1.4% for AGIs $50k-75k, 2.1% for AGIs $75k-100k, 3.6% for AGIs $100k-200k)
Earned income credit: $1,992 (reported on 14.1% of returns)
Here:
$1,992
State:
$2,106
(% of AGI for various income ranges: 4.8% for AGIs below $25k, 1.0% for AGIs $25k-50k)
Percentage of individuals using paid preparers for their 2012 taxes: 54.3%
Here:
54%
State:
53%
(% for various income ranges: 44.1% for AGIs below $25k, 57.1% for AGIs $25k-50k, 53.3% for AGIs $50k-75k, 63.6% for AGIs $75k-100k, 72.7% for AGIs $100k-200k)
Averages for the 2004 tax year for zip code 15333, filed in 2005:
Average Adjusted Gross Income (AGI) in 2004: $34,536 (Individual Income Tax Returns)
Here:
$34,536
State:
$48,049
Salary/wage: $33,986 (reported on 81.3% of returns)
Here:
$33,986
State:
$42,646
(% of AGI for various income ranges: 91.9% for AGIs below $10k, 69.8% for AGIs $10k-25k, 78.9% for AGIs $25k-50k, 88.0% for AGIs $50k-75k, 85.0% for AGIs $75k-100k, 68.3% for AGIs over 100k)
Taxable interest for individuals: $1,439 (reported on 46.1% of returns)
This zip code:
$1,439
Pennsylvania:
$1,657
(% of AGI for various income ranges: 8.0% for AGIs below $10k, 5.0% for AGIs $10k-25k, 1.9% for AGIs $25k-50k, 1.2% for AGIs $50k-75k, 0.6% for AGIs $75k-100k, 0.9% for AGIs over 100k)
Taxable dividends: $1,171 (reported on 19.7% of returns)
Here:
$1,171
State:
$3,566
(% of AGI for various income ranges: 2.0% for AGIs below $10k, 1.9% for AGIs $10k-25k, 0.5% for AGIs $25k-50k, 0.3% for AGIs $50k-75k, 0.6% for AGIs $75k-100k, 0.4% for AGIs over 100k)
Net capital gain/loss: +$1,055 (reported on 11.6% of returns)
Here:
+$1,055
State:
+$9,716
(% of AGI for various income ranges: -2.0% for AGIs below $10k, 0.4% for AGIs $10k-25k, 0.0% for AGIs $25k-50k, -0.0% for AGIs $50k-75k, 0.1% for AGIs $75k-100k, 2.4% for AGIs over 100k)
Profit/loss from business: +$3,337 (reported on 9.7% of returns)
Here:
+$3,337
State:
+$14,267
(% of AGI for various income ranges: 5.2% for AGIs below $10k, 3.5% for AGIs $10k-25k, 0.8% for AGIs $25k-50k, 0.2% for AGIs $50k-75k, 0.4% for AGIs $75k-100k)
IRA payment deduction: $1,636 (reported on 1.2% of returns)
15333:
$1,636
Pennsylvania:
$2,903
Total itemized deductions: $14,491 (22% of AGI, reported on 18.5% of returns)
Here:
$14,491
State:
$18,804
Here:
22.1% of AGI
State:
19.5% of AGI
(% of AGI for various income ranges: 5.8% for AGIs $10k-25k, 6.4% for AGIs $25k-50k, 8.5% for AGIs $50k-75k, 9.6% for AGIs $75k-100k, 9.8% for AGIs over 100k)
Charity contributions deductions: $2,049 (3% of AGI, reported on 15.0% of returns)
Here:
$2,049
State:
$3,337
Here:
2.9% of AGI
State:
3.3% of AGI
(% of AGI for various income ranges: 0.2% for AGIs $10k-25k, 0.8% for AGIs $25k-50k, 0.8% for AGIs $50k-75k, 1.5% for AGIs $75k-100k, 1.3% for AGIs over 100k)
Total tax: $4,132 (reported on 69.7% of returns)
15333:
$4,132
State:
$8,008
(% of AGI for various income ranges: 2.4% for AGIs below $10k, 3.8% for AGIs $10k-25k, 6.0% for AGIs $25k-50k, 8.1% for AGIs $50k-75k, 10.2% for AGIs $75k-100k, 16.2% for AGIs over 100k)
Earned income credit: $1,583 (reported on 17.7% of returns)
Here:
$1,583
State:
$1,643
Percentage of individuals using paid preparers for their 2004 taxes: 55.8%
Here:
56%
State:
56%
(% for various income ranges: 53.4% for AGIs below $10k, 54.2% for AGIs $10k-25k, 55.4% for AGIs $25k-50k, 58.2% for AGIs $50k-75k, 57.5% for AGIs $75k-100k, 73.5% for AGIs over 100k)
Household received Food Stamps/SNAP in the past 12 months: 166 Household did not receive Food Stamps/SNAP in the past 12 months: 495
Women who had a birth in the past 12 months: 43 (32 now married, 11 unmarried) Women who did not have a birth in the past 12 months: 321 (154 now married, 165 unmarried)
Housing units in zip code 15333 with a mortgage: 322 (31 second mortgage, 31 both second mortgage and home equity loan) Houses without a mortgage: 14
Median monthly owner costs for units with a mortgage: $1,622 Median monthly owner costs for units without a mortgage: $450
Residents with income below the poverty level in 2022:
This zip code:
20.3%
Whole state:
11.8%
Residents with income below 50% of the poverty level in 2022:
This zip code:
9.0%
Whole state:
6.1%
Median number of rooms in houses and condos:
Here:
7.1
State:
6.8
Median number of rooms in apartments:
Here:
5.7
State:
4.3
Notable locations in this zip code not listed on our city pages
In group quarters: 8 (-1 institutionalized population)
Size of family households: 183 2-persons, 28 3-persons, 117 4-persons, 18 5-persons, 27 6-persons
Size of nonfamily households: 245 1-person, 34 2-persons, 1 4-persons
203 married couples with children.
117 single-parent households (117 women).
98.7% of residents of 15333 zip code speak English at home.
0.5% of residents speak Spanish at home (86% not well, 14% not at all).
0.1% of residents speak other Indo-European language at home (100% well).
Foreign born population: 10 (0.7%) (70.8% of them are naturalized citizens)
This zip code:
0.7%
Whole state:
7.5%
70%Honduras
10%Germany
16%German
15%Irish
14%English
13%Italian
12%Polish
6%American
5%Hungarian
Year of entry for the foreign-born population
132010 or later
142000 to 2009
01990 to 1999
2Before 1990
Facilities with environmental interests located in this zip code:
BETH CTR ELEM JR SR HIGH SCH (194 CRAWFORD ROAD in FREDERICKTOWN, PA)
AIR MINOR (AIRS/AFS) STATE MASTER (Pennsylvania database) - PCS-PA0096571, National Pollutant Discharge Elimination System Permit, AFS-08-5522514-1, AIR PROGRAM National Pollutant Discharge Elimination System NON-MAJOR (Tracking pollutant discharge elimination systems) - permit (Resource Conservation and Recovery Act (tracking hazardous waste)) Business SIC classification: ELEMENTARY AND SECONDARY SCHOOLS Organizations: OPERNAME (CONTACT/OPERATOR)
, COMMONWEALTH OF PA (CONTACT/OWNER)
Alternative names: BETHLEHEM AREA ELEM SCHOOL, BETHLEHEM CENTER SCH DIS SENIOR HIGH, BETHLEHEM CENTER SCH DIST
BETHLEHEM-CENTER ELEMENTARY SCHOOL (194 CRAWFORD RD in FREDERICKTOWN, PA)
(National Center for Education Statistics) - STATE ID-6975 Organizations: BETHLEHEM-CENTER SD (SCHOOL DISTRICT)
BETHLEHEM-CENTER MS (136 CRAWFORD RD in FREDERICKTOWN, PA)
(National Center for Education Statistics) - STATE ID-5267 Organizations: BETHLEHEM-CENTER SD (SCHOOL DISTRICT)
BETHLEHEM-CENTER SHS ( in FREDERICKTOWN, PA)
(National Center for Education Statistics) - STATE ID-4181 Organizations: BETHLEHEM-CENTER SD (SCHOOL DISTRICT)
BCNR CORP/CLYDE MINE (NOT GIVEN in FREDERICKTOWN, PA)
Housing units lacking complete plumbing facilities: 7.2% Housing units lacking complete kitchen facilities: 9.6%
66.7%Utility gas
14.8%Electricity
6.1%Fuel oil, kerosene, etc.
3.9%No fuel used
3.1%Other fuel
2.6%Coal or coke
2.2%Bottled, tank, or LP gas
1.1%Wood
Population in 1990: 770. Population change in the 1990s: +1,620 (+210.4%).
Place of birth for U.S.-born residents:
This state: 1,204
Northeast: 22
Midwest: 130
South: 119
West: 29
82% of the 15333 zip code residents lived in the same house 5 years ago. Out of people who lived in different houses, 71% lived in this county. Out of people who lived in different counties, 50% lived in Pennsylvania.
96% of the 15333 zip code residents lived in the same house 1 year ago. Out of people who lived in different houses, 42% moved from this county. Out of people who lived in different houses, 31% moved from different county within same state. Out of people who lived in different houses, 36% moved from abroad.
Private vs. public school enrollment:
Students in private schools in grades 1 to 8 (elementary and middle school): 9
Here:
8.6%
Pennsylvania:
15.7%
Students in private schools in grades 9 to 12 (high school):
Here:
0.0%
Pennsylvania:
13.4%
Students in private undergraduate colleges: 2
Here:
4.7%
Pennsylvania:
39.8%
Occupation by median earnings in the past 12 months ($)
97,580Health diagnosing and treating practitioners and other technical occupations
93,340Education, training, and library occupations
92,106Management occupations
66,427Production occupations
60,863Building and grounds cleaning and maintenance occupations
60,860Construction and extraction occupations
Top industries in this zip code by the number of employees in 2005:
Health Care and Social Assistance: All Other Outpatient Care Centers (100-249 employees: 1 establishment)
Other Services (except Public Administration): Religious Organizations (10-19: 1, 5-9: 1, 1-4: 1)
Accommodation and Food Services: Full-Service Restaurants (10-19: 1, 5-9: 1)
Construction: Commercial and Institutional Building Construction (10-19: 1)
Professional, Scientific, and Technical Services: Graphic Design Services (10-19: 1)
Finance and Insurance: Savings Institutions (5-9: 1)
Other Services (except Public Administration): Labor Unions and Similar Labor Organizations (5-9: 1)
People in group quarters in 2010:
3 people in group homes intended for adults
People in group quarters in 2000:
8 people in other noninstitutional group quarters
2 people in religious group quarters
Home Mortgage Disclosure Act Aggregated Statistics For Year 2009 (Based on 6 partial tracts)
A) FHA, FSA/RHS & VA Home Purchase Loans
B) Conventional Home Purchase Loans
C) Refinancings
D) Home Improvement Loans
F) Non-occupant Loans on < 5 Family Dwellings (A B C & D)
G) Loans On Manufactured Home Dwelling (A B C & D)
Number
Average Value
Number
Average Value
Number
Average Value
Number
Average Value
Number
Average Value
Number
Average Value
LOANS ORIGINATED
9
$77,129
16
$97,973
66
$105,723
12
$24,405
4
$70,502
2
$56,815
APPLICATIONS APPROVED, NOT ACCEPTED
0
$0
1
$45,100
7
$81,747
3
$12,157
1
$4,110
0
$0
APPLICATIONS DENIED
1
$37,620
5
$95,910
30
$104,114
15
$23,253
1
$42,710
3
$99,610
APPLICATIONS WITHDRAWN
1
$112,650
3
$69,660
22
$98,862
2
$14,450
1
$35,320
1
$115,820
FILES CLOSED FOR INCOMPLETENESS
1
$40,090
0
$0
5
$102,400
1
$89,450
0
$0
0
$0
Aggregated Statistics For Year 2008 (Based on 6 partial tracts)
A) FHA, FSA/RHS & VA Home Purchase Loans
B) Conventional Home Purchase Loans
C) Refinancings
D) Home Improvement Loans
F) Non-occupant Loans on < 5 Family Dwellings (A B C & D)
G) Loans On Manufactured Home Dwelling (A B C & D)
Number
Average Value
Number
Average Value
Number
Average Value
Number
Average Value
Number
Average Value
Number
Average Value
LOANS ORIGINATED
10
$67,010
29
$91,404
38
$90,438
17
$38,124
7
$50,464
4
$86,355
APPLICATIONS APPROVED, NOT ACCEPTED
0
$0
2
$31,740
6
$79,303
5
$36,160
2
$32,855
1
$134,120
APPLICATIONS DENIED
1
$47,640
6
$85,200
59
$84,401
25
$51,634
1
$307,880
6
$71,432
APPLICATIONS WITHDRAWN
2
$72,815
2
$113,415
10
$89,691
1
$23,800
1
$97,720
0
$0
FILES CLOSED FOR INCOMPLETENESS
0
$0
0
$0
4
$129,415
1
$30,990
0
$0
0
$0
Aggregated Statistics For Year 2007 (Based on 6 partial tracts)
A) FHA, FSA/RHS & VA Home Purchase Loans
B) Conventional Home Purchase Loans
C) Refinancings
D) Home Improvement Loans
F) Non-occupant Loans on < 5 Family Dwellings (A B C & D)
G) Loans On Manufactured Home Dwelling (A B C & D)
Number
Average Value
Number
Average Value
Number
Average Value
Number
Average Value
Number
Average Value
Number
Average Value
LOANS ORIGINATED
8
$78,351
39
$70,501
65
$73,954
26
$41,004
10
$69,309
4
$51,168
APPLICATIONS APPROVED, NOT ACCEPTED
0
$0
2
$112,775
23
$89,698
3
$23,373
2
$48,750
0
$0
APPLICATIONS DENIED
2
$84,755
10
$72,712
93
$87,170
36
$38,081
1
$143,450
8
$62,139
APPLICATIONS WITHDRAWN
2
$83,440
7
$48,753
23
$82,950
4
$35,392
1
$67,630
1
$57,630
FILES CLOSED FOR INCOMPLETENESS
0
$0
1
$47,640
5
$107,252
0
$0
0
$0
0
$0
Aggregated Statistics For Year 2006 (Based on 6 partial tracts)
A) FHA, FSA/RHS & VA Home Purchase Loans
B) Conventional Home Purchase Loans
C) Refinancings
D) Home Improvement Loans
F) Non-occupant Loans on < 5 Family Dwellings (A B C & D)
G) Loans On Manufactured Home Dwelling (A B C & D)
Number
Average Value
Number
Average Value
Number
Average Value
Number
Average Value
Number
Average Value
Number
Average Value
LOANS ORIGINATED
4
$90,330
51
$85,740
88
$76,005
23
$34,336
9
$44,202
5
$61,102
APPLICATIONS APPROVED, NOT ACCEPTED
0
$0
3
$108,537
27
$70,743
5
$51,836
0
$0
0
$0
APPLICATIONS DENIED
1
$130,290
19
$65,831
96
$85,732
29
$41,208
1
$80,460
8
$80,548
APPLICATIONS WITHDRAWN
1
$61,390
4
$61,432
32
$94,084
2
$30,015
1
$27,980
0
$0
FILES CLOSED FOR INCOMPLETENESS
0
$0
0
$0
10
$76,340
0
$0
0
$0
0
$0
Aggregated Statistics For Year 2005 (Based on 6 partial tracts)
A) FHA, FSA/RHS & VA Home Purchase Loans
B) Conventional Home Purchase Loans
C) Refinancings
D) Home Improvement Loans
F) Non-occupant Loans on < 5 Family Dwellings (A B C & D)
G) Loans On Manufactured Home Dwelling (A B C & D)
Number
Average Value
Number
Average Value
Number
Average Value
Number
Average Value
Number
Average Value
Number
Average Value
LOANS ORIGINATED
6
$70,135
43
$70,578
86
$69,177
23
$38,671
11
$56,886
4
$54,255
APPLICATIONS APPROVED, NOT ACCEPTED
0
$0
4
$54,508
26
$71,515
5
$33,296
3
$48,907
1
$62,270
APPLICATIONS DENIED
0
$0
21
$58,572
120
$72,195
39
$35,520
3
$44,880
7
$86,197
APPLICATIONS WITHDRAWN
0
$0
8
$69,924
36
$87,444
5
$165,678
3
$91,927
0
$0
FILES CLOSED FOR INCOMPLETENESS
0
$0
3
$62,957
12
$79,165
1
$20,040
0
$0
0
$0
Aggregated Statistics For Year 2004 (Based on 6 partial tracts)
A) FHA, FSA/RHS & VA Home Purchase Loans
B) Conventional Home Purchase Loans
C) Refinancings
D) Home Improvement Loans
F) Non-occupant Loans on < 5 Family Dwellings (A B C & D)
G) Loans On Manufactured Home Dwelling (A B C & D)
Number
Average Value
Number
Average Value
Number
Average Value
Number
Average Value
Number
Average Value
Number
Average Value
LOANS ORIGINATED
9
$59,229
40
$67,572
98
$69,153
36
$29,554
7
$48,163
7
$70,370
APPLICATIONS APPROVED, NOT ACCEPTED
0
$0
10
$60,260
24
$86,300
9
$22,066
1
$19,230
2
$50,160
APPLICATIONS DENIED
2
$90,020
15
$50,230
116
$71,462
34
$29,965
8
$36,639
7
$57,826
APPLICATIONS WITHDRAWN
0
$0
6
$78,997
60
$71,038
7
$28,484
2
$67,145
3
$67,943
FILES CLOSED FOR INCOMPLETENESS
0
$0
2
$79,190
14
$100,051
2
$52,380
0
$0
0
$0
Aggregated Statistics For Year 2003 (Based on 6 partial tracts)
A) FHA, FSA/RHS & VA Home Purchase Loans
B) Conventional Home Purchase Loans
C) Refinancings
D) Home Improvement Loans
F) Non-occupant Loans on < 5 Family Dwellings (A B C & D)
Number
Average Value
Number
Average Value
Number
Average Value
Number
Average Value
Number
Average Value
LOANS ORIGINATED
3
$85,150
36
$64,836
173
$70,744
21
$27,536
6
$38,327
APPLICATIONS APPROVED, NOT ACCEPTED
0
$0
2
$65,405
35
$70,006
7
$22,347
5
$88,776
APPLICATIONS DENIED
1
$81,430
10
$38,183
144
$66,984
29
$29,463
7
$29,706
APPLICATIONS WITHDRAWN
0
$0
5
$57,166
56
$77,205
1
$5,550
1
$54,210
FILES CLOSED FOR INCOMPLETENESS
0
$0
1
$35,330
8
$67,094
1
$42,460
1
$45,180
Aggregated Statistics For Year 2002 (Based on 6 partial tracts)
A) FHA, FSA/RHS & VA Home Purchase Loans
B) Conventional Home Purchase Loans
C) Refinancings
D) Home Improvement Loans
F) Non-occupant Loans on < 5 Family Dwellings (A B C & D)
Number
Average Value
Number
Average Value
Number
Average Value
Number
Average Value
Number
Average Value
LOANS ORIGINATED
6
$68,637
37
$63,280
132
$69,742
22
$22,587
4
$39,635
APPLICATIONS APPROVED, NOT ACCEPTED
0
$0
5
$66,212
29
$69,558
7
$23,894
1
$50,980
APPLICATIONS DENIED
0
$0
12
$43,599
104
$61,787
24
$23,833
2
$79,235
APPLICATIONS WITHDRAWN
2
$26,695
4
$38,528
59
$62,916
4
$26,328
0
$0
FILES CLOSED FOR INCOMPLETENESS
0
$0
4
$49,852
11
$75,017
0
$0
0
$0
Aggregated Statistics For Year 2001 (Based on 6 partial tracts)
A) FHA, FSA/RHS & VA Home Purchase Loans
B) Conventional Home Purchase Loans
C) Refinancings
D) Home Improvement Loans
F) Non-occupant Loans on < 5 Family Dwellings (A B C & D)
Number
Average Value
Number
Average Value
Number
Average Value
Number
Average Value
Number
Average Value
LOANS ORIGINATED
9
$47,472
46
$51,517
133
$59,927
33
$23,729
4
$71,158
APPLICATIONS APPROVED, NOT ACCEPTED
1
$39,810
8
$52,956
54
$56,523
17
$31,346
0
$0
APPLICATIONS DENIED
2
$50,930
25
$48,947
131
$54,505
35
$19,521
3
$51,203
APPLICATIONS WITHDRAWN
1
$33,680
3
$29,700
48
$55,702
6
$13,752
0
$0
FILES CLOSED FOR INCOMPLETENESS
2
$56,265
0
$0
10
$48,752
0
$0
0
$0
Aggregated Statistics For Year 2000 (Based on 6 partial tracts)
A) FHA, FSA/RHS & VA Home Purchase Loans
B) Conventional Home Purchase Loans
C) Refinancings
D) Home Improvement Loans
F) Non-occupant Loans on < 5 Family Dwellings (A B C & D)
Number
Average Value
Number
Average Value
Number
Average Value
Number
Average Value
Number
Average Value
LOANS ORIGINATED
5
$59,086
36
$68,074
65
$54,534
31
$19,226
4
$42,822
APPLICATIONS APPROVED, NOT ACCEPTED
0
$0
8
$70,792
35
$50,667
14
$19,329
1
$38,840
APPLICATIONS DENIED
0
$0
19
$60,021
88
$53,928
35
$15,036
3
$82,143
APPLICATIONS WITHDRAWN
1
$55,860
4
$63,042
28
$64,158
7
$35,711
0
$0
FILES CLOSED FOR INCOMPLETENESS
1
$18,790
1
$52,160
7
$39,306
2
$14,375
0
$0
Aggregated Statistics For Year 1999 (Based on 3 partial tracts)
A) FHA, FSA/RHS & VA Home Purchase Loans
B) Conventional Home Purchase Loans
C) Refinancings
D) Home Improvement Loans
F) Non-occupant Loans on < 5 Family Dwellings (A B C & D)


 Nearest zip codes: 15358, 15368, 15313, 15348, 15450, 15427.


