Estimated zip code population in 2022: 12,272
Zip code population in 2010: 12,268
Zip code population in 2000: 12,362
Houses and condos: 6,853
Renter-occupied apartments: 4,600
% of renters here:
78%State:
46%
March 2022 cost of living index in zip code 14608: 104.5
(near average, U.S. average is 100)
Land area: 1.7
sq. mi.
Water area: 0.1
sq. mi.
Population density: 7,016 people per square mile (high).
OSM Map
General Map
Google Map
MSN Map
OSM Map
General Map
Google Map
MSN Map
OSM Map
General Map
Google Map
MSN Map
OSM Map
General Map
Google Map
MSN Map
Please wait while loading the map...
Real estate property taxes paid for housing units in 2022:
This zip code:
2.3% ($3,873)New York:
1.5% ($6,180)
Median real estate property taxes paid for housing units with mortgages in 2022: $4,126 (2.9%)
Profiles of local businesses
Business Search - 14 Million verified businesses
Males: 5,984 Females: 6,287
For population 25 years and over in 14608:
High school or higher: 82.3%Bachelor's degree or higher: 25.4%Graduate or professional degree: 10.9%Unemployed: 10.9%Mean travel time to work (commute): 21.6 minutes
For population 15 years and over in 14608:
Never married: 57.3%Now married: 24.8%Separated: 3.8%Widowed: 3.4%Divorced: 10.7%
Zip code 14608 compared to state average:
Median household income significantly below state average. Median house value significantly below state average. Unemployed percentage above state average. Black race population percentage significantly above state average. Median age below state average. Foreign-born population percentage below state average. Renting percentage above state average. Percentage of population with a bachelor's degree or higher below state average. 6,030 49.2% Black 3,200 26.1% White 1,420 11.6% Hispanic or Latino 1,064 8.7% Two or more races 510 4.2% Asian 38 0.3% American Indian 6 0.05% Native Hawaiian and Other
Data:
Median household income ($)
Median household income (% change since 2000)
Household income diversity
Ratio of average income to average house value (%)
Ratio of average income to average rent
Median household income ($) - White
Median household income ($) - Black or African American
Median household income ($) - Asian
Median household income ($) - Hispanic or Latino
Median household income ($) - American Indian and Alaska Native
Median household income ($) - Multirace
Median household income ($) - Other Race
Median household income for houses/condos with a mortgage ($)
Median household income for apartments without a mortgage ($)
Races - White alone (%)
Races - White alone (% change since 2000)
Races - Black alone (%)
Races - Black alone (% change since 2000)
Races - American Indian alone (%)
Races - American Indian alone (% change since 2000)
Races - Asian alone (%)
Races - Asian alone (% change since 2000)
Races - Hispanic (%)
Races - Hispanic (% change since 2000)
Races - Native Hawaiian and Other Pacific Islander alone (%)
Races - Native Hawaiian and Other Pacific Islander alone (% change since 2000)
Races - Two or more races (%)
Races - Two or more races (% change since 2000)
Races - Other race alone (%)
Races - Other race alone (% change since 2000)
Racial diversity
Unemployment (%)
Unemployment (% change since 2000)
Unemployment (%) - White
Unemployment (%) - Black or African American
Unemployment (%) - Asian
Unemployment (%) - Hispanic or Latino
Unemployment (%) - American Indian and Alaska Native
Unemployment (%) - Multirace
Unemployment (%) - Other Race
Population density (people per square mile)
Population - Males (%)
Population - Females (%)
Population - Males (%) - White
Population - Males (%) - Black or African American
Population - Males (%) - Asian
Population - Males (%) - Hispanic or Latino
Population - Males (%) - American Indian and Alaska Native
Population - Males (%) - Multirace
Population - Males (%) - Other Race
Population - Females (%) - White
Population - Females (%) - Black or African American
Population - Females (%) - Asian
Population - Females (%) - Hispanic or Latino
Population - Females (%) - American Indian and Alaska Native
Population - Females (%) - Multirace
Population - Females (%) - Other Race
Coronavirus confirmed cases (Jun 30, 2024)
Deaths caused by coronavirus (Jun 30, 2024)
Coronavirus confirmed cases (per 100k population) (Jun 30, 2024)
Deaths caused by coronavirus (per 100k population) (Jun 30, 2024)
Daily increase in number of cases (Jun 30, 2024)
Weekly increase in number of cases (Jun 30, 2024)
Cases doubled (in days) (Jun 30, 2024)
Hospitalized patients (Apr 18, 2022)
Negative test results (Apr 18, 2022)
Total test results (Apr 18, 2022)
COVID Vaccine doses distributed (per 100k population) (Sep 19, 2023)
COVID Vaccine doses administered (per 100k population) (Sep 19, 2023)
COVID Vaccine doses distributed (Sep 19, 2023)
COVID Vaccine doses administered (Sep 19, 2023)
Likely homosexual households (%)
Likely homosexual households (% change since 2000)
Likely homosexual households - Lesbian couples (%)
Likely homosexual households - Lesbian couples (% change since 2000)
Likely homosexual households - Gay men (%)
Likely homosexual households - Gay men (% change since 2000)
Cost of living index
Median gross rent ($)
Median contract rent ($)
Median monthly housing costs ($)
Median house or condo value ($)
Median house or condo value ($ change since 2000)
Mean house or condo value by units in structure - 1, detached ($)
Mean house or condo value by units in structure - 1, attached ($)
Mean house or condo value by units in structure - 2 ($)
Mean house or condo value by units in structure by units in structure - 3 or 4 ($)
Mean house or condo value by units in structure - 5 or more ($)
Mean house or condo value by units in structure - Boat, RV, van, etc. ($)
Mean house or condo value by units in structure - Mobile home ($)
Median house or condo value ($) - White
Median house or condo value ($) - Black or African American
Median house or condo value ($) - Asian
Median house or condo value ($) - Hispanic or Latino
Median house or condo value ($) - American Indian and Alaska Native
Median house or condo value ($) - Multirace
Median house or condo value ($) - Other Race
Median resident age
Resident age diversity
Median resident age - Males
Median resident age - Females
Median resident age - White
Median resident age - Black or African American
Median resident age - Asian
Median resident age - Hispanic or Latino
Median resident age - American Indian and Alaska Native
Median resident age - Multirace
Median resident age - Other Race
Median resident age - Males - White
Median resident age - Males - Black or African American
Median resident age - Males - Asian
Median resident age - Males - Hispanic or Latino
Median resident age - Males - American Indian and Alaska Native
Median resident age - Males - Multirace
Median resident age - Males - Other Race
Median resident age - Females - White
Median resident age - Females - Black or African American
Median resident age - Females - Asian
Median resident age - Females - Hispanic or Latino
Median resident age - Females - American Indian and Alaska Native
Median resident age - Females - Multirace
Median resident age - Females - Other Race
Commute - mean travel time to work (minutes)
Travel time to work - Less than 5 minutes (%)
Travel time to work - Less than 5 minutes (% change since 2000)
Travel time to work - 5 to 9 minutes (%)
Travel time to work - 5 to 9 minutes (% change since 2000)
Travel time to work - 10 to 19 minutes (%)
Travel time to work - 10 to 19 minutes (% change since 2000)
Travel time to work - 20 to 29 minutes (%)
Travel time to work - 20 to 29 minutes (% change since 2000)
Travel time to work - 30 to 39 minutes (%)
Travel time to work - 30 to 39 minutes (% change since 2000)
Travel time to work - 40 to 59 minutes (%)
Travel time to work - 40 to 59 minutes (% change since 2000)
Travel time to work - 60 to 89 minutes (%)
Travel time to work - 60 to 89 minutes (% change since 2000)
Travel time to work - 90 or more minutes (%)
Travel time to work - 90 or more minutes (% change since 2000)
Marital status - Never married (%)
Marital status - Now married (%)
Marital status - Separated (%)
Marital status - Widowed (%)
Marital status - Divorced (%)
Median family income ($)
Median family income (% change since 2000)
Median non-family income ($)
Median non-family income (% change since 2000)
Median per capita income ($)
Median per capita income (% change since 2000)
Median family income ($) - White
Median family income ($) - Black or African American
Median family income ($) - Asian
Median family income ($) - Hispanic or Latino
Median family income ($) - American Indian and Alaska Native
Median family income ($) - Multirace
Median family income ($) - Other Race
Median year house/condo built
Median year apartment built
Year house built - Built 2005 or later (%)
Year house built - Built 2000 to 2004 (%)
Year house built - Built 1990 to 1999 (%)
Year house built - Built 1980 to 1989 (%)
Year house built - Built 1970 to 1979 (%)
Year house built - Built 1960 to 1969 (%)
Year house built - Built 1950 to 1959 (%)
Year house built - Built 1940 to 1949 (%)
Year house built - Built 1939 or earlier (%)
Average household size
Household density (households per square mile)
Average household size - White
Average household size - Black or African American
Average household size - Asian
Average household size - Hispanic or Latino
Average household size - American Indian and Alaska Native
Average household size - Multirace
Average household size - Other Race
Occupied housing units (%)
Vacant housing units (%)
Owner occupied housing units (%)
Renter occupied housing units (%)
Vacancy status - For rent (%)
Vacancy status - For sale only (%)
Vacancy status - Rented or sold, not occupied (%)
Vacancy status - For seasonal, recreational, or occasional use (%)
Vacancy status - For migrant workers (%)
Vacancy status - Other vacant (%)
Residents with income below the poverty level (%)
Residents with income below 50% of the poverty level (%)
Children below poverty level (%)
Poor families by family type - Married-couple family (%)
Poor families by family type - Male, no wife present (%)
Poor families by family type - Female, no husband present (%)
Poverty status for native-born residents (%)
Poverty status for foreign-born residents (%)
Poverty among high school graduates not in families (%)
Poverty among people who did not graduate high school not in families (%)
Residents with income below the poverty level (%) - White
Residents with income below the poverty level (%) - Black or African American
Residents with income below the poverty level (%) - Asian
Residents with income below the poverty level (%) - Hispanic or Latino
Residents with income below the poverty level (%) - American Indian and Alaska Native
Residents with income below the poverty level (%) - Multirace
Residents with income below the poverty level (%) - Other Race
Air pollution - Air Quality Index (AQI)
Air pollution - CO
Air pollution - NO2
Air pollution - SO2
Air pollution - Ozone
Air pollution - PM10
Air pollution - PM25
Air pollution - Pb
Crime - Murders per 100,000 population
Crime - Rapes per 100,000 population
Crime - Robberies per 100,000 population
Crime - Assaults per 100,000 population
Crime - Burglaries per 100,000 population
Crime - Thefts per 100,000 population
Crime - Auto thefts per 100,000 population
Crime - Arson per 100,000 population
Crime - City-data.com crime index
Crime - Violent crime index
Crime - Property crime index
Crime - Murders per 100,000 population (5 year average)
Crime - Rapes per 100,000 population (5 year average)
Crime - Robberies per 100,000 population (5 year average)
Crime - Assaults per 100,000 population (5 year average)
Crime - Burglaries per 100,000 population (5 year average)
Crime - Thefts per 100,000 population (5 year average)
Crime - Auto thefts per 100,000 population (5 year average)
Crime - Arson per 100,000 population (5 year average)
Crime - City-data.com crime index (5 year average)
Crime - Violent crime index (5 year average)
Crime - Property crime index (5 year average)
1996 Presidential Elections Results (%) - Democratic Party (Clinton)
1996 Presidential Elections Results (%) - Republican Party (Dole)
1996 Presidential Elections Results (%) - Other
2000 Presidential Elections Results (%) - Democratic Party (Gore)
2000 Presidential Elections Results (%) - Republican Party (Bush)
2000 Presidential Elections Results (%) - Other
2004 Presidential Elections Results (%) - Democratic Party (Kerry)
2004 Presidential Elections Results (%) - Republican Party (Bush)
2004 Presidential Elections Results (%) - Other
2008 Presidential Elections Results (%) - Democratic Party (Obama)
2008 Presidential Elections Results (%) - Republican Party (McCain)
2008 Presidential Elections Results (%) - Other
2012 Presidential Elections Results (%) - Democratic Party (Obama)
2012 Presidential Elections Results (%) - Republican Party (Romney)
2012 Presidential Elections Results (%) - Other
2016 Presidential Elections Results (%) - Democratic Party (Clinton)
2016 Presidential Elections Results (%) - Republican Party (Trump)
2016 Presidential Elections Results (%) - Other
2020 Presidential Elections Results (%) - Democratic Party (Biden)
2020 Presidential Elections Results (%) - Republican Party (Trump)
2020 Presidential Elections Results (%) - Other
Ancestries Reported - Arab (%)
Ancestries Reported - Czech (%)
Ancestries Reported - Danish (%)
Ancestries Reported - Dutch (%)
Ancestries Reported - English (%)
Ancestries Reported - French (%)
Ancestries Reported - French Canadian (%)
Ancestries Reported - German (%)
Ancestries Reported - Greek (%)
Ancestries Reported - Hungarian (%)
Ancestries Reported - Irish (%)
Ancestries Reported - Italian (%)
Ancestries Reported - Lithuanian (%)
Ancestries Reported - Norwegian (%)
Ancestries Reported - Polish (%)
Ancestries Reported - Portuguese (%)
Ancestries Reported - Russian (%)
Ancestries Reported - Scotch-Irish (%)
Ancestries Reported - Scottish (%)
Ancestries Reported - Slovak (%)
Ancestries Reported - Subsaharan African (%)
Ancestries Reported - Swedish (%)
Ancestries Reported - Swiss (%)
Ancestries Reported - Ukrainian (%)
Ancestries Reported - United States (%)
Ancestries Reported - Welsh (%)
Ancestries Reported - West Indian (%)
Ancestries Reported - Other (%)
Educational Attainment - No schooling completed (%)
Educational Attainment - Less than high school (%)
Educational Attainment - High school or equivalent (%)
Educational Attainment - Less than 1 year of college (%)
Educational Attainment - 1 or more years of college (%)
Educational Attainment - Associate degree (%)
Educational Attainment - Bachelor's degree (%)
Educational Attainment - Master's degree (%)
Educational Attainment - Professional school degree (%)
Educational Attainment - Doctorate degree (%)
School Enrollment - Nursery, preschool (%)
School Enrollment - Kindergarten (%)
School Enrollment - Grade 1 to 4 (%)
School Enrollment - Grade 5 to 8 (%)
School Enrollment - Grade 9 to 12 (%)
School Enrollment - College undergrad (%)
School Enrollment - Graduate or professional (%)
School Enrollment - Not enrolled in school (%)
School enrollment - Public schools (%)
School enrollment - Private schools (%)
School enrollment - Not enrolled (%)
Median number of rooms in houses and condos
Median number of rooms in apartments
Housing units lacking complete plumbing facilities (%)
Housing units lacking complete kitchen facilities (%)
Density of houses
Urban houses (%)
Rural houses (%)
Households with people 60 years and over (%)
Households with people 65 years and over (%)
Households with people 75 years and over (%)
Households with one or more nonrelatives (%)
Households with no nonrelatives (%)
Population in households (%)
Family households (%)
Nonfamily households (%)
Population in families (%)
Family households with own children (%)
Median number of bedrooms in owner occupied houses
Mean number of bedrooms in owner occupied houses
Median number of bedrooms in renter occupied houses
Mean number of bedrooms in renter occupied houses
Median number of vehichles in owner occupied houses
Mean number of vehichles in owner occupied houses
Median number of vehichles in renter occupied houses
Mean number of vehichles in renter occupied houses
Mortgage status - with mortgage (%)
Mortgage status - with second mortgage (%)
Mortgage status - with home equity loan (%)
Mortgage status - with both second mortgage and home equity loan (%)
Mortgage status - without a mortgage (%)
Average family size
Average family size - White
Average family size - Black or African American
Average family size - Asian
Average family size - Hispanic or Latino
Average family size - American Indian and Alaska Native
Average family size - Multirace
Average family size - Other Race
Geographical mobility - Same house 1 year ago (%)
Geographical mobility - Moved within same county (%)
Geographical mobility - Moved from different county within same state (%)
Geographical mobility - Moved from different state (%)
Geographical mobility - Moved from abroad (%)
Place of birth - Born in state of residence (%)
Place of birth - Born in other state (%)
Place of birth - Native, outside of US (%)
Place of birth - Foreign born (%)
Housing units in structures - 1, detached (%)
Housing units in structures - 1, attached (%)
Housing units in structures - 2 (%)
Housing units in structures - 3 or 4 (%)
Housing units in structures - 5 to 9 (%)
Housing units in structures - 10 to 19 (%)
Housing units in structures - 20 to 49 (%)
Housing units in structures - 50 or more (%)
Housing units in structures - Mobile home (%)
Housing units in structures - Boat, RV, van, etc. (%)
House/condo owner moved in on average (years ago)
Renter moved in on average (years ago)
Year householder moved into unit - Moved in 1999 to March 2000 (%)
Year householder moved into unit - Moved in 1995 to 1998 (%)
Year householder moved into unit - Moved in 1990 to 1994 (%)
Year householder moved into unit - Moved in 1980 to 1989 (%)
Year householder moved into unit - Moved in 1970 to 1979 (%)
Year householder moved into unit - Moved in 1969 or earlier (%)
Means of transportation to work - Drove car alone (%)
Means of transportation to work - Carpooled (%)
Means of transportation to work - Public transportation (%)
Means of transportation to work - Bus or trolley bus (%)
Means of transportation to work - Streetcar or trolley car (%)
Means of transportation to work - Subway or elevated (%)
Means of transportation to work - Railroad (%)
Means of transportation to work - Ferryboat (%)
Means of transportation to work - Taxicab (%)
Means of transportation to work - Motorcycle (%)
Means of transportation to work - Bicycle (%)
Means of transportation to work - Walked (%)
Means of transportation to work - Other means (%)
Working at home (%)
Industry diversity
Most Common Industries - Agriculture, forestry, fishing and hunting, and mining (%)
Most Common Industries - Agriculture, forestry, fishing and hunting (%)
Most Common Industries - Mining, quarrying, and oil and gas extraction (%)
Most Common Industries - Construction (%)
Most Common Industries - Manufacturing (%)
Most Common Industries - Wholesale trade (%)
Most Common Industries - Retail trade (%)
Most Common Industries - Transportation and warehousing, and utilities (%)
Most Common Industries - Transportation and warehousing (%)
Most Common Industries - Utilities (%)
Most Common Industries - Information (%)
Most Common Industries - Finance and insurance, and real estate and rental and leasing (%)
Most Common Industries - Finance and insurance (%)
Most Common Industries - Real estate and rental and leasing (%)
Most Common Industries - Professional, scientific, and management, and administrative and waste management services (%)
Most Common Industries - Professional, scientific, and technical services (%)
Most Common Industries - Management of companies and enterprises (%)
Most Common Industries - Administrative and support and waste management services (%)
Most Common Industries - Educational services, and health care and social assistance (%)
Most Common Industries - Educational services (%)
Most Common Industries - Health care and social assistance (%)
Most Common Industries - Arts, entertainment, and recreation, and accommodation and food services (%)
Most Common Industries - Arts, entertainment, and recreation (%)
Most Common Industries - Accommodation and food services (%)
Most Common Industries - Other services, except public administration (%)
Most Common Industries - Public administration (%)
Occupation diversity
Most Common Occupations - Management, business, science, and arts occupations (%)
Most Common Occupations - Management, business, and financial occupations (%)
Most Common Occupations - Management occupations (%)
Most Common Occupations - Business and financial operations occupations (%)
Most Common Occupations - Computer, engineering, and science occupations (%)
Most Common Occupations - Computer and mathematical occupations (%)
Most Common Occupations - Architecture and engineering occupations (%)
Most Common Occupations - Life, physical, and social science occupations (%)
Most Common Occupations - Education, legal, community service, arts, and media occupations (%)
Most Common Occupations - Community and social service occupations (%)
Most Common Occupations - Legal occupations (%)
Most Common Occupations - Education, training, and library occupations (%)
Most Common Occupations - Arts, design, entertainment, sports, and media occupations (%)
Most Common Occupations - Healthcare practitioners and technical occupations (%)
Most Common Occupations - Health diagnosing and treating practitioners and other technical occupations (%)
Most Common Occupations - Health technologists and technicians (%)
Most Common Occupations - Service occupations (%)
Most Common Occupations - Healthcare support occupations (%)
Most Common Occupations - Protective service occupations (%)
Most Common Occupations - Fire fighting and prevention, and other protective service workers including supervisors (%)
Most Common Occupations - Law enforcement workers including supervisors (%)
Most Common Occupations - Food preparation and serving related occupations (%)
Most Common Occupations - Building and grounds cleaning and maintenance occupations (%)
Most Common Occupations - Personal care and service occupations (%)
Most Common Occupations - Sales and office occupations (%)
Most Common Occupations - Sales and related occupations (%)
Most Common Occupations - Office and administrative support occupations (%)
Most Common Occupations - Natural resources, construction, and maintenance occupations (%)
Most Common Occupations - Farming, fishing, and forestry occupations (%)
Most Common Occupations - Construction and extraction occupations (%)
Most Common Occupations - Installation, maintenance, and repair occupations (%)
Most Common Occupations - Production, transportation, and material moving occupations (%)
Most Common Occupations - Production occupations (%)
Most Common Occupations - Transportation occupations (%)
Most Common Occupations - Material moving occupations (%)
People in Group quarters - Institutionalized population (%)
People in Group quarters - Correctional institutions (%)
People in Group quarters - Federal prisons and detention centers (%)
People in Group quarters - Halfway houses (%)
People in Group quarters - Local jails and other confinement facilities (including police lockups) (%)
People in Group quarters - Military disciplinary barracks (%)
People in Group quarters - State prisons (%)
People in Group quarters - Other types of correctional institutions (%)
People in Group quarters - Nursing homes (%)
People in Group quarters - Hospitals/wards, hospices, and schools for the handicapped (%)
People in Group quarters - Hospitals/wards and hospices for chronically ill (%)
People in Group quarters - Hospices or homes for chronically ill (%)
People in Group quarters - Military hospitals or wards for chronically ill (%)
People in Group quarters - Other hospitals or wards for chronically ill (%)
People in Group quarters - Hospitals or wards for drug/alcohol abuse (%)
People in Group quarters - Mental (Psychiatric) hospitals or wards (%)
People in Group quarters - Schools, hospitals, or wards for the mentally retarded (%)
People in Group quarters - Schools, hospitals, or wards for the physically handicapped (%)
People in Group quarters - Institutions for the deaf (%)
People in Group quarters - Institutions for the blind (%)
People in Group quarters - Orthopedic wards and institutions for the physically handicapped (%)
People in Group quarters - Wards in general hospitals for patients who have no usual home elsewhere (%)
People in Group quarters - Wards in military hospitals for patients who have no usual home elsewhere (%)
People in Group quarters - Juvenile institutions (%)
People in Group quarters - Long-term care (%)
People in Group quarters - Homes for abused, dependent, and neglected children (%)
People in Group quarters - Residential treatment centers for emotionally disturbed children (%)
People in Group quarters - Training schools for juvenile delinquents (%)
People in Group quarters - Short-term care, detention or diagnostic centers for delinquent children (%)
People in Group quarters - Type of juvenile institution unknown (%)
People in Group quarters - Noninstitutionalized population (%)
People in Group quarters - College dormitories (includes college quarters off campus) (%)
People in Group quarters - Military quarters (%)
People in Group quarters - On base (%)
People in Group quarters - Barracks, unaccompanied personnel housing (UPH), (Enlisted/Officer), ;and similar group living quarters for military personnel (%)
People in Group quarters - Transient quarters for temporary residents (%)
People in Group quarters - Military ships (%)
People in Group quarters - Group homes (%)
People in Group quarters - Homes or halfway houses for drug/alcohol abuse (%)
People in Group quarters - Homes for the mentally ill (%)
People in Group quarters - Homes for the mentally retarded (%)
People in Group quarters - Homes for the physically handicapped (%)
People in Group quarters - Other group homes (%)
People in Group quarters - Religious group quarters (%)
People in Group quarters - Dormitories (%)
People in Group quarters - Agriculture workers' dormitories on farms (%)
People in Group quarters - Job Corps and vocational training facilities (%)
People in Group quarters - Other workers' dormitories (%)
People in Group quarters - Crews of maritime vessels (%)
People in Group quarters - Other nonhousehold living situations (%)
People in Group quarters - Other noninstitutional group quarters (%)
Residents speaking English at home (%)
Residents speaking English at home - Born in the United States (%)
Residents speaking English at home - Native, born elsewhere (%)
Residents speaking English at home - Foreign born (%)
Residents speaking Spanish at home (%)
Residents speaking Spanish at home - Born in the United States (%)
Residents speaking Spanish at home - Native, born elsewhere (%)
Residents speaking Spanish at home - Foreign born (%)
Residents speaking other language at home (%)
Residents speaking other language at home - Born in the United States (%)
Residents speaking other language at home - Native, born elsewhere (%)
Residents speaking other language at home - Foreign born (%)
Class of Workers - Employee of private company (%)
Class of Workers - Self-employed in own incorporated business (%)
Class of Workers - Private not-for-profit wage and salary workers (%)
Class of Workers - Local government workers (%)
Class of Workers - State government workers (%)
Class of Workers - Federal government workers (%)
Class of Workers - Self-employed workers in own not incorporated business and Unpaid family workers (%)
House heating fuel used in houses and condos - Utility gas (%)
House heating fuel used in houses and condos - Bottled, tank, or LP gas (%)
House heating fuel used in houses and condos - Electricity (%)
House heating fuel used in houses and condos - Fuel oil, kerosene, etc. (%)
House heating fuel used in houses and condos - Coal or coke (%)
House heating fuel used in houses and condos - Wood (%)
House heating fuel used in houses and condos - Solar energy (%)
House heating fuel used in houses and condos - Other fuel (%)
House heating fuel used in houses and condos - No fuel used (%)
House heating fuel used in apartments - Utility gas (%)
House heating fuel used in apartments - Bottled, tank, or LP gas (%)
House heating fuel used in apartments - Electricity (%)
House heating fuel used in apartments - Fuel oil, kerosene, etc. (%)
House heating fuel used in apartments - Coal or coke (%)
House heating fuel used in apartments - Wood (%)
House heating fuel used in apartments - Solar energy (%)
House heating fuel used in apartments - Other fuel (%)
House heating fuel used in apartments - No fuel used (%)
Armed forces status - In Armed Forces (%)
Armed forces status - Civilian (%)
Armed forces status - Civilian - Veteran (%)
Armed forces status - Civilian - Nonveteran (%)
Fatal accidents locations in years 2005-2021
Fatal accidents locations in 2005
Fatal accidents locations in 2006
Fatal accidents locations in 2007
Fatal accidents locations in 2008
Fatal accidents locations in 2009
Fatal accidents locations in 2010
Fatal accidents locations in 2011
Fatal accidents locations in 2012
Fatal accidents locations in 2013
Fatal accidents locations in 2014
Fatal accidents locations in 2015
Fatal accidents locations in 2016
Fatal accidents locations in 2017
Fatal accidents locations in 2018
Fatal accidents locations in 2019
Fatal accidents locations in 2020
Fatal accidents locations in 2021
Alcohol use - People drinking some alcohol every month (%)
Alcohol use - People not drinking at all (%)
Alcohol use - Average days/month drinking alcohol
Alcohol use - Average drinks/week
Alcohol use - Average days/year people drink much
Audiometry - Average condition of hearing (%)
Audiometry - People that can hear a whisper from across a quiet room (%)
Audiometry - People that can hear normal voice from across a quiet room (%)
Audiometry - Ears ringing, roaring, buzzing (%)
Audiometry - Had a job exposure to loud noise (%)
Audiometry - Had off-work exposure to loud noise (%)
Blood Pressure & Cholesterol - Has high blood pressure (%)
Blood Pressure & Cholesterol - Checking blood pressure at home (%)
Blood Pressure & Cholesterol - Frequently checking blood cholesterol (%)
Blood Pressure & Cholesterol - Has high cholesterol level (%)
Consumer Behavior - Money monthly spent on food at supermarket/grocery store
Consumer Behavior - Money monthly spent on food at other stores
Consumer Behavior - Money monthly spent on eating out
Consumer Behavior - Money monthly spent on carryout/delivered foods
Consumer Behavior - Income spent on food at supermarket/grocery store (%)
Consumer Behavior - Income spent on food at other stores (%)
Consumer Behavior - Income spent on eating out (%)
Consumer Behavior - Income spent on carryout/delivered foods (%)
Current Health Status - General health condition (%)
Current Health Status - Blood donors (%)
Current Health Status - Has blood ever tested for HIV virus (%)
Current Health Status - Left-handed people (%)
Dermatology - People using sunscreen (%)
Diabetes - Diabetics (%)
Diabetes - Had a blood test for high blood sugar (%)
Diabetes - People taking insulin (%)
Diet Behavior & Nutrition - Diet health (%)
Diet Behavior & Nutrition - Milk product consumption (# of products/month)
Diet Behavior & Nutrition - Meals not home prepared (#/week)
Diet Behavior & Nutrition - Meals from fast food or pizza place (#/week)
Diet Behavior & Nutrition - Ready-to-eat foods (#/month)
Diet Behavior & Nutrition - Frozen meals/pizza (#/month)
Drug Use - People that ever used marijuana or hashish (%)
Drug Use - Ever used hard drugs (%)
Drug Use - Ever used any form of cocaine (%)
Drug Use - Ever used heroin (%)
Drug Use - Ever used methamphetamine (%)
Health Insurance - People covered by health insurance (%)
Kidney Conditions-Urology - Avg. # of times urinating at night
Medical Conditions - People with asthma (%)
Medical Conditions - People with anemia (%)
Medical Conditions - People with psoriasis (%)
Medical Conditions - People with overweight (%)
Medical Conditions - Elderly people having difficulties in thinking or remembering (%)
Medical Conditions - People who ever received blood transfusion (%)
Medical Conditions - People having trouble seeing even with glass/contacts (%)
Medical Conditions - People with arthritis (%)
Medical Conditions - People with gout (%)
Medical Conditions - People with congestive heart failure (%)
Medical Conditions - People with coronary heart disease (%)
Medical Conditions - People with angina pectoris (%)
Medical Conditions - People who ever had heart attack (%)
Medical Conditions - People who ever had stroke (%)
Medical Conditions - People with emphysema (%)
Medical Conditions - People with thyroid problem (%)
Medical Conditions - People with chronic bronchitis (%)
Medical Conditions - People with any liver condition (%)
Medical Conditions - People who ever had cancer or malignancy (%)
Mental Health - People who have little interest in doing things (%)
Mental Health - People feeling down, depressed, or hopeless (%)
Mental Health - People who have trouble sleeping or sleeping too much (%)
Mental Health - People feeling tired or having little energy (%)
Mental Health - People with poor appetite or overeating (%)
Mental Health - People feeling bad about themself (%)
Mental Health - People who have trouble concentrating on things (%)
Mental Health - People moving or speaking slowly or too fast (%)
Mental Health - People having thoughts they would be better off dead (%)
Oral Health - Average years since last visit a dentist
Oral Health - People embarrassed because of mouth (%)
Oral Health - People with gum disease (%)
Oral Health - General health of teeth and gums (%)
Oral Health - Average days a week using dental floss/device
Oral Health - Average days a week using mouthwash for dental problem
Oral Health - Average number of teeth
Pesticide Use - Households using pesticides to control insects (%)
Pesticide Use - Households using pesticides to kill weeds (%)
Physical Activity - People doing vigorous-intensity work activities (%)
Physical Activity - People doing moderate-intensity work activities (%)
Physical Activity - People walking or bicycling (%)
Physical Activity - People doing vigorous-intensity recreational activities (%)
Physical Activity - People doing moderate-intensity recreational activities (%)
Physical Activity - Average hours a day doing sedentary activities
Physical Activity - Average hours a day watching TV or videos
Physical Activity - Average hours a day using computer
Physical Functioning - People having limitations keeping them from working (%)
Physical Functioning - People limited in amount of work they can do (%)
Physical Functioning - People that need special equipment to walk (%)
Physical Functioning - People experiencing confusion/memory problems (%)
Physical Functioning - People requiring special healthcare equipment (%)
Prescription Medications - Average number of prescription medicines taking
Preventive Aspirin Use - Adults 40+ taking low-dose aspirin (%)
Reproductive Health - Vaginal deliveries (%)
Reproductive Health - Cesarean deliveries (%)
Reproductive Health - Deliveries resulted in a live birth (%)
Reproductive Health - Pregnancies resulted in a delivery (%)
Reproductive Health - Women breastfeeding newborns (%)
Reproductive Health - Women that had a hysterectomy (%)
Reproductive Health - Women that had both ovaries removed (%)
Reproductive Health - Women that have ever taken birth control pills (%)
Reproductive Health - Women taking birth control pills (%)
Reproductive Health - Women that have ever used Depo-Provera or injectables (%)
Reproductive Health - Women that have ever used female hormones (%)
Sexual Behavior - People 18+ that ever had sex (vaginal, anal, or oral) (%)
Sexual Behavior - Males 18+ that ever had vaginal sex with a woman (%)
Sexual Behavior - Males 18+ that ever performed oral sex on a woman (%)
Sexual Behavior - Males 18+ that ever had anal sex with a woman (%)
Sexual Behavior - Males 18+ that ever had any sex with a man (%)
Sexual Behavior - Females 18+ that ever had vaginal sex with a man (%)
Sexual Behavior - Females 18+ that ever performed oral sex on a man (%)
Sexual Behavior - Females 18+ that ever had anal sex with a man (%)
Sexual Behavior - Females 18+ that ever had any kind of sex with a woman (%)
Sexual Behavior - Average age people first had sex
Sexual Behavior - Average number of female sex partners in lifetime (males 18+)
Sexual Behavior - Average number of female vaginal sex partners in lifetime (males 18+)
Sexual Behavior - Average age people first performed oral sex on a woman (18+)
Sexual Behavior - Average number of woman performed oral sex on in lifetime (18+)
Sexual Behavior - Average number of male sex partners in lifetime (males 18+)
Sexual Behavior - Average number of male anal sex partners in lifetime (males 18+)
Sexual Behavior - Average age people first performed oral sex on a man (18+)
Sexual Behavior - Average number of male oral sex partners in lifetime (18+)
Sexual Behavior - People using protection when performing oral sex (%)
Sexual Behavior - Average number of times people have vaginal or anal sex a year
Sexual Behavior - People having sex without condom (%)
Sexual Behavior - Average number of male sex partners in lifetime (females 18+)
Sexual Behavior - Average number of male vaginal sex partners in lifetime (females 18+)
Sexual Behavior - Average number of female sex partners in lifetime (females 18+)
Sexual Behavior - Circumcised males 18+ (%)
Sleep Disorders - Average hours sleeping at night
Sleep Disorders - People that has trouble sleeping (%)
Smoking-Cigarette Use - People smoking cigarettes (%)
Taste & Smell - People 40+ having problems with smell (%)
Taste & Smell - People 40+ having problems with taste (%)
Taste & Smell - People 40+ that ever had wisdom teeth removed (%)
Taste & Smell - People 40+ that ever had tonsils teeth removed (%)
Taste & Smell - People 40+ that ever had a loss of consciousness because of a head injury (%)
Taste & Smell - People 40+ that ever had a broken nose or other serious injury to face or skull (%)
Taste & Smell - People 40+ that ever had two or more sinus infections (%)
Weight - Average height (inches)
Weight - Average weight (pounds)
Weight - Average BMI
Weight - People that are obese (%)
Weight - People that ever were obese (%)
Weight - People trying to lose weight (%)
100%
urban population.
Estimated median house/condo value in 2022: $171,585
14608:
$171,585New York:
$400,400
Median resident age: This zip code:
33.1 yearsNew York median age:
40.0 years
Average household size: This zip code:
2.1 peopleNew York:
2.5 people
Averages for the 2020 tax year for zip code 14608, filed in 2021:
Average Adjusted Gross Income (AGI) in 2020: $32,300 (Individual Income Tax Returns) Here:
$32,300State:
$90,930
Salary/wage: $28,185 (reported on 89.0% of returns )Here:
$28,185State:
$72,104
(% of AGI for various income ranges: 1135.3% for AGIs below $25k , 3541.0% for AGIs $25k-50k , 6995.8% for AGIs $50k-75k , 9902.0% for AGIs $75k-100k , 17440.0% for AGIs $100k-200k ) Taxable interest for individuals: $314 (reported on 12.8% of returns )This zip code:
$314New York:
$3,075
(% of AGI for various income ranges: 0.7% for AGIs below $25k , 2.7% for AGIs $25k-50k , 9.1% for AGIs $50k-75k , 18.0% for AGIs $75k-100k , 73.8% for AGIs $100k-200k ) Ordinary dividends: $3,785 (reported on 5.2% of returns )(% of AGI for various income ranges: 3.1% for AGIs below $25k , 7.1% for AGIs $25k-50k , 12.7% for AGIs $50k-75k , 122.0% for AGIs $75k-100k , 196.2% for AGIs $100k-200k ) Net capital gain/loss in AGI: +$6,188 (reported on 4.8% of returns )Here:
+$6,188State:
+$44,925
(% of AGI for various income ranges: 2.2% for AGIs below $25k , 7.7% for AGIs $25k-50k , 31.8% for AGIs $50k-75k , 90.0% for AGIs $75k-100k , 197.5% for AGIs $100k-200k ) Profit/loss from business: +$8,494 (reported on 10.6% of returns )Here:
+$8,494State:
+$14,940
(% of AGI for various income ranges: 57.7% for AGIs below $25k , 63.3% for AGIs $25k-50k , 137.3% for AGIs $50k-75k , 355.0% for AGIs $75k-100k , 2020.0% for AGIs $100k-200k ) Taxable individual retirement arrangement distribution: $13,750 (reported on 2.8% of returns )14608:
$13,750New York:
$19,609
(% of AGI for various income ranges: 10.5% for AGIs below $25k , 23.1% for AGIs $25k-50k , 156.4% for AGIs $50k-75k , 873.0% for AGIs $75k-100k ) Total itemized deductions: $22,480 (reported on 2.0% of returns )Here:
$22,480State:
$39,326
(% of AGI for various income ranges: 40.7% for AGIs $25k-50k , 196.1% for AGIs $50k-75k , 1308.8% for AGIs $100k-200k ) Charity contributions: $5,725 (reported on 1.6% of returns )(% of AGI for various income ranges: 52.7% for AGIs $50k-75k , 355.0% for AGIs $100k-200k ) Taxes paid: $8,100 (reported on 2.0% of returns )(% of AGI for various income ranges: 12.0% for AGIs $25k-50k , 83.3% for AGIs $50k-75k , 465.0% for AGIs $100k-200k ) Earned income credit: $2,646 (reported on 38.8% of returns )(% of AGI for various income ranges: 165.9% for AGIs below $25k , 120.1% for AGIs $25k-50k ) Percentage of individuals using paid preparers for their 2020 taxes: 94.6%(% for various income ranges: 94.5% for AGIs below $25k , 95.2% for AGIs $25k-50k , 93.6% for AGIs $50k-75k , 100.0% for AGIs $75k-100k , 92.9% for AGIs $100k-200k , 75.0% for AGIs over 200k )
Averages for the 2012 tax year for zip code 14608, filed in 2013:
Average Adjusted Gross Income (AGI) in 2012: $25,896 (Individual Income Tax Returns) Here:
$25,896State:
$77,088
Salary/wage: $24,366 (reported on 89.4% of returns )Here:
$24,366State:
$60,593
(% of AGI for various income ranges: 81.9% for AGIs below $25k , 87.3% for AGIs $25k-50k , 83.4% for AGIs $50k-75k , 81.2% for AGIs $75k-100k , 84.7% for AGIs $100k-200k , 83.1% for AGIs over 200k ) Taxable interest for individuals: $402 (reported on 13.8% of returns )This zip code:
$402New York:
$3,125
(% of AGI for various income ranges: 0.1% for AGIs below $25k , 0.2% for AGIs $25k-50k , 0.2% for AGIs $50k-75k , 0.2% for AGIs $75k-100k , 0.6% for AGIs $100k-200k ) Ordinary dividends: $2,432 (reported on 5.3% of returns )(% of AGI for various income ranges: 0.1% for AGIs below $25k , 0.2% for AGIs $25k-50k , 0.5% for AGIs $50k-75k , 0.3% for AGIs $75k-100k , 2.7% for AGIs $100k-200k ) Net capital gain/loss in AGI: +$2,559 (reported on 3.6% of returns )Here:
+$2,559State:
+$42,474
(% of AGI for various income ranges: 1.2% for AGIs $50k-75k , 1.7% for AGIs $100k-200k ) Profit/loss from business: +$7,704 (reported on 10.6% of returns )Here:
+$7,704State:
+$16,168
(% of AGI for various income ranges: 7.7% for AGIs below $25k , 1.9% for AGIs $25k-50k , 1.1% for AGIs $50k-75k , 0.5% for AGIs $100k-200k ) Taxable individual retirement arrangement distribution: $11,425 (reported on 2.6% of returns )14608:
$11,425New York:
$17,621
(% of AGI for various income ranges: 0.6% for AGIs below $25k , 1.1% for AGIs $25k-50k , 1.1% for AGIs $50k-75k , 5.7% for AGIs $75k-100k ) Total itemized deductions: $16,700 (21% of AGI, reported on 9.6% of returns )Here:
$16,700State:
$34,985
Here:
21.3% of AGIState:
21.3% of AGI
(% of AGI for various income ranges: 1.5% for AGIs below $25k , 4.5% for AGIs $25k-50k , 8.2% for AGIs $50k-75k , 11.3% for AGIs $75k-100k , 12.4% for AGIs $100k-200k , 16.0% for AGIs over 200k ) Charity contributions: $3,119 (reported on 7.9% of returns )(% of AGI for various income ranges: 0.3% for AGIs below $25k , 0.9% for AGIs $25k-50k , 1.0% for AGIs $50k-75k , 2.1% for AGIs $75k-100k , 2.7% for AGIs $100k-200k ) Taxes paid: $7,411 (reported on 9.6% of returns )14608:
$7,411State:
$18,656
(% of AGI for various income ranges: 0.5% for AGIs below $25k , 1.3% for AGIs $25k-50k , 3.7% for AGIs $50k-75k , 5.1% for AGIs $75k-100k , 6.7% for AGIs $100k-200k , 9.3% for AGIs over 200k ) Earned income credit: $2,522 (reported on 46.8% of returns )(% of AGI for various income ranges: 13.1% for AGIs below $25k , 1.7% for AGIs $25k-50k ) Percentage of individuals using paid preparers for their 2012 taxes: 46.0%(% for various income ranges: 45.5% for AGIs below $25k , 43.9% for AGIs $25k-50k , 50.0% for AGIs $50k-75k , 45.5% for AGIs $75k-100k , 80.0% for AGIs $100k-200k )
Averages for the 2004 tax year for zip code 14608, filed in 2005:
Average Adjusted Gross Income (AGI) in 2004: $22,847 (Individual Income Tax Returns) Here:
$22,847State:
$59,519
Salary/wage: $21,418 (reported on 90.8% of returns )Here:
$21,418State:
$50,673
(% of AGI for various income ranges: 85.9% for AGIs below $10k , 88.3% for AGIs $10k-25k , 90.2% for AGIs $25k-50k , 85.0% for AGIs $50k-75k , 80.5% for AGIs $75k-100k , 63.5% for AGIs over 100k ) Taxable interest for individuals: $351 (reported on 19.6% of returns )This zip code:
$351New York:
$2,377
(% of AGI for various income ranges: 0.4% for AGIs below $10k , 0.2% for AGIs $10k-25k , 0.4% for AGIs $25k-50k , 0.3% for AGIs $50k-75k , 0.3% for AGIs $75k-100k , 0.2% for AGIs over 100k ) Taxable dividends: $981 (reported on 8.1% of returns )(% of AGI for various income ranges: 0.6% for AGIs below $10k , 0.2% for AGIs $10k-25k , 0.1% for AGIs $25k-50k , 0.7% for AGIs $50k-75k , 1.0% for AGIs $75k-100k , 0.4% for AGIs over 100k ) Net capital gain/loss: +$902 (reported on 5.0% of returns )(% of AGI for various income ranges: -0.1% for AGIs below $10k , 0.1% for AGIs $10k-25k , 0.1% for AGIs $25k-50k , -0.0% for AGIs $50k-75k , 0.3% for AGIs $75k-100k , 1.4% for AGIs over 100k ) Profit/loss from business: +$5,557 (reported on 9.2% of returns )Here:
+$5,557State:
+$13,809
(% of AGI for various income ranges: 9.5% for AGIs below $10k , 3.2% for AGIs $10k-25k , 0.8% for AGIs $25k-50k , 2.0% for AGIs $50k-75k , 1.9% for AGIs $75k-100k ) IRA payment deduction: $1,912 (reported on 0.9% of returns )14608:
$1,912New York:
$3,115
Total itemized deductions: $13,176 (23% of AGI, reported on 13.7% of returns )Here:
$13,176State:
$25,864
Here:
23.2% of AGIState:
21.9% of AGI
(% of AGI for various income ranges: 2.1% for AGIs below $10k , 3.4% for AGIs $10k-25k , 7.3% for AGIs $25k-50k , 14.0% for AGIs $50k-75k , 13.9% for AGIs $75k-100k , 13.0% for AGIs over 100k ) Charity contributions deductions: $2,536 (4% of AGI, reported on 12.0% of returns )Here:
4.3% of AGIState:
3.6% of AGI
(% of AGI for various income ranges: 0.3% for AGIs below $10k , 0.5% for AGIs $10k-25k , 1.3% for AGIs $25k-50k , 2.7% for AGIs $50k-75k , 2.1% for AGIs $75k-100k , 1.9% for AGIs over 100k ) Total tax: $3,446 (reported on 52.6% of returns )14608:
$3,446State:
$11,730
(% of AGI for various income ranges: 1.9% for AGIs below $10k , 2.8% for AGIs $10k-25k , 7.2% for AGIs $25k-50k , 11.7% for AGIs $50k-75k , 13.0% for AGIs $75k-100k , 19.2% for AGIs over 100k ) Earned income credit: $1,972 (reported on 46.2% of returns )Percentage of individuals using paid preparers for their 2004 taxes: 69.8%(% for various income ranges: 72.2% for AGIs below $10k , 74.6% for AGIs $10k-25k , 61.3% for AGIs $25k-50k , 59.6% for AGIs $50k-75k , 62.5% for AGIs $75k-100k , 72.6% for AGIs over 100k )
Estimated median household income in 2022: This zip code:
$33,940New York:
$79,557
Nearest zip codes: 14614 ,
14604 ,
14611 ,
14605 ,
14627 ,
14620 .
Rochester Zip Code Map
Percentage of family households: This zip code:
33.3%New York:
41.3%
Percentage of households with unmarried partners: This zip code:
4.2%New York:
42.3%
Likely homosexual households (counted as self-reported same-sex unmarried-partner households)
Lesbian couples: 0.0% of all households Gay men: 0.3% of all households
Household received Food Stamps/SNAP in the past 12 months: 2,483Household did not receive Food Stamps/SNAP in the past 12 months: 3,556
Women who had a birth in the past 12 months: 130 (58 now married , 74 unmarried) Women who did not have a birth in the past 12 months: 3,304 (772 now married , 2,552 unmarried)
Housing units in zip code 14608 with a mortgage: 755 (65
second mortgage , 60
both second mortgage and home equity loan )
Houses without a mortgage: 149
Median monthly owner costs for units with a mortgage: $1,337
Median monthly owner costs for units without a mortgage: $642
Residents with income below the poverty level in 2022:
This zip code:
39.6%Whole state:
14.3%
Residents with income below 50% of the poverty level in 2022:
This zip code:
20.8%Whole state:
6.8%
Median number of rooms in houses and condos: Median number of rooms in apartments: Notable locations in this zip code not listed on our city pages
Click to draw/clear zip code borders Notable locations in zip code 14608: (A) , Landmark Society of Western New York (B) , Hervey Ely House (C) , Campbell - Whittlesey House (D) , Northwest Rochester Senior Center (E) , Rochester Public Library Phyllis Wheatley Branch (F) , Rochester Fire Department Engine 13 (G) . Display/hide their locations on the map
Churches in zip code 14608 include: (A) , All Souls United Church of Religious Science (B) , Ark of the Covenant Church of God By Faith (C) , Central Church of Christ (D) , Christ Temple Apostolic Faith Church (E) , Church of God in Christ (F) , Church of Love Faith Center (G) , Church of Nazareth (H) , Downtown Rochester Presbyterian Church (I) . Display/hide their locations on the map
Parks in zip code 14608 include: (1) , Teoronto Block Historic District (2) , Anthony Square (3) . Display/hide their locations on the map
Year house built (houses)
0 2020 or later299 2010 to 2019507 2000 to 2009306 1990 to 1999620 1980 to 1989682 1970 to 1979249 1960 to 1969322 1950 to 1959371 1940 to 19493,434 1939 or earlier
Zip code 14608 household income distribution in 2022 813 Less than $10,000672 $10,000 to $14,999584 $15,000 to $19,999237 $20,000 to $24,999327 $25,000 to $29,999383 $30,000 to $34,999298 $35,000 to $39,999367 $40,000 to $44,999188 $45,000 to $49,999483 $50,000 to $59,999372 $60,000 to $74,999492 $75,000 to $99,999303 $100,000 to $124,999102 $125,000 to $149,999149 $150,000 to $199,999152 $200,000 or moreEstimate of home value of owner-occupied houses/condos in 2022 in zip code 14608 30 Less than $10,00016 $10,000 to $14,9992 $15,000 to $19,99933 $20,000 to $24,9996 $25,000 to $29,99980 $30,000 to $34,99926 $35,000 to $39,99943 $40,000 to $49,99957 $50,000 to $59,999129 $60,000 to $69,99941 $70,000 to $79,99923 $80,000 to $89,99950 $90,000 to $99,99920 $100,000 to $124,99927 $125,000 to $149,99987 $150,000 to $174,999109 $175,000 to $199,999176 $200,000 to $249,999180 $250,000 to $299,99929 $300,000 to $399,99943 $400,000 to $499,99947 $500,000 to $749,999Rent paid by renters in 2022 in zip code 14608 17 Less than $1002 $100 to $149100 $150 to $199172 $200 to $249228 $250 to $29977 $300 to $34985 $350 to $39998 $400 to $449108 $450 to $499168 $500 to $549187 $550 to $599511 $600 to $649427 $650 to $699320 $700 to $749209 $750 to $799713 $800 to $899385 $900 to $999259 $1,000 to $1,249335 $1,250 to $1,499194 $1,500 to $1,99927 $2,000 to $2,49967 No cash rent
Median gross rent in 2022: $910.
Median price asked for vacant for-sale houses and condos in 2022: $247,053.
Estimated median house (or condo) value in 2022 for: White Non-Hispanic householders: $240,335Black or African American householders: $157,601Asian householders: $177,120Some other race householders: $276,750Two or more races householders: $162,262Hispanic or Latino householders: $224,313Estimated median house or condo value in 2022: $171,585
14608:
$171,585New York:
$400,400
Lower value quartile - upper value quartile: $67,270 - $249,294
Mean price in 2022: Detached houses: $129,600Here:
$129,600State:
$476,719
Townhouses or other attached units: $192,354Here:
$192,354State:
$699,270
In 2-unit structures: $166,706Here:
$166,706State:
$713,077
In 3-to-4-unit structures: $669,935Here:
$669,935State:
$764,568
In 5-or-more-unit structures: $245,501Here:
$245,501State:
$912,009
Mobile homes: $13,431Here:
$13,431State:
$88,925
Housing units in structures:
One, detached: 1,942One, attached: 685Two: 1,3013 or 4: 8645 to 9: 45710 to 19: 27020 to 49: 57650 or more: 725Mobile homes: 15Unemployment : 10.9%
Means of transportation to work in zip code 14608 57.8% 2,840 Drove a car alone8.1% 396 Carpooled10.0% 493 Bus or trolley bus2.0% 98 Streetcar or trolley car1.7% 82 Taxi6.0% 294 Bicycle4.8% 235 Walked0.5% 26 Other means10.0% 491 Worked at homeTravel time to work (commute) in zip code 14608 142 Less than 5 minutes566 5 to 9 minutes833 10 to 14 minutes994 15 to 19 minutes536 20 to 24 minutes230 25 to 29 minutes523 30 to 34 minutes5 35 to 39 minutes112 40 to 44 minutes205 45 to 59 minutes100 60 to 89 minutes118 90 or more minutes
Neighborhoods in zip code 14608: Percentage of zip code residents living and working in this county: 98.3%
Household type by relationship:
Households: 12,272
Male householders: 2,350 (1,581 living alone ), Female householders: 3,520 (1,380 living alone )983 spouses (960 opposite-sex spouses ), 500 unmarried partners , (490 opposite-sex unmarried partners ), 3,574 children (3,526 natural , 54 adopted , 0 stepchildren ), 453 grandchildren , 116 brothers or sisters , 177 parents , 0 foster children , 88 other relatives , 335 non-relatives In group quarters: 227 (-1 institutionalized population )
Size of family households: 1,143 2-persons , 574 3-persons , 248 4-persons , 163 5-persons , 181 6-persons , 65 7-or-more-persons
Size of nonfamily households: 2,964 1-person , 502 2-persons , 67 3-persons , 10 4-persons , 8 5-persons
775 married couples with children. single-parent households (13 men , 1,462 women ).
80.0% of residents of 14608 zip code speak English at home. of residents speak Spanish at home (67% very well, 14% well, 15% not well, 4% not at all ).of residents speak other Indo-European language at home (54% very well, 21% well, 17% not well, 9% not at all ).of residents speak Asian or Pacific Island language at home (25% very well, 75% well ).of residents speak other language at home (63% very well, 15% well, 21% not well, 1% not at all ).
Foreign born population: 1,300 (10.6%)
(34.9%
of them are naturalized citizens )
This zip code:
10.6%Whole state:
22.7%
35% Kenya 14% Kazakhstan 10% Tanzania 7% Bangladesh 4% Haiti 3% Japan 3% Iraq 5% Somali 4% American 3% Italian 3% English 3% German 2% African 2% Jamaican
Year of entry for the foreign-born population
1,130 2010 or later 365 2000 to 2009 164 1990 to 1999 210 Before 1990
There are
161 Medical Specialists in Zip Code 14608 .
Major facilities with environmental interests located in this zip code:
ADFLEX CORP (284 ALLEN STREET in ROCHESTER, NY)
AIR MINOR (AIRS/AFS) - ICIS-, ENFORCEMENT/COMPLIANCE ACTIVITY STATE MASTER (New York facility tracking) - AIR PROGRAM, HAZARDOUS WASTE PROGRAM CRITERIA AND HAZARDOUS AIR POLLUTANT INVENTORY (Inventory of air pollution sources) Small Quantity Generators, between 100 kg and 1000 kg of hazardous waste/month (Resource Conservation and Recovery Act (tracking hazardous waste)) Business SIC classification: DIRECT MAIL ADVERTISING SERVICES
ARTCO INDUSTRIAL LAUNDRIES INC (333 MAIN ST W in ROCHESTER, NY)
AIR MINOR (AIRS/AFS) STATE MASTER (New York facility tracking) - AIR PROGRAM Business SIC classification: DRYCLEANING PLANTS, EXCEPT RUG CLEANINGBusiness NAICS classification: DRYCLEANING AND LAUNDRY SERVICES (EXCEPT COIN-OPERATED).
ARTCRAFT OPTICAL CO (89 ALLEN ST in ROCHESTER, NY)
STATE MASTER (New York facility tracking) - AIR PROGRAM, (Resource Conservation and Recovery Act (tracking hazardous waste)) Business SIC classification: OPHTHALMIC GOODSBusiness NAICS classification: PEN AND MECHANICAL PENCIL MANUFACTURING.
ARTCO INUDSTRIAL LAUNDRIES, INC. (333 WEST MAIN STREET in ROCHESTER, NY)
SUPERFUND (Superfund database) HAZARDOUS WASTE BIENNIAL REPORTER (Resource Conservation and Recovery Act (tracking hazardous waste)) (Resource Conservation and Recovery Act (tracking hazardous waste)) Alternative names: ARTCO INDUSTRIAL LAUNDRIES incorporated, ARTCO INDUSTRIAL LAUNDRY INC, CINTAS CORP
CUBLOTTI SAMUEL (159 LYELL AVE in ROCHESTER, NY)
(Resource Conservation and Recovery Act (tracking hazardous waste)) Organizations: SAMUAL CUBIOTTI (CONTACT/OPERATOR)
A & W COLLISION (250 SPENCER ST in ROCHESTER, NY)
(Resource Conservation and Recovery Act (tracking hazardous waste))
ACTION FOR A BETTER COMMUNITY (244 S PLYMOUTH AVE in ROCHESTER, NY)
(Resource Conservation and Recovery Act (tracking hazardous waste))
HEINRICH BUILDING (35 AMBROSE ST in ROCHESTER, NY)
(Resource Conservation and Recovery Act (tracking hazardous waste))
HESS STATION #32287 (440 LAKE AVENUE in ROCHESTER, NY)
ENFORCEMENT/COMPLIANCE ACTIVITY (Integrated Compliance Information System) Conditionally Exempt Small Quantity Generators, less than 100 kg/month of hazardous waste (Resource Conservation and Recovery Act (tracking hazardous waste)) - notification Organizations: AMERADA HESS CORP (CONTACT/OWNER)
Alternative names: AMERADA HESS STATION 32287
IMMACULATE CONCEPTION CHURCH (445 FREDERICK DOUGLAS ST in ROCHESTER, NY)
(Resource Conservation and Recovery Act (tracking hazardous waste))
IMPACT MOTORS (720 EXCHANGE ST in ROCHESTER, NY)
(Resource Conservation and Recovery Act (tracking hazardous waste))
CONTINENTAL AUTO BODY (270 LAKE AVE in ROCHESTER, NY)
(Resource Conservation and Recovery Act (tracking hazardous waste))
CORNHILL APTS & TOWNHOUSES (715 CLARISSA ST in ROCHESTER, NY)
ENFORCEMENT/COMPLIANCE ACTIVITY (Integrated Compliance Information System) COMPLIANCE ACTIVITY (Tracking inspections of insecticide, fungicide, and rodenticide, and toxic substances) Business SIC classification: OPERATORS OF APARTMENT BUILDINGSAlternative names: CORNHILL APARTMENTS AND TOWNHOUSES
Housing units lacking complete plumbing facilities: 1.6%
Housing units lacking complete kitchen facilities: 2.6%
64.4% Utility gas 30.6% Electricity 1.8% No fuel used 1.3% Other fuel 0.9% Bottled, tank, or LP gas 0.9% Fuel oil, kerosene, etc.
Population in 1990: 14,631.
Place of birth for U.S.-born residents:
This state: 8,050Northeast: 561Midwest: 333South: 1,301West: 249
47% of the 14608 zip code residents lived in the same house 5 years ago.
Out of people who lived in different houses, 83% lived in this county.
Out of people who lived in different counties, 50% lived in New York.
87% of the 14608 zip code residents lived in the same house 1 year ago.
Out of people who lived in different houses, 67% moved from this county.
Out of people who lived in different houses, 12% moved from different county within same state.
Out of people who lived in different houses, 20% moved from different state.
Out of people who lived in different houses, 1% moved from abroad.
Private vs. public school enrollment:
Students in private schools in grades 1 to 8 (elementary and middle school):
Students in private schools in grades 9 to 12 (high school): 52
Students in private undergraduate colleges: 118
Occupation by median earnings in the past 12 months ($)
105,775 Architecture and engineering occupations 87,218 Computer and mathematical occupations 62,214 Health technologists and technicians 60,080 Construction and extraction occupations 52,167 Health diagnosing and treating practitioners and other technical occupations 49,257 Arts, design, entertainment, sports, and media occupations
Companies with federal contracts located in this zip code (ROCHESTER, NY):
WALKER BRUSH INC (215 TREMONT STREET; small business) employees , $0 revenue . : $145,728 in 2 contracts from 2001 to 2002
$73,728 with Defense Logistics Agency for Guns, through 30 mm. Signed on 2002-05-07. Completion date: 2002-06-06.
, same as above. Signed on 2001-10-15. Completion date: 2002-01-13.
GRADIENT LENS CORPORATION (207 TREMONT STREET; small business) in 6 contracts from 2005 to 2006
Contracts for Defense Electronics and Communication Equipment -- Basic Research (R&D), Inspection Gages and Precision Layout Tools, , Video Recording and Reproducing Equipment, and more by Army, Navy, NASA, Bureau of Alcohol, Tobacco, Firearms and Explosives, and others Signed by year: 2000: $0; 2001: $0; 2002: $0; 2003: $0; 2004: $0; 2005: $99,042; 2006: $35,300.
Biggest contracts: with Army for Defense Electronics and Communication Equipment -- Basic Research (R&D). Signed on 2005-11-30. Completion date: 2006-05-22.
with Navy for Inspection Gages and Precision Layout Tools. Signed on 2005-12-14. Completion date: 2005-12-30.
with NASA for . Signed on 2006-08-14. Completion date: 2006-11-13.
with Navy for Video Recording and Reproducing Equipment. Signed on 2006-05-01. Completion date: 2006-05-10.
ROCHESTER COMMUNITY BASEBALL I (1 MORRIE SILVER WAY; small business) in 5 contracts from 2003 to 2006
Contracts for Other Management Support Services, Signs, Advertising Displays, and Identification Plates by ArmySigned by year: 2000: $0; 2001: $0; 2002: $0; 2003: $6,350; 2004: $5,900; 2005: $10,600; 2006: $4,200.
Biggest contracts: with Army for Other Management Support Services. Signed on 2005-02-01. Completion date: 2006-01-31.
, same as above. Signed on 2003-03-03. Completion date: 2004-05-14.
, same as above. Signed on 2004-04-07. Completion date: 2005-05-14.
with Army for Signs, Advertising Displays, and Identification Plates. Signed on 2006-03-23. Completion date: 2006-10-30.
AMERICAN RANGE COMPANY (4 VAN AUKER ST; small business)
$24,026 with Navy for Maintenance, Repair or Alteration of Real Property -- Recreation Facilities (Non-Building). Taking place in MS. Signed on 2005-06-30. Completion date: 2005-08-10.
HAHN AUTOMOTIVE WAREHOUSE, INC (415 W MAIN STREET; small business) in 8 contracts from 2002 to 2004
Contracts for Miscellaneous Vehicular Components by U.S. Army Corps of Engineers - civil program financing only, ArmySigned by year: 2000: $0; 2001: $0; 2002: $2,500; 2003: $7,000; 2004: $9,000; 2005: $0; 2006: $0.
Biggest contracts: with U.S. Army Corps of Engineers - civil program financing only for Miscellaneous Vehicular Components. Signed on 2002-12-12. Completion date: 2002-10-01.
with U.S. Army Corps of Engineers - civil program financing only for Miscellaneous Vehicular Components. Taking place in VA. Signed on 2004-11-19. Completion date: 2005-09-30.
with Army for Miscellaneous Vehicular Components. Taking place in VA. Signed on 2004-11-19. Completion date: 2005-09-30.
, same as above. Signed on 2003-11-06. Completion date: 2004-09-30.
Top industries in this zip code by the number of employees in 2005:
Health Care and Social Assistance: Services for the Elderly and Persons with Disabilities (500-999 employees: 1 establishment, 1-4 employees: 1 establishment)Administrative and Support and Waste Management and Remediation Services: Temporary Help Services (500-999: 1)Information: Wired Telecommunications Carriers (100-249: 1, 5-9: 1, 1-4: 1)Accommodation and Food Services: Food Service Contractors (100-249: 1)Health Care and Social Assistance: Ambulance Services (100-249: 1)Management of Companies and Enterprises: Corporate, Subsidiary, and Regional Managing Offices (50-99: 2, 10-19: 1)Real Estate and Rental and Leasing: Residential Property Managers (50-99: 1, 20-49: 1, 10-19: 1, 5-9: 1, 1-4: 1)
People in group quarters in 2010:
60 people in group homes intended for adults
59 people in correctional residential facilities
49 people in residential treatment centers for adults
4 people in group homes for juveniles (non-correctional)
People in group quarters in 2000:
90 people in state prisons
57 people in homes for the mentally ill
16 people in homes or halfway houses for drug/alcohol abuse
11 people in other group homes
Fatal accident statistics in 2014:
Fatal accident count: 2Vehicles involved in fatal accidents: 3Fatal accidents caused by drunken drivers: 1Fatalities: 2Persons involved in fatal accidents: 4Pedestrians involved in fatal accidents: 0
Fatal accident statistics in 2012:
Fatal accident count: 1Vehicles involved in fatal accidents: 1Fatal accidents caused by drunken drivers: 0Fatalities: 1Persons involved in fatal accidents: 1Pedestrians involved in fatal accidents: 1
Home Mortgage Disclosure Act Aggregated Statistics For Year 2009(Based on 22 partial tracts) A) FHA, FSA/RHS & VA B) Conventional C) Refinancings D) Home Improvement Loans E) Loans on Dwellings For 5+ Families F) Non-occupant Loans on Number Average Value Number Average Value Number Average Value Number Average Value Number Average Value Number Average Value
LOANS ORIGINATED 31 $114,054 21 $87,952 49 $86,281 23 $8,710 7 $320,721 14 $44,019 APPLICATIONS APPROVED, NOT ACCEPTED 2 $38,985 7 $60,216 16 $92,198 0 $0 0 $0 2 $68,510 APPLICATIONS DENIED 10 $81,571 8 $66,505 41 $72,598 44 $13,271 0 $0 13 $38,313 APPLICATIONS WITHDRAWN 0 $0 8 $75,832 13 $139,683 1 $6,810 0 $0 6 $56,737 FILES CLOSED FOR INCOMPLETENESS 3 $60,007 1 $61,350 4 $158,822 0 $0 1 $368,550 1 $15,720
Aggregated Statistics For Year 2008(Based on 22 partial tracts) A) FHA, FSA/RHS & VA B) Conventional C) Refinancings D) Home Improvement Loans E) Loans on Dwellings For 5+ Families F) Non-occupant Loans on Number Average Value Number Average Value Number Average Value Number Average Value Number Average Value Number Average Value
LOANS ORIGINATED 23 $116,790 92 $76,680 45 $81,688 20 $12,696 1 $583,240 68 $58,369 APPLICATIONS APPROVED, NOT ACCEPTED 2 $80,565 8 $96,759 12 $58,406 12 $20,611 0 $0 13 $52,585 APPLICATIONS DENIED 4 $63,100 28 $81,056 90 $59,437 49 $18,430 5 $214,980 31 $56,508 APPLICATIONS WITHDRAWN 5 $76,808 8 $36,670 39 $64,725 2 $116,165 0 $0 9 $33,770 FILES CLOSED FOR INCOMPLETENESS 0 $0 5 $170,768 9 $68,479 3 $47,793 0 $0 6 $75,588
Aggregated Statistics For Year 2007(Based on 22 partial tracts) A) FHA, FSA/RHS & VA B) Conventional C) Refinancings D) Home Improvement Loans E) Loans on Dwellings For 5+ Families F) Non-occupant Loans on G) Loans On Manufactured Number Average Value Number Average Value Number Average Value Number Average Value Number Average Value Number Average Value Number Average Value
LOANS ORIGINATED 5 $95,038 171 $74,298 63 $63,660 27 $17,204 16 $261,371 108 $43,805 1 $17,290 APPLICATIONS APPROVED, NOT ACCEPTED 0 $0 40 $69,210 18 $46,208 4 $10,955 2 $115,560 36 $47,458 0 $0 APPLICATIONS DENIED 7 $91,680 59 $48,701 224 $71,890 98 $20,696 1 $143,320 93 $47,016 1 $86,460 APPLICATIONS WITHDRAWN 1 $216,410 21 $89,456 72 $94,149 8 $14,039 0 $0 23 $84,358 0 $0 FILES CLOSED FOR INCOMPLETENESS 0 $0 11 $45,425 13 $95,460 2 $44,425 0 $0 14 $57,571 0 $0
Aggregated Statistics For Year 2006(Based on 22 partial tracts) A) FHA, FSA/RHS & VA B) Conventional C) Refinancings D) Home Improvement Loans E) Loans on Dwellings For 5+ Families F) Non-occupant Loans on G) Loans On Manufactured Number Average Value Number Average Value Number Average Value Number Average Value Number Average Value Number Average Value Number Average Value
LOANS ORIGINATED 18 $78,654 167 $66,454 110 $48,932 66 $17,471 4 $160,520 136 $42,511 2 $21,405 APPLICATIONS APPROVED, NOT ACCEPTED 2 $62,770 23 $41,258 26 $91,670 15 $21,972 4 $66,865 25 $42,529 0 $0 APPLICATIONS DENIED 5 $83,666 82 $58,080 250 $67,686 119 $26,049 0 $0 100 $38,583 3 $31,643 APPLICATIONS WITHDRAWN 1 $67,620 31 $56,306 86 $74,628 6 $31,465 0 $0 36 $48,246 0 $0 FILES CLOSED FOR INCOMPLETENESS 1 $43,590 8 $97,228 25 $90,511 2 $58,080 0 $0 6 $47,658 0 $0
Aggregated Statistics For Year 2005(Based on 22 partial tracts) A) FHA, FSA/RHS & VA B) Conventional C) Refinancings D) Home Improvement Loans E) Loans on Dwellings For 5+ Families F) Non-occupant Loans on G) Loans On Manufactured Number Average Value Number Average Value Number Average Value Number Average Value Number Average Value Number Average Value Number Average Value
LOANS ORIGINATED 15 $152,179 174 $75,596 142 $58,853 33 $19,992 9 $218,558 126 $45,933 0 $0 APPLICATIONS APPROVED, NOT ACCEPTED 1 $84,560 34 $54,743 62 $53,536 10 $26,879 2 $88,190 25 $46,970 2 $49,685 APPLICATIONS DENIED 2 $71,100 74 $50,604 358 $59,950 126 $17,994 1 $113,180 102 $29,887 7 $39,314 APPLICATIONS WITHDRAWN 4 $84,312 35 $76,239 128 $68,788 23 $76,058 0 $0 36 $55,538 0 $0 FILES CLOSED FOR INCOMPLETENESS 0 $0 8 $82,108 38 $91,795 1 $51,800 0 $0 8 $56,674 0 $0
Aggregated Statistics For Year 2004(Based on 22 partial tracts) A) FHA, FSA/RHS & VA B) Conventional C) Refinancings D) Home Improvement Loans E) Loans on Dwellings For 5+ Families F) Non-occupant Loans on G) Loans On Manufactured Number Average Value Number Average Value Number Average Value Number Average Value Number Average Value Number Average Value Number Average Value
LOANS ORIGINATED 16 $91,747 117 $85,147 146 $66,880 39 $22,830 8 $207,946 73 $45,621 0 $0 APPLICATIONS APPROVED, NOT ACCEPTED 6 $106,287 20 $76,323 48 $53,784 4 $40,948 0 $0 12 $44,294 1 $19,420 APPLICATIONS DENIED 5 $55,622 31 $65,738 302 $57,114 89 $23,665 2 $121,785 57 $41,904 5 $15,594 APPLICATIONS WITHDRAWN 0 $0 20 $102,566 128 $69,299 11 $53,745 2 $33,725 15 $45,646 0 $0 FILES CLOSED FOR INCOMPLETENESS 0 $0 8 $68,114 24 $70,068 2 $19,875 0 $0 4 $47,578 0 $0
Aggregated Statistics For Year 2003(Based on 22 partial tracts) A) FHA, FSA/RHS & VA B) Conventional C) Refinancings D) Home Improvement Loans E) Loans on Dwellings For 5+ Families F) Non-occupant Loans on Number Average Value Number Average Value Number Average Value Number Average Value Number Average Value Number Average Value
LOANS ORIGINATED 20 $79,606 102 $82,893 160 $69,086 26 $15,802 3 $364,693 66 $54,270 APPLICATIONS APPROVED, NOT ACCEPTED 2 $23,420 9 $102,291 47 $59,205 6 $14,910 0 $0 13 $54,904 APPLICATIONS DENIED 7 $69,703 24 $49,861 277 $63,401 49 $15,283 0 $0 36 $46,143 APPLICATIONS WITHDRAWN 4 $124,360 15 $72,457 94 $60,556 6 $30,063 0 $0 15 $54,438 FILES CLOSED FOR INCOMPLETENESS 0 $0 2 $86,410 24 $57,798 0 $0 0 $0 5 $88,540
Aggregated Statistics For Year 2002(Based on 22 partial tracts) A) FHA, FSA/RHS & VA B) Conventional C) Refinancings D) Home Improvement Loans E) Loans on Dwellings For 5+ Families F) Non-occupant Loans on Number Average Value Number Average Value Number Average Value Number Average Value Number Average Value Number Average Value
LOANS ORIGINATED 19 $89,965 86 $61,085 141 $67,998 20 $14,849 2 $168,625 45 $33,606 APPLICATIONS APPROVED, NOT ACCEPTED 5 $106,982 15 $79,370 52 $57,353 11 $17,221 0 $0 14 $62,132 APPLICATIONS DENIED 15 $62,822 14 $37,100 242 $53,647 43 $18,685 0 $0 37 $38,508 APPLICATIONS WITHDRAWN 2 $34,720 4 $50,545 115 $61,313 9 $20,688 0 $0 6 $55,027 FILES CLOSED FOR INCOMPLETENESS 2 $95,555 5 $60,122 57 $88,035 0 $0 0 $0 9 $62,169
Aggregated Statistics For Year 2001(Based on 22 partial tracts) A) FHA, FSA/RHS & VA B) Conventional C) Refinancings D) Home Improvement Loans E) Loans on Dwellings For 5+ Families F) Non-occupant Loans on Number Average Value Number Average Value Number Average Value Number Average Value Number Average Value Number Average Value
LOANS ORIGINATED 24 $67,947 85 $71,111 101 $56,224 34 $9,883 4 $2,166,592 36 $47,850 APPLICATIONS APPROVED, NOT ACCEPTED 1 $95,290 20 $44,788 39 $51,222 11 $22,434 0 $0 14 $54,774 APPLICATIONS DENIED 3 $128,400 45 $51,232 277 $52,922 79 $14,622 1 $117,900 42 $52,194 APPLICATIONS WITHDRAWN 4 $87,915 6 $44,297 134 $63,075 14 $22,410 1 $31,960 5 $48,148 FILES CLOSED FOR INCOMPLETENESS 1 $54,470 3 $61,797 15 $54,765 2 $41,095 0 $0 1 $20,690
Aggregated Statistics For Year 2000(Based on 22 partial tracts) A) FHA, FSA/RHS & VA B) Conventional C) Refinancings D) Home Improvement Loans E) Loans on Dwellings For 5+ Families F) Non-occupant Loans on Number Average Value Number Average Value Number Average Value Number Average Value Number Average Value Number Average Value
LOANS ORIGINATED 34 $68,512 81 $69,031 85 $41,277 49 $7,199 3 $186,633 35 $37,704 APPLICATIONS APPROVED, NOT ACCEPTED 3 $95,103 29 $39,801 52 $43,760 27 $13,037 0 $0 10 $36,816 APPLICATIONS DENIED 6 $47,380 89 $51,788 226 $47,234 64 $22,114 2 $4,121,920 38 $37,788 APPLICATIONS WITHDRAWN 1 $31,210 16 $52,331 97 $43,443 6 $38,765 2 $3,934,560 8 $41,335 FILES CLOSED FOR INCOMPLETENESS 2 $42,805 10 $30,384 26 $40,245 0 $0 0 $0 2 $35,270
Aggregated Statistics For Year 1999(Based on 2 full and 11 partial tracts) A) FHA, FSA/RHS & VA B) Conventional C) Refinancings D) Home Improvement Loans E) Loans on Dwellings For 5+ Families F) Non-occupant Loans on Number Average Value Number Average Value Number Average Value Number Average Value Number Average Value Number Average Value
LOANS ORIGINATED 26 $62,283 55 $94,426 85 $43,920 41 $8,832 2 $1,211,245 33 $38,268 APPLICATIONS APPROVED, NOT ACCEPTED 1 $60,740 12 $44,632 45 $47,805 18 $14,357 0 $0 10 $41,203 APPLICATIONS DENIED 2 $37,130 28 $42,418 153 $46,586 38 $16,786 0 $0 19 $51,581 APPLICATIONS WITHDRAWN 3 $80,207 9 $36,361 75 $42,181 12 $25,000 0 $0 10 $41,478 FILES CLOSED FOR INCOMPLETENESS 2 $51,285 3 $125,260 34 $45,046 0 $0 0 $0 10 $49,486
Private Mortgage Insurance Companies Aggregated Statistics For Year 2009(Based on 8 partial tracts) A) Conventional B) Refinancings Number Average Value Number Average Value
LOANS ORIGINATED 6 $126,155 3 $85,907 APPLICATIONS APPROVED, NOT ACCEPTED 3 $95,723 2 $98,365 APPLICATIONS DENIED 0 $0 1 $42,110 APPLICATIONS WITHDRAWN 0 $0 0 $0 FILES CLOSED FOR INCOMPLETENESS 0 $0 0 $0
Aggregated Statistics For Year 2008(Based on 18 partial tracts) A) Conventional B) Refinancings C) Non-occupant Loans on Number Average Value Number Average Value Number Average Value
LOANS ORIGINATED 33 $83,781 2 $109,605 13 $44,375 APPLICATIONS APPROVED, NOT ACCEPTED 18 $90,068 2 $180,800 13 $62,864 APPLICATIONS DENIED 8 $64,405 0 $0 1 $51,400 APPLICATIONS WITHDRAWN 1 $38,450 0 $0 0 $0 FILES CLOSED FOR INCOMPLETENESS 2 $40,650 1 $42,110 2 $44,150
Aggregated Statistics For Year 2007(Based on 22 partial tracts) A) Conventional B) Refinancings C) Non-occupant Loans on Number Average Value Number Average Value Number Average Value
LOANS ORIGINATED 56 $73,123 5 $43,384 33 $41,689 APPLICATIONS APPROVED, NOT ACCEPTED 13 $108,357 3 $87,143 5 $45,830 APPLICATIONS DENIED 2 $129,035 1 $84,220 1 $35,110 APPLICATIONS WITHDRAWN 4 $44,390 0 $0 4 $40,065 FILES CLOSED FOR INCOMPLETENESS 2 $35,625 0 $0 1 $28,300
Aggregated Statistics For Year 2006(Based on 22 partial tracts) A) Conventional B) Refinancings C) Non-occupant Loans on Number Average Value Number Average Value Number Average Value
LOANS ORIGINATED 44 $67,590 4 $32,772 25 $38,823 APPLICATIONS APPROVED, NOT ACCEPTED 13 $54,432 3 $84,747 10 $35,959 APPLICATIONS DENIED 3 $39,220 0 $0 3 $39,220 APPLICATIONS WITHDRAWN 5 $79,344 0 $0 5 $72,532 FILES CLOSED FOR INCOMPLETENESS 1 $15,200 0 $0 1 $15,200
Aggregated Statistics For Year 2005(Based on 22 partial tracts) A) Conventional B) Refinancings C) Non-occupant Loans on Number Average Value Number Average Value Number Average Value
LOANS ORIGINATED 61 $71,143 11 $74,105 46 $48,823 APPLICATIONS APPROVED, NOT ACCEPTED 5 $32,536 2 $68,160 4 $33,282 APPLICATIONS DENIED 5 $65,518 2 $40,870 5 $47,394 APPLICATIONS WITHDRAWN 4 $33,108 0 $0 4 $33,108 FILES CLOSED FOR INCOMPLETENESS 1 $29,550 0 $0 0 $0
Aggregated Statistics For Year 2004(Based on 18 partial tracts) A) Conventional B) Refinancings C) Non-occupant Loans on Number Average Value Number Average Value Number Average Value
LOANS ORIGINATED 48 $87,659 8 $48,496 14 $48,865 APPLICATIONS APPROVED, NOT ACCEPTED 5 $122,716 2 $51,545 3 $43,843 APPLICATIONS DENIED 1 $39,300 0 $0 1 $22,530 APPLICATIONS WITHDRAWN 3 $83,890 8 $43,632 5 $51,212 FILES CLOSED FOR INCOMPLETENESS 1 $25,150 0 $0 0 $0
Aggregated Statistics For Year 2003(Based on 22 partial tracts) A) Conventional B) Refinancings C) Non-occupant Loans on Number Average Value Number Average Value Number Average Value
LOANS ORIGINATED 51 $75,096 31 $87,969 15 $58,841 APPLICATIONS APPROVED, NOT ACCEPTED 12 $59,123 2 $52,350 6 $32,338 APPLICATIONS DENIED 3 $86,777 0 $0 3 $86,777 APPLICATIONS WITHDRAWN 2 $102,110 0 $0 0 $0 FILES CLOSED FOR INCOMPLETENESS 0 $0 0 $0 0 $0
Aggregated Statistics For Year 2002(Based on 20 partial tracts) A) Conventional B) Refinancings C) Non-occupant Loans on Number Average Value Number Average Value Number Average Value
LOANS ORIGINATED 35 $58,113 17 $95,071 10 $25,625 APPLICATIONS APPROVED, NOT ACCEPTED 10 $44,218 7 $55,906 6 $19,997 APPLICATIONS DENIED 1 $12,580 1 $25,680 1 $12,580 APPLICATIONS WITHDRAWN 2 $23,355 1 $58,520 2 $34,880 FILES CLOSED FOR INCOMPLETENESS 0 $0 0 $0 0 $0
Aggregated Statistics For Year 2001(Based on 22 partial tracts) A) Conventional B) Refinancings C) Non-occupant Loans on Number Average Value Number Average Value Number Average Value
LOANS ORIGINATED 45 $75,378 18 $70,790 6 $27,968 APPLICATIONS APPROVED, NOT ACCEPTED 11 $61,200 1 $59,300 7 $60,684 APPLICATIONS DENIED 2 $90,860 2 $56,745 4 $65,420 APPLICATIONS WITHDRAWN 0 $0 0 $0 0 $0 FILES CLOSED FOR INCOMPLETENESS 0 $0 0 $0 0 $0
Aggregated Statistics For Year 2000(Based on 20 partial tracts) A) Conventional B) Refinancings C) Non-occupant Loans on Number Average Value Number Average Value Number Average Value
LOANS ORIGINATED 46 $84,004 10 $36,494 7 $35,156 APPLICATIONS APPROVED, NOT ACCEPTED 8 $100,224 1 $21,430 3 $34,620 APPLICATIONS DENIED 5 $65,154 2 $164,875 4 $69,322 APPLICATIONS WITHDRAWN 0 $0 0 $0 0 $0 FILES CLOSED FOR INCOMPLETENESS 2 $41,220 0 $0 2 $41,220
Aggregated Statistics For Year 1999(Based on 1 full and 9 partial tracts) A) Conventional B) Refinancings C) Non-occupant Loans on Number Average Value Number Average Value Number Average Value
LOANS ORIGINATED 16 $92,124 10 $57,187 2 $58,300 APPLICATIONS APPROVED, NOT ACCEPTED 3 $78,937 1 $72,030 1 $30,770 APPLICATIONS DENIED 0 $0 0 $0 0 $0 APPLICATIONS WITHDRAWN 1 $68,570 1 $62,690 0 $0 FILES CLOSED FOR INCOMPLETENESS 1 $290,940 0 $0 0 $0
2006 - 2018 National Fire Incident Reporting System (NFIRS) incidents See full 2006 National Fire Incident Reporting System statistics for zip code 14608, New York
Most common first names in zip code 14608 among deceased individuals Name Count Lived (average)
Mary 116 75.1 years John 108 71.0 years James 95 68.0 years William 82 72.8 years Joseph 70 73.6 years Charles 62 69.8 years Robert 60 61.3 years Frank 60 74.4 years Willie 48 61.4 years George 46 74.0 years
Most common last names in zip code 14608 among deceased individuals Last name Count Lived (average)
Jones 55 69.5 years Smith 53 65.5 years Williams 50 65.5 years Brown 46 70.1 years Johnson 35 64.5 years Jackson 34 72.4 years Davis 29 65.0 years Wilson 25 62.1 years Scott 23 68.0 years Thomas 21 69.0 years
Businesses in zip code 14608
Name Count Name Count
ALDI 1 FedEx 1 Cricket Wireless 1 U-Haul 2 Domino's Pizza 1 UPS 3
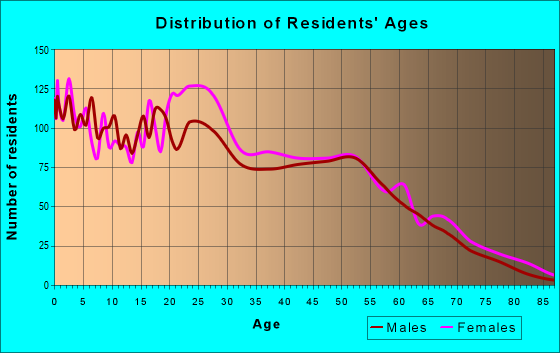
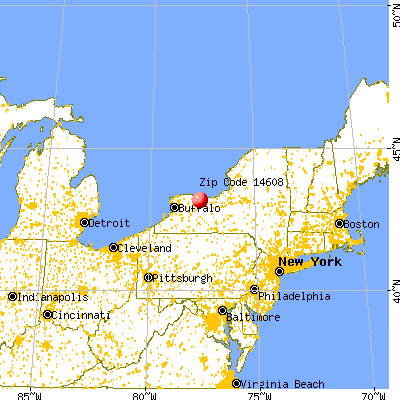


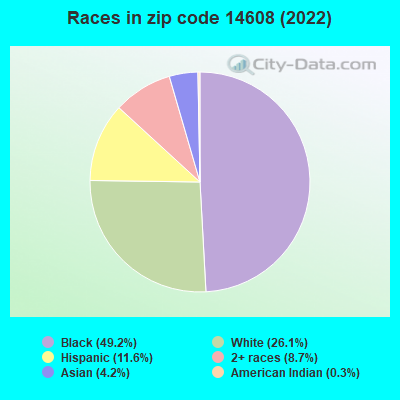


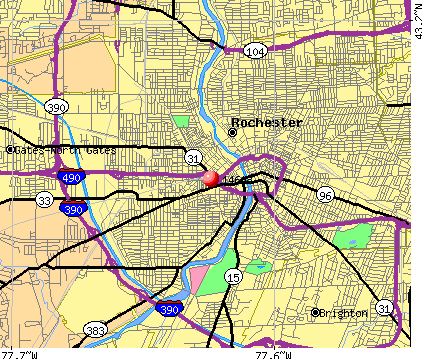 Nearest zip codes: 14614, 14604, 14611, 14605, 14627, 14620.
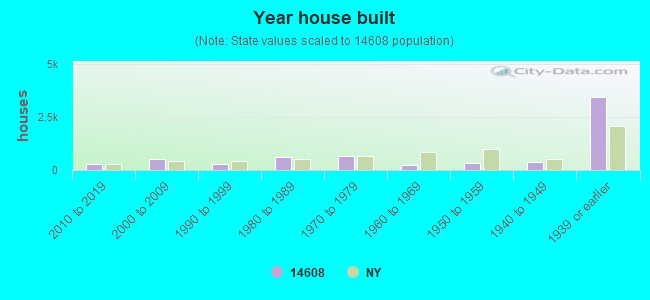
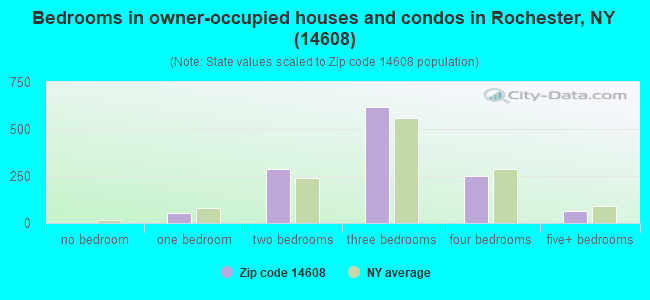
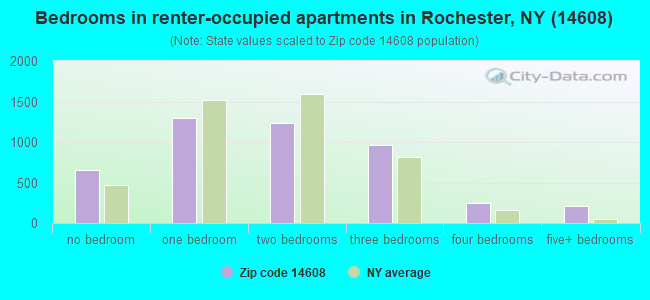
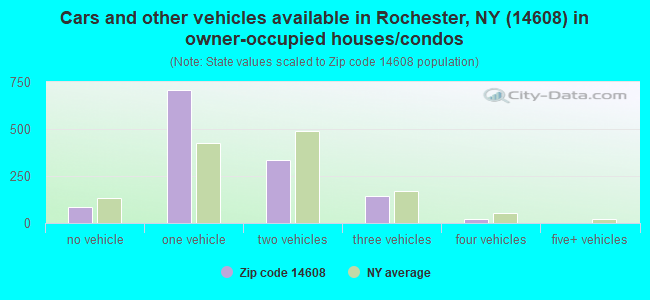
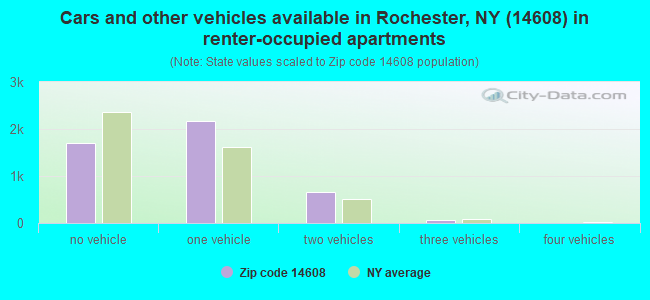


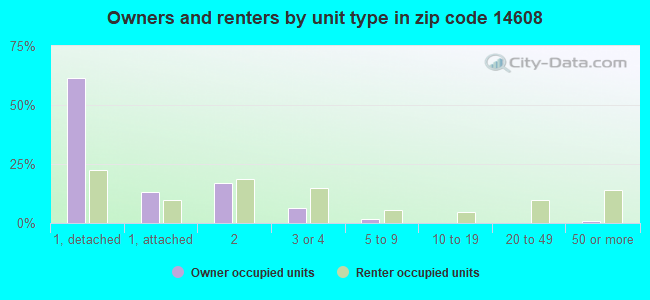
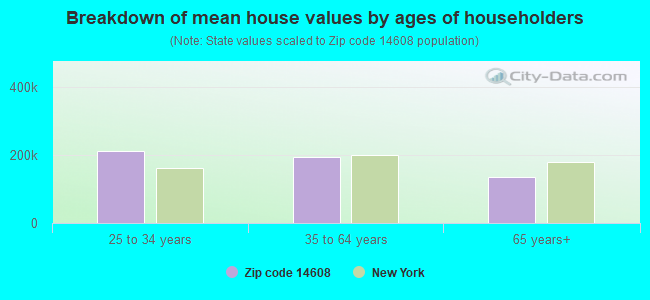


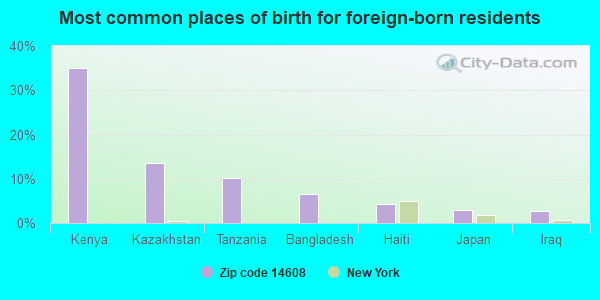
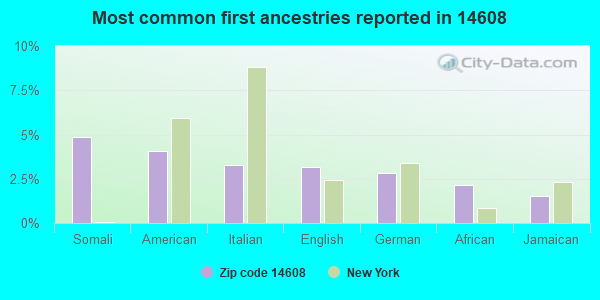
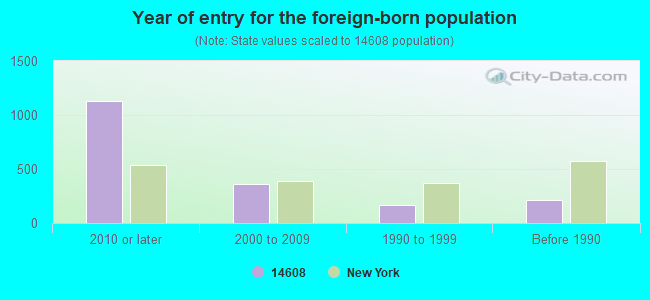


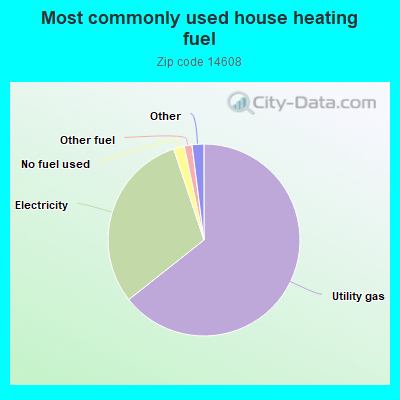
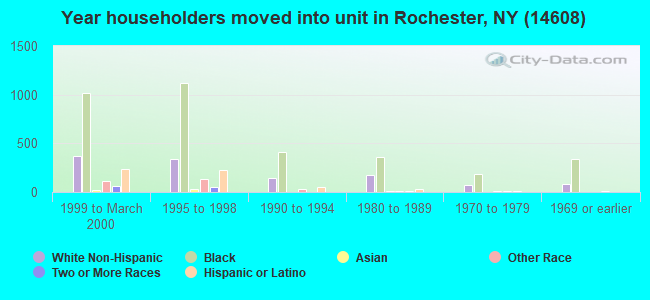
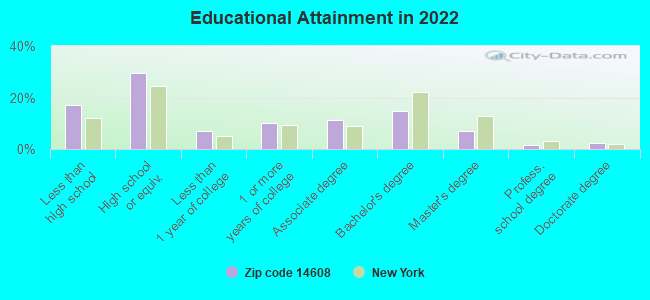
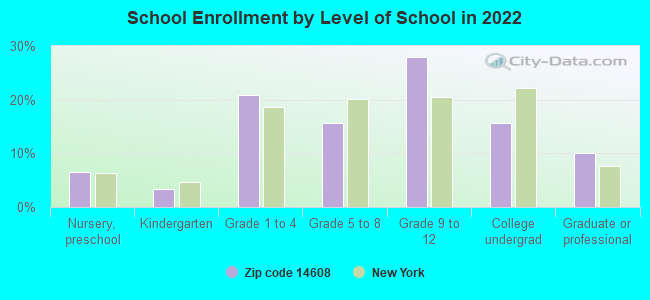
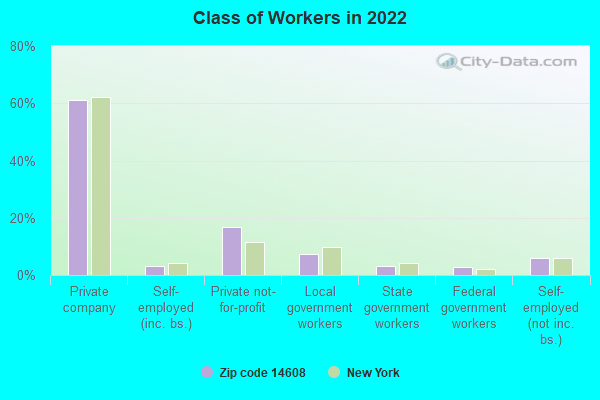
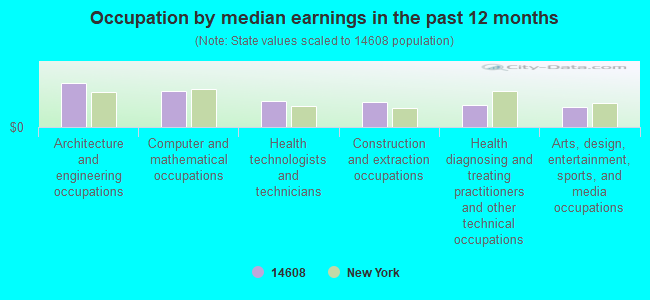
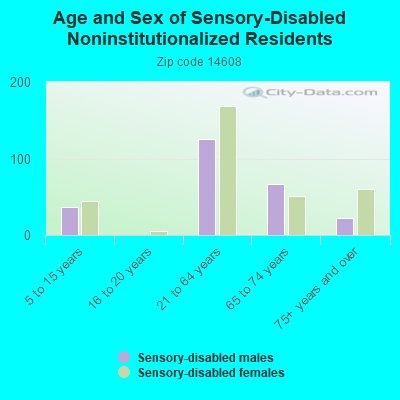
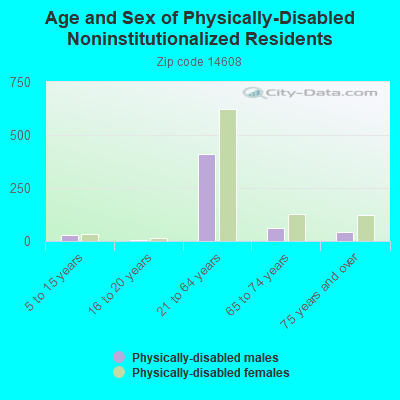
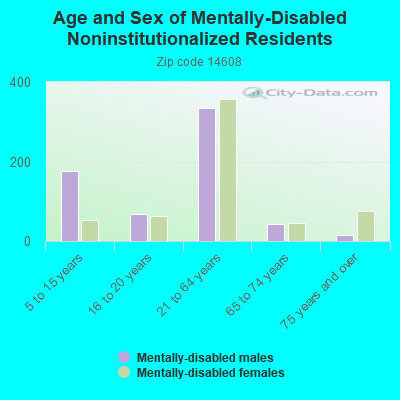
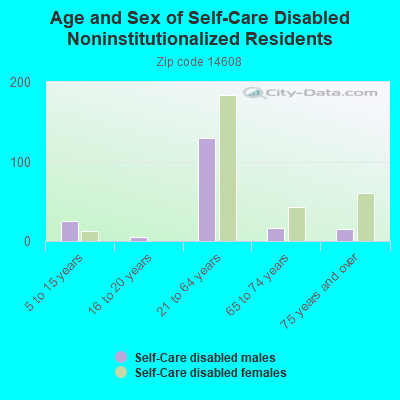
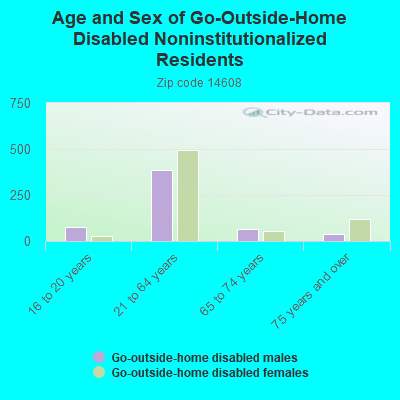
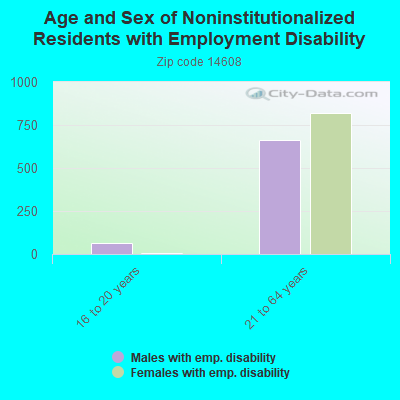
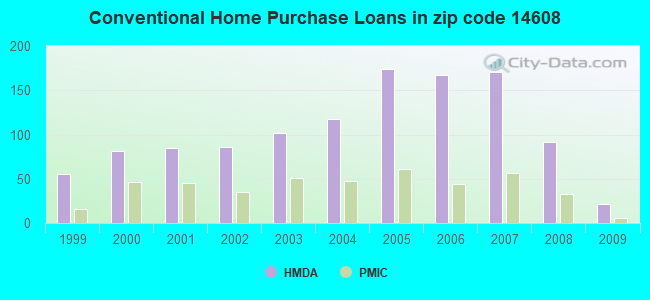
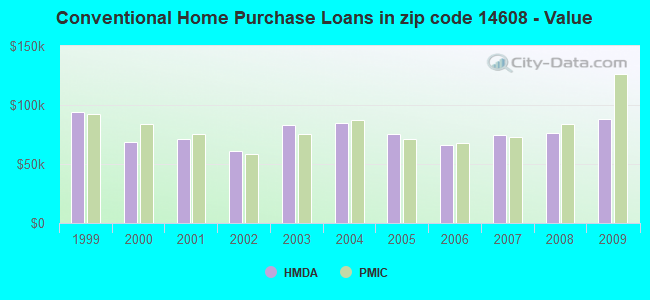
 Based on the data from the years 2006 - 2018 the average number of fires per year is 150. The highest number of fires - 193 took place in 2009, and the least - 118 in 2017. The data has a rising trend.
 When looking into fire subcategories, the most incidents belonged to: Structure Fires (51.4%), and Outside Fires (34.3%).