Estimated zip code population in 2022: 5,432 Zip code population in 2010: 5,726 Zip code population in 2000: 6,106
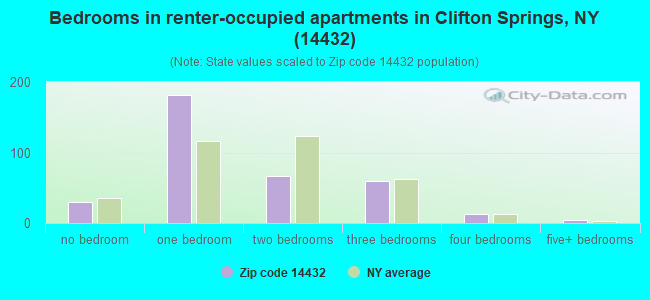
Houses and condos: 2,293 Renter-occupied apartments: 353
% of renters here:
17%
State:
46%
March 2022 cost of living index in zip code 14432: 93.4 (less than average, U.S. average is 100)
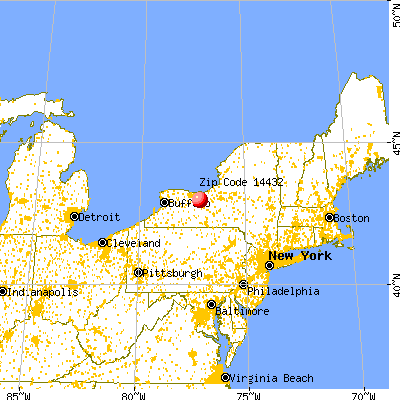
Land area: 38.6 sq. mi. Water area: 0.0 sq. mi.
Population density: 141 people per square mile
(very low).
OSM Map
General Map
Google Map
MSN Map
OSM Map
General Map
Google Map
MSN Map
OSM Map
General Map
Google Map
MSN Map
OSM Map
General Map
Google Map
MSN Map
Please wait while loading the map...
Real estate property taxes paid for housing units in 2022:
This zip code:
2.8% ($4,289)
New York:
1.5% ($6,180)
Median real estate property taxes paid for housing units with mortgages in 2022: $4,431 (2.8%) Median real estate property taxes paid for housing units with no mortgage in 2022: $3,692 (2.7%)
Averages for the 2020 tax year for zip code 14432, filed in 2021:
Average Adjusted Gross Income (AGI) in 2020: $57,300 (Individual Income Tax Returns)
Here:
$57,300
State:
$90,930
Salary/wage: $49,523 (reported on 83.7% of returns)
Here:
$49,523
State:
$72,104
(% of AGI for various income ranges: 1189.2% for AGIs below $25k, 3524.1% for AGIs $25k-50k, 5980.3% for AGIs $50k-75k, 9105.8% for AGIs $75k-100k, 14699.6% for AGIs $100k-200k)
Taxable interest for individuals: $738 (reported on 36.9% of returns)
This zip code:
$738
New York:
$3,075
(% of AGI for various income ranges: 12.3% for AGIs below $25k, 12.5% for AGIs $25k-50k, 43.9% for AGIs $50k-75k, 18.9% for AGIs $75k-100k, 142.9% for AGIs $100k-200k)
Ordinary dividends: $3,411 (reported on 17.5% of returns)
Here:
$3,411
State:
$11,095
(% of AGI for various income ranges: 19.4% for AGIs below $25k, 26.6% for AGIs $25k-50k, 80.0% for AGIs $50k-75k, 61.1% for AGIs $75k-100k, 176.7% for AGIs $100k-200k)
Net capital gain/loss in AGI: +$13,703 (reported on 13.3% of returns)
Here:
+$13,703
State:
+$44,925
(% of AGI for various income ranges: 3.4% for AGIs below $25k, 23.4% for AGIs $25k-50k, 78.2% for AGIs $50k-75k, 85.3% for AGIs $75k-100k, 355.0% for AGIs $100k-200k)
Profit/loss from business: +$7,180 (reported on 9.5% of returns)
Here:
+$7,180
State:
+$14,940
(% of AGI for various income ranges: 42.3% for AGIs below $25k, 17.2% for AGIs $25k-50k, 100.3% for AGIs $50k-75k, 5.8% for AGIs $75k-100k, 466.2% for AGIs $100k-200k)
Taxable individual retirement arrangement distribution: $14,953 (reported on 12.2% of returns)
14432:
$14,953
New York:
$19,609
(% of AGI for various income ranges: 76.2% for AGIs below $25k, 113.8% for AGIs $25k-50k, 272.7% for AGIs $50k-75k, 466.3% for AGIs $75k-100k, 777.9% for AGIs $100k-200k)
Total itemized deductions: $22,862 (reported on 3.0% of returns)
Here:
$22,862
State:
$39,326
(% of AGI for various income ranges: 374.2% for AGIs $50k-75k, 247.5% for AGIs $100k-200k)
Charity contributions: $4,460 (reported on 1.9% of returns)
Here:
$4,460
State:
$15,420
(% of AGI for various income ranges: 4.8% for AGIs $25k-50k, 101.1% for AGIs $75k-100k)
Taxes paid: $7,211 (reported on 3.4% of returns)
14432:
$7,211
State:
$9,183
(% of AGI for various income ranges: 126.7% for AGIs $50k-75k, 96.2% for AGIs $100k-200k)
Earned income credit: $1,930 (reported on 12.5% of returns)
Here:
$1,930
State:
$2,138
(% of AGI for various income ranges: 58.5% for AGIs below $25k, 51.1% for AGIs $25k-50k)
Percentage of individuals using paid preparers for their 2020 taxes: 95.8%
Here:
96%
State:
95%
(% for various income ranges: 93.3% for AGIs below $25k, 96.2% for AGIs $25k-50k, 97.7% for AGIs $50k-75k, 96.2% for AGIs $75k-100k, 97.2% for AGIs $100k-200k, 100.0% for AGIs over 200k)
Averages for the 2012 tax year for zip code 14432, filed in 2013:
Average Adjusted Gross Income (AGI) in 2012: $47,708 (Individual Income Tax Returns)
Here:
$47,708
State:
$77,088
Salary/wage: $41,811 (reported on 85.4% of returns)
Here:
$41,811
State:
$60,593
(% of AGI for various income ranges: 75.6% for AGIs below $25k, 79.1% for AGIs $25k-50k, 78.3% for AGIs $50k-75k, 81.6% for AGIs $75k-100k, 91.3% for AGIs $100k-200k)
Taxable interest for individuals: $600 (reported on 37.7% of returns)
This zip code:
$600
New York:
$3,125
(% of AGI for various income ranges: 0.8% for AGIs below $25k, 0.5% for AGIs $25k-50k, 0.3% for AGIs $50k-75k, 0.6% for AGIs $75k-100k, 0.6% for AGIs $100k-200k)
Ordinary dividends: $2,677 (reported on 18.1% of returns)
Here:
$2,677
State:
$10,299
(% of AGI for various income ranges: 1.1% for AGIs below $25k, 0.9% for AGIs $25k-50k, 0.5% for AGIs $50k-75k, 0.5% for AGIs $75k-100k, 2.3% for AGIs $100k-200k)
Net capital gain/loss in AGI: +$9,503 (reported on 11.5% of returns)
Here:
+$9,503
State:
+$42,474
(% of AGI for various income ranges: 0.2% for AGIs $25k-50k, 1.0% for AGIs $50k-75k, 0.3% for AGIs $75k-100k, 8.6% for AGIs $100k-200k)
Profit/loss from business: +$7,766 (reported on 11.2% of returns)
Here:
+$7,766
State:
+$16,168
(% of AGI for various income ranges: 3.3% for AGIs below $25k, 1.2% for AGIs $25k-50k, 1.7% for AGIs $50k-75k, 0.4% for AGIs $75k-100k, 3.5% for AGIs $100k-200k)
Taxable individual retirement arrangement distribution: $10,541 (reported on 11.2% of returns)
14432:
$10,541
New York:
$17,621
(% of AGI for various income ranges: 3.8% for AGIs below $25k, 2.5% for AGIs $25k-50k, 2.3% for AGIs $50k-75k, 1.9% for AGIs $75k-100k, 3.4% for AGIs $100k-200k)
Total itemized deductions: $17,340 (19% of AGI, reported on 25.0% of returns)
Here:
$17,340
State:
$34,985
Here:
18.8% of AGI
State:
21.3% of AGI
(% of AGI for various income ranges: 5.9% for AGIs below $25k, 5.7% for AGIs $25k-50k, 8.8% for AGIs $50k-75k, 10.2% for AGIs $75k-100k, 16.2% for AGIs $100k-200k)
Charity contributions: $2,298 (reported on 19.2% of returns)
Here:
$2,298
State:
$5,572
(% of AGI for various income ranges: 0.5% for AGIs below $25k, 0.4% for AGIs $25k-50k, 0.8% for AGIs $50k-75k, 0.8% for AGIs $75k-100k, 2.2% for AGIs $100k-200k)
Taxes paid: $8,934 (reported on 25.0% of returns)
14432:
$8,934
State:
$18,656
(% of AGI for various income ranges: 1.7% for AGIs below $25k, 2.3% for AGIs $25k-50k, 3.5% for AGIs $50k-75k, 4.9% for AGIs $75k-100k, 10.5% for AGIs $100k-200k)
Earned income credit: $2,112 (reported on 16.5% of returns)
Here:
$2,112
State:
$2,230
(% of AGI for various income ranges: 5.6% for AGIs below $25k, 0.9% for AGIs $25k-50k)
Percentage of individuals using paid preparers for their 2012 taxes: 52.3%
Here:
52%
State:
66%
(% for various income ranges: 46.5% for AGIs below $25k, 56.5% for AGIs $25k-50k, 52.5% for AGIs $50k-75k, 60.0% for AGIs $75k-100k, 60.9% for AGIs $100k-200k)
Averages for the 2004 tax year for zip code 14432, filed in 2005:
Average Adjusted Gross Income (AGI) in 2004: $39,242 (Individual Income Tax Returns)
Here:
$39,242
State:
$59,519
Salary/wage: $36,855 (reported on 86.4% of returns)
Here:
$36,855
State:
$50,673
(% of AGI for various income ranges: 101.9% for AGIs below $10k, 75.4% for AGIs $10k-25k, 83.4% for AGIs $25k-50k, 79.7% for AGIs $50k-75k, 87.9% for AGIs $75k-100k, 74.9% for AGIs over 100k)
Taxable interest for individuals: $759 (reported on 50.0% of returns)
This zip code:
$759
New York:
$2,377
(% of AGI for various income ranges: 5.4% for AGIs below $10k, 1.8% for AGIs $10k-25k, 0.8% for AGIs $25k-50k, 0.8% for AGIs $50k-75k, 0.7% for AGIs $75k-100k, 0.7% for AGIs over 100k)
Taxable dividends: $1,538 (reported on 22.5% of returns)
Here:
$1,538
State:
$5,394
(% of AGI for various income ranges: 2.8% for AGIs below $10k, 1.3% for AGIs $10k-25k, 0.6% for AGIs $25k-50k, 0.6% for AGIs $50k-75k, 0.7% for AGIs $75k-100k, 1.4% for AGIs over 100k)
Net capital gain/loss: +$3,065 (reported on 15.8% of returns)
Here:
+$3,065
State:
+$23,581
(% of AGI for various income ranges: -1.1% for AGIs below $10k, 0.5% for AGIs $10k-25k, 0.9% for AGIs $25k-50k, 1.1% for AGIs $50k-75k, 0.5% for AGIs $75k-100k, 3.1% for AGIs over 100k)
Profit/loss from business: +$7,673 (reported on 11.7% of returns)
Here:
+$7,673
State:
+$13,809
(% of AGI for various income ranges: 3.7% for AGIs below $10k, 3.2% for AGIs $10k-25k, 2.1% for AGIs $25k-50k, 1.7% for AGIs $50k-75k, 1.8% for AGIs $75k-100k, 3.0% for AGIs over 100k)
IRA payment deduction: $2,559 (reported on 2.3% of returns)
14432:
$2,559
New York:
$3,115
Self-employed pension: $5,500 (reported on 0.5% of returns)
Here:
$5,500
New York:
$19,016
Total itemized deductions: $14,247 (21% of AGI, reported on 27.5% of returns)
Here:
$14,247
State:
$25,864
Here:
20.9% of AGI
State:
21.9% of AGI
(% of AGI for various income ranges: 6.1% for AGIs below $10k, 6.5% for AGIs $10k-25k, 8.1% for AGIs $25k-50k, 10.4% for AGIs $50k-75k, 13.5% for AGIs $75k-100k, 11.0% for AGIs over 100k)
Charity contributions deductions: $1,956 (3% of AGI, reported on 24.4% of returns)
Here:
$1,956
State:
$4,439
Here:
2.8% of AGI
State:
3.6% of AGI
(% of AGI for various income ranges: 0.6% for AGIs $10k-25k, 0.8% for AGIs $25k-50k, 1.1% for AGIs $50k-75k, 1.6% for AGIs $75k-100k, 2.0% for AGIs over 100k)
Total tax: $4,748 (reported on 75.7% of returns)
14432:
$4,748
State:
$11,730
(% of AGI for various income ranges: 2.3% for AGIs below $10k, 4.1% for AGIs $10k-25k, 6.9% for AGIs $25k-50k, 8.2% for AGIs $50k-75k, 10.4% for AGIs $75k-100k, 15.6% for AGIs over 100k)
Earned income credit: $1,662 (reported on 12.9% of returns)
Here:
$1,662
State:
$1,757
Percentage of individuals using paid preparers for their 2004 taxes: 58.1%
Here:
58%
State:
67%
(% for various income ranges: 43.6% for AGIs below $10k, 60.0% for AGIs $10k-25k, 60.2% for AGIs $25k-50k, 67.4% for AGIs $50k-75k, 63.9% for AGIs $75k-100k, 57.1% for AGIs over 100k)
Household received Food Stamps/SNAP in the past 12 months: 197 Household did not receive Food Stamps/SNAP in the past 12 months: 1,890
Women who had a birth in the past 12 months: 40 (28 now married, 12 unmarried) Women who did not have a birth in the past 12 months: 1,042 (456 now married, 582 unmarried)
Housing units in zip code 14432 with a mortgage: 1,006 (80 second mortgage, 58 both second mortgage and home equity loan) Houses without a mortgage: 148
Median monthly owner costs for units with a mortgage: $1,307 Median monthly owner costs for units without a mortgage: $731
Residents with income below the poverty level in 2022:
This zip code:
12.4%
Whole state:
14.3%
Residents with income below 50% of the poverty level in 2022:
This zip code:
4.1%
Whole state:
6.8%
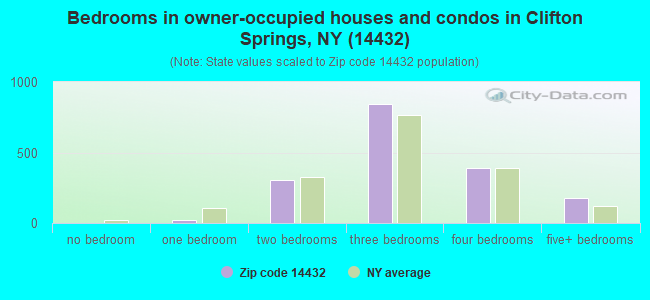
Median number of rooms in houses and condos:
Here:
6.8
State:
6.3
Median number of rooms in apartments:
Here:
3.7
State:
3.8
Notable locations in this zip code not listed on our city pages
Notable locations in zip code 14432: Reedland Farms (A), Hemdale Farms (B), Half Dutch Farm (C), Will-O-Crest Farms (D), Pedersen Farms (E), Clifton Springs Country Club (F), Warner Corners (G), Clifton Springs Rest Area (H), Clifton Springs Village Wastewater Treatment Plant (I), Woodbury Hall (J), Clifton Springs Village Hall (K), Foster Building (L), Clifton Manor (M), Ashton Place Adult Care Facility (N), Clifton Springs Library (O), Clifton Springs Fire Department (P), Seneca Castle Fire District (Q). Display/hide their locations on the map
Churches in zip code 14432 include: First Baptist Church (A), Saint Johns Episcopal Church (B), Saint Felix Roman Catholic Church (C), Church of the Nazarene (D), Clifton Springs United Methodist Church (E). Display/hide their locations on the map
Cemeteries: Riverview Cemetery (1), Saint Agnes Cemetery (2), Clifton Springs Cemetery (3), Herrington Cemetery (4), Orleans Cemetery (5), Buchan Cemetery (6), Macaulay Cemetery (7). Display/hide their locations on the map
In group quarters: 229 (-1 institutionalized population)
Size of family households: 646 2-persons, 327 3-persons, 158 4-persons, 181 5-persons, 42 6-persons, 24 7-or-more-persons
Size of nonfamily households: 576 1-person, 136 2-persons, 9 3-persons
797 married couples with children.
300 single-parent households (141 men, 159 women).
98.5% of residents of 14432 zip code speak English at home.
1.0% of residents speak Spanish at home (69% very well, 31% well).
0.4% of residents speak other Indo-European language at home (100% very well).
0.1% of residents speak Asian or Pacific Island language at home (100% not at all).
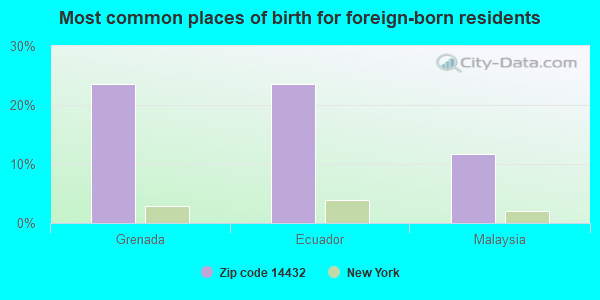
Foreign born population: 17 (0.3%) (73.2% of them are naturalized citizens)
This zip code:
0.3%
Whole state:
22.7%
24%Grenada
24%Ecuador
12%Malaysia
19%Italian
12%German
11%American
10%English
5%Irish
4%European
4%Dutch
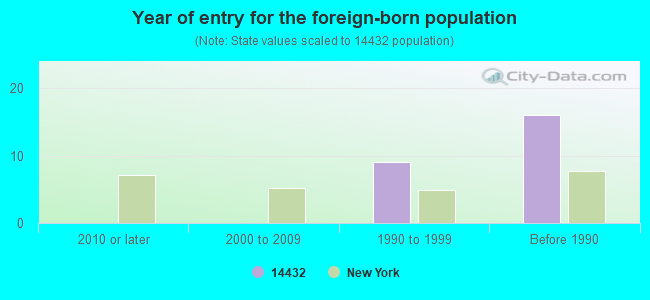
Year of entry for the foreign-born population
02010 or later
02000 to 2009
91990 to 1999
16Before 1990
Facilities with environmental interests located in this zip code:
CLIFTON SPRINGS HOSPITAL & CLINIC (2 COULTER ROAD in CLIFTON SPRINGS, NY)
AIR MINOR (AIRS/AFS) STATE MASTER (New York facility tracking) - REFUSE DISPOSAL, National Pollutant Discharge Elimination System Permit, AIR PROGRAM, Conditionally Exempt Small Quantity Generators, less than 100 kg/month of hazardous waste (Resource Conservation and Recovery Act (tracking hazardous waste)) - notification - ICIS-, ENFORCEMENT/COMPLIANCE ACTIVITY, ICIS-02-2005-0850, Business SIC and NAICS classification: GENERAL MEDICAL AND SURGICAL HOSPITALS Organizations: CLIFTON SPRING HOSPITAL - CLINIC (CONTACT/OWNER)
Alternative names: CLIFTON SPRING HOSP, CLIFTON SPRINGS HOSPITAL - CLINIC
CLIFTON SPRINGS - V WWTP (LADUE AVENUE in CLIFTON SPRINGS, NY)
STATE MASTER (New York facility tracking) - SOLID WASTE PROGRAM, REFUSE DISPOSAL, National Pollutant Discharge Elimination System Permit, SOLID WASTE PROGRAM, GRANTS AND PLANNING, National Pollutant Discharge Elimination System Permit National Pollutant Discharge Elimination System NON-MAJOR (Tracking pollutant discharge elimination systems) - permit - ICIS-, ENFORCEMENT/COMPLIANCE ACTIVITY Business SIC classification: SEWERAGE SYSTEMS Business NAICS classification: SEWAGE TREATMENT FACILITIES. Organizations: CLIFTON SPRINGS (V) (CONTACT/OWNER)
Alternative names: CLIFTON SPRINGS (V)
CLIFTON SPRINGS HOSPITAL BARN (7 RAILROAD AVE in CLIFTON SPRINGS, NY)
Small Quantity Generators, between 100 kg and 1000 kg of hazardous waste/month (Resource Conservation and Recovery Act (tracking hazardous waste))
CLIFTON SPRINGS VILLAGE OF (25 KENDALL ST in CLIFTON SPRINGS, NY)
(Resource Conservation and Recovery Act (tracking hazardous waste))
IVAN IZAC AUTOMOTIVE (2720 COUNTY RD 25 in CLIFTON SPRINGS, NY)
Small Quantity Generators, between 100 kg and 1000 kg of hazardous waste/month (Resource Conservation and Recovery Act (tracking hazardous waste)) - notification Organizations: DENNIS BAKER (CONTACT/OWNER)
BI-CON SERVICES INC - COMPRESSOR STA 237 (2001 ARCHER RD HAZ MAT BLDG in CLIFTON SPRINGS, NY)
Conditionally Exempt Small Quantity Generators, less than 100 kg/month of hazardous waste (Resource Conservation and Recovery Act (tracking hazardous waste)) - notification Organizations: TENNESEE GAS PIPELINE (CONTACT/OWNER)
CLIFTON SPRINGS VILLAGE OF WWTP (50 LADUE AVE in CLIFTON SPRINGS, NY)
Conditionally Exempt Small Quantity Generators, less than 100 kg/month of hazardous waste (Resource Conservation and Recovery Act (tracking hazardous waste)) - notification Organizations: VILLAGE OF CLIFTON SPRINGS (CONTACT/OWNER)
Housing units lacking complete plumbing facilities: 2.2% Housing units lacking complete kitchen facilities: 3.5%
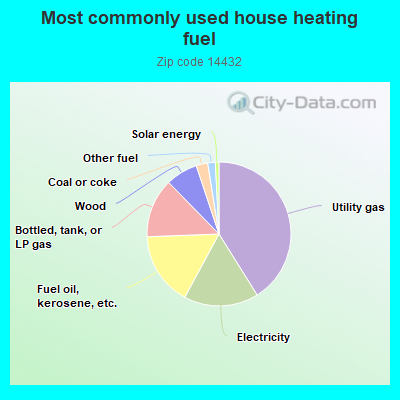
41.1%Utility gas
16.8%Electricity
16.5%Fuel oil, kerosene, etc.
13.3%Bottled, tank, or LP gas
7.2%Wood
2.6%Coal or coke
1.7%Other fuel
0.8%Solar energy
Population in 1990: 5,060. Population change in the 1990s: +1,046 (+20.7%).
Place of birth for U.S.-born residents:
This state: 4,900
Northeast: 122
Midwest: 153
South: 150
West: 61
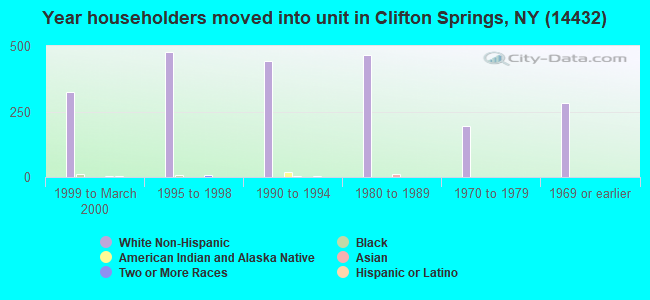
66% of the 14432 zip code residents lived in the same house 5 years ago. Out of people who lived in different houses, 64% lived in this county. Out of people who lived in different counties, 50% lived in New York.
92% of the 14432 zip code residents lived in the same house 1 year ago. Out of people who lived in different houses, 53% moved from this county. Out of people who lived in different houses, 39% moved from different county within same state. Out of people who lived in different houses, 6% moved from abroad.
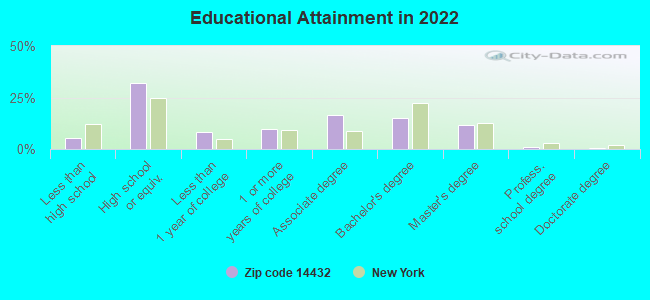
Private vs. public school enrollment:
Students in private schools in grades 1 to 8 (elementary and middle school): 99
Here:
12.8%
New York:
15.6%
Students in private schools in grades 9 to 12 (high school): 41
Here:
19.1%
New York:
15.0%
Students in private undergraduate colleges: 57
Here:
57.3%
New York:
39.2%
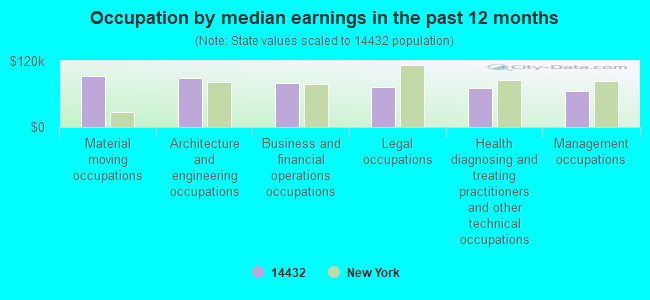
Occupation by median earnings in the past 12 months ($)
92,354Material moving occupations
89,788Architecture and engineering occupations
79,133Business and financial operations occupations
73,161Legal occupations
71,498Health diagnosing and treating practitioners and other technical occupations
64,752Management occupations
Companies with federal contracts located in this zip code:
G W LISK COMPANY INC (2 SOUTH ST in CLIFTON SPRING, NY; small business) : $4,005,557 in 129 contractsfrom 1999 to 2006
Contracts for Aircraft Hydraulic, Vacuum, and De-icing System Components, Combination and Miscellaneous Instruments, Relays and Solenoids, Miscellaneous Electrical and Electronic Components, and moreby Defense Logistics Agency, NASA, Navy Signed by year:2000: $480,104; 2001: $499,088; 2002: $1,114,203; 2003: $290,957; 2004: $580,382; 2005: $542,971; 2006: $232,380.
Biggest contracts:
$563,760 with Defense Logistics Agency for Aircraft Hydraulic, Vacuum, and De-icing System Components. Signed on 2002-05-13. Completion date: 2003-03-17.
$265,472 with Defense Logistics Agency for Combination and Miscellaneous Instruments. Signed on 1999-10-08. Completion date: 2000-06-23.
$133,920 with Defense Logistics Agency for Aircraft Hydraulic, Vacuum, and De-icing System Components. Signed on 2000-03-20. Completion date: 2000-09-16.
$133,920, same as above.Signed on 2000-03-20. Completion date: 2000-06-18.
Top industries in this zip code by the number of employees in 2005:
Health Care and Social Assistance: General Medical and Surgical Hospitals (500-999 employees: 1 establishment)
Accommodation and Food Services: Limited-Service Restaurants (100-249: 1, 1-4: 2)
Administrative and Support and Waste Management and Remediation Services: Professional Employer Organizations (100-249: 1)
Health Care and Social Assistance: Offices of Physicians (except Mental Health Specialists) (20-49: 2, 10-19: 2, 5-9: 3, 1-4: 5)
Health Care and Social Assistance: Ambulance Services (50-99: 1)
Finance and Insurance: Commercial Banking (50-99: 1)
Accommodation and Food Services: Full-Service Restaurants (20-49: 1, 10-19: 1)
Real Estate and Rental and Leasing: Lessors of Residential Buildings and Dwellings (20-49: 1, 5-9: 1)
People in group quarters in 2010:
171 people in nursing facilities/skilled-nursing facilities
22 people in group homes intended for adults
8 people in residential treatment centers for adults
People in group quarters in 2000:
108 people in nursing homes
65 people in homes for the mentally retarded
36 people in homes or halfway houses for drug/alcohol abuse
12 people in hospitals/wards and hospices for chronically ill
12 people in hospices or homes for chronically ill
Fatal accident statistics in 2013:
Fatal accident count: 1
Vehicles involved in fatal accidents: 2
Fatal accidents caused by drunken drivers: 0
Fatalities: 1
Persons involved in fatal accidents: 2
Pedestrians involved in fatal accidents: 0
Fatal accident statistics in 2012:
Fatal accident count: 1
Vehicles involved in fatal accidents: 1
Fatal accidents caused by drunken drivers: 0
Fatalities: 1
Persons involved in fatal accidents: 1
Pedestrians involved in fatal accidents: 0
Home Mortgage Disclosure Act Aggregated Statistics For Year 2009 (Based on 8 partial tracts)
A) FHA, FSA/RHS & VA Home Purchase Loans
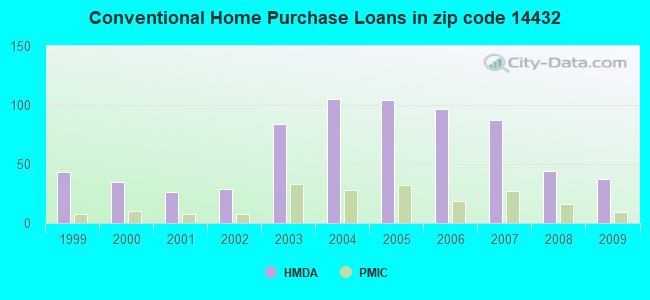
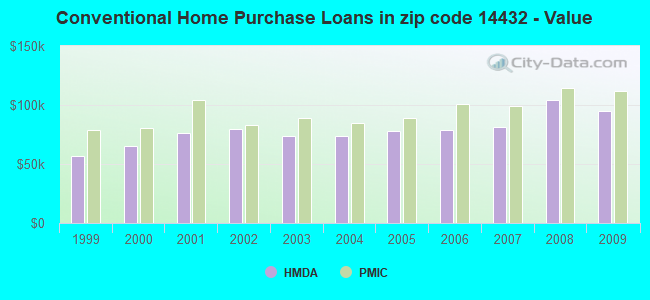
B) Conventional Home Purchase Loans
C) Refinancings
D) Home Improvement Loans
F) Non-occupant Loans on < 5 Family Dwellings (A B C & D)
G) Loans On Manufactured Home Dwelling (A B C & D)
Number
Average Value
Number
Average Value
Number
Average Value
Number
Average Value
Number
Average Value
Number
Average Value
LOANS ORIGINATED
37
$100,422
37
$94,532
117
$94,780
54
$27,664
9
$87,338
18
$43,467
APPLICATIONS APPROVED, NOT ACCEPTED
2
$97,160
4
$70,800
7
$83,206
3
$26,837
1
$36,300
3
$59,340
APPLICATIONS DENIED
16
$101,659
16
$57,986
51
$99,626
23
$25,603
4
$102,312
22
$48,173
APPLICATIONS WITHDRAWN
3
$104,393
4
$103,515
28
$104,194
2
$18,050
1
$167,820
2
$59,830
FILES CLOSED FOR INCOMPLETENESS
2
$108,555
0
$0
8
$104,169
1
$8,650
0
$0
1
$111,560
Aggregated Statistics For Year 2008 (Based on 8 partial tracts)
A) FHA, FSA/RHS & VA Home Purchase Loans
B) Conventional Home Purchase Loans
C) Refinancings
D) Home Improvement Loans
E) Loans on Dwellings For 5+ Families
F) Non-occupant Loans on < 5 Family Dwellings (A B C & D)
G) Loans On Manufactured Home Dwelling (A B C & D)
Number
Average Value
Number
Average Value
Number
Average Value
Number
Average Value
Number
Average Value
Number
Average Value
Number
Average Value
LOANS ORIGINATED
27
$100,800
44
$104,250
65
$78,855
76
$22,425
1
$106,370
6
$47,298
14
$46,266
APPLICATIONS APPROVED, NOT ACCEPTED
2
$82,755
11
$58,875
10
$73,593
4
$32,878
0
$0
1
$37,910
7
$48,959
APPLICATIONS DENIED
9
$81,709
18
$62,800
83
$110,639
52
$27,171
0
$0
3
$43,147
27
$51,674
APPLICATIONS WITHDRAWN
2
$94,710
1
$52,630
26
$114,454
8
$98,494
0
$0
1
$64,860
1
$10,910
FILES CLOSED FOR INCOMPLETENESS
3
$73,723
2
$27,945
6
$98,743
3
$39,350
0
$0
0
$0
0
$0
Aggregated Statistics For Year 2007 (Based on 8 partial tracts)
A) FHA, FSA/RHS & VA Home Purchase Loans
B) Conventional Home Purchase Loans
C) Refinancings
D) Home Improvement Loans
F) Non-occupant Loans on < 5 Family Dwellings (A B C & D)
G) Loans On Manufactured Home Dwelling (A B C & D)
Number
Average Value
Number
Average Value
Number
Average Value
Number
Average Value
Number
Average Value
Number
Average Value
LOANS ORIGINATED
23
$105,119
87
$81,275
93
$80,055
109
$20,188
11
$77,191
36
$46,338
APPLICATIONS APPROVED, NOT ACCEPTED
5
$91,614
23
$71,950
19
$95,535
13
$34,635
1
$51,890
18
$62,701
APPLICATIONS DENIED
10
$90,168
37
$62,144
145
$89,648
68
$32,093
9
$56,656
40
$47,142
APPLICATIONS WITHDRAWN
3
$79,840
16
$67,473
52
$99,565
6
$42,058
1
$173,290
4
$44,642
FILES CLOSED FOR INCOMPLETENESS
1
$97,970
2
$145,220
10
$93,707
1
$42,980
0
$0
0
$0
Aggregated Statistics For Year 2006 (Based on 8 partial tracts)
A) FHA, FSA/RHS & VA Home Purchase Loans
B) Conventional Home Purchase Loans
C) Refinancings
D) Home Improvement Loans
E) Loans on Dwellings For 5+ Families
F) Non-occupant Loans on < 5 Family Dwellings (A B C & D)
G) Loans On Manufactured Home Dwelling (A B C & D)
Number
Average Value
Number
Average Value
Number
Average Value
Number
Average Value
Number
Average Value
Number
Average Value
Number
Average Value
LOANS ORIGINATED
20
$96,354
97
$78,832
135
$77,095
91
$21,098
1
$65,430
8
$62,739
25
$45,480
APPLICATIONS APPROVED, NOT ACCEPTED
3
$59,220
25
$58,215
31
$89,393
9
$41,343
0
$0
2
$72,070
15
$43,013
APPLICATIONS DENIED
4
$90,452
35
$60,628
136
$87,557
57
$29,855
0
$0
4
$60,455
28
$43,171
APPLICATIONS WITHDRAWN
2
$90,170
8
$77,030
80
$90,592
10
$61,634
1
$68,320
1
$124,730
4
$64,035
FILES CLOSED FOR INCOMPLETENESS
0
$0
10
$68,912
21
$94,328
1
$115,230
0
$0
1
$78,760
0
$0
Aggregated Statistics For Year 2005 (Based on 8 partial tracts)
A) FHA, FSA/RHS & VA Home Purchase Loans
B) Conventional Home Purchase Loans
C) Refinancings
D) Home Improvement Loans
F) Non-occupant Loans on < 5 Family Dwellings (A B C & D)
G) Loans On Manufactured Home Dwelling (A B C & D)
Number
Average Value
Number
Average Value
Number
Average Value
Number
Average Value
Number
Average Value
Number
Average Value
LOANS ORIGINATED
20
$95,398
104
$77,946
111
$82,107
82
$18,739
14
$70,573
31
$43,403
APPLICATIONS APPROVED, NOT ACCEPTED
2
$84,530
20
$63,858
25
$75,883
7
$26,003
1
$48,780
14
$51,379
APPLICATIONS DENIED
5
$82,476
45
$63,864
182
$94,878
55
$22,353
8
$57,552
44
$55,170
APPLICATIONS WITHDRAWN
1
$83,890
16
$82,279
118
$95,764
17
$69,927
6
$91,565
7
$65,590
FILES CLOSED FOR INCOMPLETENESS
0
$0
4
$100,632
29
$114,054
3
$40,773
0
$0
0
$0
Aggregated Statistics For Year 2004 (Based on 8 partial tracts)
A) FHA, FSA/RHS & VA Home Purchase Loans
B) Conventional Home Purchase Loans
C) Refinancings
D) Home Improvement Loans
E) Loans on Dwellings For 5+ Families
F) Non-occupant Loans on < 5 Family Dwellings (A B C & D)
G) Loans On Manufactured Home Dwelling (A B C & D)
Number
Average Value
Number
Average Value
Number
Average Value
Number
Average Value
Number
Average Value
Number
Average Value
Number
Average Value
LOANS ORIGINATED
22
$85,384
105
$73,908
173
$76,726
67
$21,841
1
$9,630
9
$71,497
32
$40,776
APPLICATIONS APPROVED, NOT ACCEPTED
3
$96,663
20
$61,478
31
$82,068
9
$37,763
0
$0
1
$52,850
16
$58,474
APPLICATIONS DENIED
8
$82,126
36
$50,454
155
$77,806
48
$23,369
0
$0
8
$45,641
47
$38,604
APPLICATIONS WITHDRAWN
2
$95,285
10
$79,057
120
$84,950
12
$31,659
0
$0
2
$70,840
6
$76,163
FILES CLOSED FOR INCOMPLETENESS
1
$80,430
2
$90,695
22
$93,435
2
$50,300
0
$0
1
$46,850
0
$0
Aggregated Statistics For Year 2003 (Based on 8 partial tracts)
A) FHA, FSA/RHS & VA Home Purchase Loans
B) Conventional Home Purchase Loans
C) Refinancings
D) Home Improvement Loans
F) Non-occupant Loans on < 5 Family Dwellings (A B C & D)
Number
Average Value
Number
Average Value
Number
Average Value
Number
Average Value
Number
Average Value
LOANS ORIGINATED
24
$82,361
84
$73,881
300
$76,957
50
$11,664
9
$55,580
APPLICATIONS APPROVED, NOT ACCEPTED
1
$64,820
29
$55,684
35
$77,593
4
$8,898
0
$0
APPLICATIONS DENIED
6
$68,113
29
$51,144
160
$77,529
32
$16,013
2
$41,355
APPLICATIONS WITHDRAWN
2
$57,585
13
$74,532
85
$84,796
6
$16,853
0
$0
FILES CLOSED FOR INCOMPLETENESS
1
$90,440
5
$53,306
9
$78,757
2
$18,650
0
$0
Aggregated Statistics For Year 2002 (Based on 4 partial tracts)
A) FHA, FSA/RHS & VA Home Purchase Loans
B) Conventional Home Purchase Loans
C) Refinancings
D) Home Improvement Loans
F) Non-occupant Loans on < 5 Family Dwellings (A B C & D)
Number
Average Value
Number
Average Value
Number
Average Value
Number
Average Value
Number
Average Value
LOANS ORIGINATED
9
$73,748
29
$79,686
87
$74,455
27
$11,021
2
$60,970
APPLICATIONS APPROVED, NOT ACCEPTED
1
$102,720
5
$43,632
18
$59,958
3
$11,107
0
$0
APPLICATIONS DENIED
3
$78,440
11
$43,762
43
$70,464
10
$12,928
1
$87,890
APPLICATIONS WITHDRAWN
2
$55,210
3
$114,747
38
$70,897
3
$28,017
0
$0
FILES CLOSED FOR INCOMPLETENESS
1
$32,720
0
$0
9
$78,078
2
$8,685
0
$0
Aggregated Statistics For Year 2001 (Based on 4 partial tracts)
A) FHA, FSA/RHS & VA Home Purchase Loans
B) Conventional Home Purchase Loans
C) Refinancings
D) Home Improvement Loans
F) Non-occupant Loans on < 5 Family Dwellings (A B C & D)
Number
Average Value
Number
Average Value
Number
Average Value
Number
Average Value
Number
Average Value
LOANS ORIGINATED
12
$76,923
26
$76,600
65
$70,586
28
$11,373
4
$64,892
APPLICATIONS APPROVED, NOT ACCEPTED
1
$44,120
7
$51,074
7
$64,779
6
$16,627
1
$90,030
APPLICATIONS DENIED
0
$0
15
$56,551
42
$65,048
12
$12,443
3
$51,590
APPLICATIONS WITHDRAWN
1
$90,210
4
$59,205
36
$78,727
3
$16,733
0
$0
FILES CLOSED FOR INCOMPLETENESS
1
$69,130
0
$0
5
$62,800
1
$27,790
0
$0
Aggregated Statistics For Year 2000 (Based on 4 partial tracts)
A) FHA, FSA/RHS & VA Home Purchase Loans
B) Conventional Home Purchase Loans
C) Refinancings
D) Home Improvement Loans
F) Non-occupant Loans on < 5 Family Dwellings (A B C & D)
Number
Average Value
Number
Average Value
Number
Average Value
Number
Average Value
Number
Average Value
LOANS ORIGINATED
8
$81,266
35
$65,044
23
$52,437
27
$13,502
3
$69,487
APPLICATIONS APPROVED, NOT ACCEPTED
1
$91,710
10
$56,177
8
$58,590
7
$15,556
1
$32,210
APPLICATIONS DENIED
3
$64,160
31
$46,011
28
$49,136
15
$23,107
2
$45,895
APPLICATIONS WITHDRAWN
2
$59,490
2
$63,685
13
$69,339
2
$28,660
0
$0
FILES CLOSED FOR INCOMPLETENESS
0
$0
0
$0
7
$81,901
0
$0
0
$0
Aggregated Statistics For Year 1999 (Based on 3 partial tracts)
A) FHA, FSA/RHS & VA Home Purchase Loans
B) Conventional Home Purchase Loans
C) Refinancings
D) Home Improvement Loans
F) Non-occupant Loans on < 5 Family Dwellings (A B C & D)
2002 - 2018 National Fire Incident Reporting System (NFIRS) incidents
According to the data from the years 2002 - 2018 the average number of fire incidents per year is 21. The highest number of reported fires - 42 took place in 2018, and the least - 3 in 2002. The data has a rising trend.
When looking into fire subcategories, the most reports belonged to: Structure Fires (50.7%), and Outside Fires (30.0%).
Fire incident types reported to NFIRS in Zip Code 14432


 Nearest zip codes: 14537, 14504, 14548, 14532, 14522, 14561.


 According to the data from the years 2002 - 2018 the average number of fire incidents per year is 21. The highest number of reported fires - 42 took place in 2018, and the least - 3 in 2002. The data has a rising trend.
 When looking into fire subcategories, the most reports belonged to: Structure Fires (50.7%), and Outside Fires (30.0%).