Estimated zip code population in 2022: 3,101 Zip code population in 2010: 2,915 Zip code population in 2000: 2,836
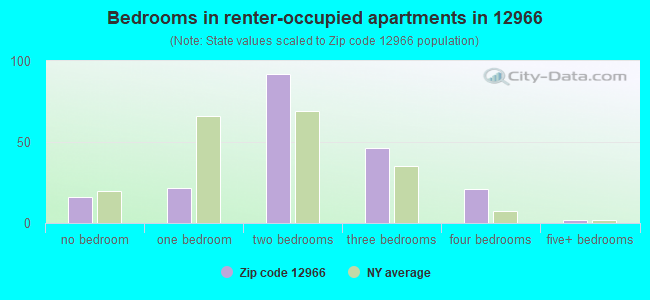
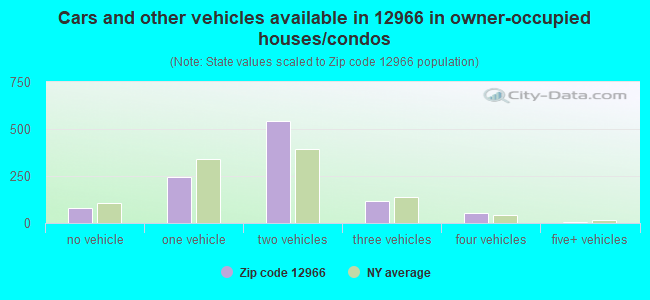
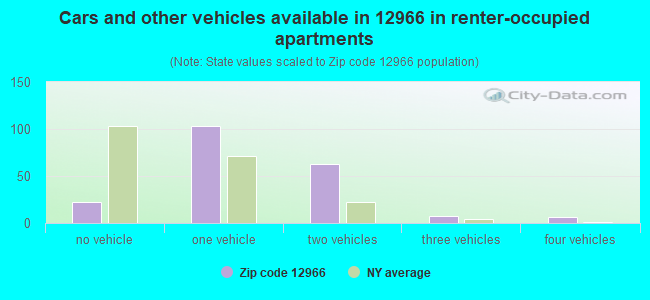
Houses and condos: 1,436 Renter-occupied apartments: 200
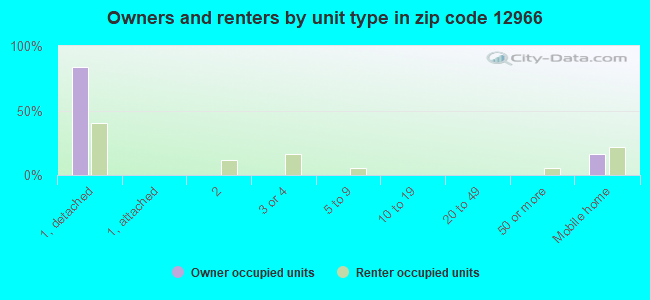
% of renters here:
16%
State:
46%
March 2022 cost of living index in zip code 12966: 93.3 (less than average, U.S. average is 100)
Land area: 86.2 sq. mi. Water area: 0.1 sq. mi.
Population density: 36 people per square mile
(very low).
OSM Map
General Map
Google Map
MSN Map
OSM Map
General Map
Google Map
MSN Map
OSM Map
General Map
Google Map
MSN Map
OSM Map
General Map
Google Map
MSN Map
Please wait while loading the map...
Real estate property taxes paid for housing units in 2022:
This zip code:
1.6% ($1,901)
New York:
1.5% ($6,180)
Median real estate property taxes paid for housing units with mortgages in 2022: $2,173 (1.5%) Median real estate property taxes paid for housing units with no mortgage in 2022: $1,651 (1.6%)
Business Search- 14 Million verified businesses
Males: 1,570
(50.6%)
Females: 1,531
(49.4%)
For population 25 years and over in 12966:
High school or higher: 85.0%
Bachelor's degree or higher: 18.5%
Graduate or professional degree: 4.2%
Unemployed: 5.6%
Mean travel time to work (commute): 22.8 minutes
For population 15 years and over in 12966:
Never married: 23.3%
Now married: 56.7%
Separated: 1.4%
Widowed: 6.2%
Divorced: 12.4%
Zip code 12966 compared to state average:
Median house value significantly below state average.
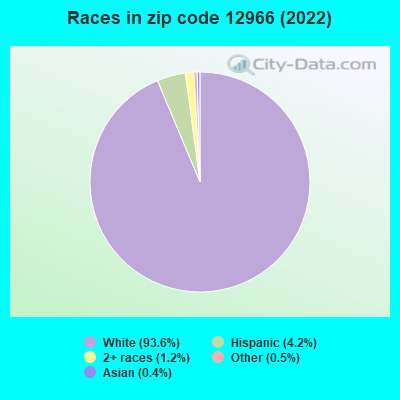
Black race population percentage significantly below state average.
Hispanic race population percentage significantly below state average.
Foreign-born population percentage significantly below state average.
Renting percentage significantly below state average.
Number of rooms per house above state average.
Number of college students below state average.
Percentage of population with a bachelor's degree or higher significantly below state average.
Averages for the 2020 tax year for zip code 12966, filed in 2021:
Average Adjusted Gross Income (AGI) in 2020: $51,337 (Individual Income Tax Returns)
Here:
$51,337
State:
$90,930
Salary/wage: $46,346 (reported on 82.9% of returns)
Here:
$46,346
State:
$72,104
(% of AGI for various income ranges: 1224.8% for AGIs below $25k, 3557.1% for AGIs $25k-50k, 5975.0% for AGIs $50k-75k, 10222.9% for AGIs $75k-100k, 15028.0% for AGIs $100k-200k)
Taxable interest for individuals: $675 (reported on 26.0% of returns)
This zip code:
$675
New York:
$3,075
(% of AGI for various income ranges: 3.0% for AGIs below $25k, 8.1% for AGIs $25k-50k, 30.0% for AGIs $50k-75k, 4.3% for AGIs $75k-100k, 126.0% for AGIs $100k-200k)
Ordinary dividends: $740 (reported on 8.1% of returns)
Here:
$740
State:
$11,095
(% of AGI for various income ranges: 3.7% for AGIs below $25k, 16.1% for AGIs $50k-75k, 35.0% for AGIs $100k-200k)
Net capital gain/loss in AGI: +$14,444 (reported on 7.3% of returns)
Here:
+$14,444
State:
+$44,925
(% of AGI for various income ranges: 15.2% for AGIs below $25k, 97.2% for AGIs $50k-75k, 1084.0% for AGIs $100k-200k)
Profit/loss from business: +$2,569 (reported on 13.0% of returns)
Here:
+$2,569
State:
+$14,940
(% of AGI for various income ranges: 97.4% for AGIs below $25k, 67.1% for AGIs $25k-50k, 7.8% for AGIs $50k-75k)
Taxable individual retirement arrangement distribution: $8,900 (reported on 5.7% of returns)
12966:
$8,900
New York:
$19,609
(% of AGI for various income ranges: 111.9% for AGIs $25k-50k, 394.3% for AGIs $75k-100k)
Earned income credit: $2,177 (reported on 17.9% of returns)
Here:
$2,177
State:
$2,138
(% of AGI for various income ranges: 94.8% for AGIs below $25k, 71.9% for AGIs $25k-50k)
Percentage of individuals using paid preparers for their 2020 taxes: 97.6%
Here:
98%
State:
95%
(% for various income ranges: 94.6% for AGIs below $25k, 97.4% for AGIs $25k-50k, 100.0% for AGIs $50k-75k, 100.0% for AGIs $75k-100k, 100.0% for AGIs $100k-200k)
Averages for the 2012 tax year for zip code 12966, filed in 2013:
Average Adjusted Gross Income (AGI) in 2012: $40,122 (Individual Income Tax Returns)
Here:
$40,122
State:
$77,088
Salary/wage: $38,254 (reported on 85.8% of returns)
Here:
$38,254
State:
$60,593
(% of AGI for various income ranges: 80.6% for AGIs below $25k, 79.2% for AGIs $25k-50k, 83.2% for AGIs $50k-75k, 89.6% for AGIs $75k-100k, 76.1% for AGIs $100k-200k)
Taxable interest for individuals: $724 (reported on 27.5% of returns)
This zip code:
$724
New York:
$3,125
(% of AGI for various income ranges: 1.3% for AGIs below $25k, 0.7% for AGIs $25k-50k, 0.4% for AGIs $50k-75k, 0.2% for AGIs $100k-200k)
Ordinary dividends: $718 (reported on 9.2% of returns)
Here:
$718
State:
$10,299
(% of AGI for various income ranges: 0.3% for AGIs $25k-50k, 0.2% for AGIs $50k-75k, 0.2% for AGIs $75k-100k)
Net capital gain/loss in AGI: +$4,167 (reported on 7.5% of returns)
Here:
+$4,167
State:
+$42,474
(% of AGI for various income ranges: 0.6% for AGIs below $25k, 1.0% for AGIs $25k-50k, 1.7% for AGIs $50k-75k, 0.2% for AGIs $75k-100k)
Profit/loss from business: +$688 (reported on 14.2% of returns)
Here:
+$688
State:
+$16,168
(% of AGI for various income ranges: 3.0% for AGIs below $25k, 0.6% for AGIs $50k-75k)
Taxable individual retirement arrangement distribution: $7,700 (reported on 4.2% of returns)
12966:
$7,700
New York:
$17,621
Total itemized deductions: $15,526 (21% of AGI, reported on 15.8% of returns)
Here:
$15,526
State:
$34,985
Here:
20.6% of AGI
State:
21.3% of AGI
(% of AGI for various income ranges: 5.9% for AGIs $25k-50k, 5.7% for AGIs $50k-75k, 8.7% for AGIs $75k-100k, 9.2% for AGIs $100k-200k)
Charity contributions: $1,893 (reported on 11.7% of returns)
Here:
$1,893
State:
$5,572
(% of AGI for various income ranges: 0.3% for AGIs $25k-50k, 0.3% for AGIs $50k-75k, 0.6% for AGIs $75k-100k, 1.6% for AGIs $100k-200k)
Taxes paid: $6,216 (reported on 15.8% of returns)
12966:
$6,216
State:
$18,656
(% of AGI for various income ranges: 1.6% for AGIs $25k-50k, 2.1% for AGIs $50k-75k, 3.7% for AGIs $75k-100k, 4.7% for AGIs $100k-200k)
Earned income credit: $2,355 (reported on 24.2% of returns)
Here:
$2,355
State:
$2,230
(% of AGI for various income ranges: 7.2% for AGIs below $25k, 1.5% for AGIs $25k-50k)
Percentage of individuals using paid preparers for their 2012 taxes: 64.2%
Here:
64%
State:
66%
(% for various income ranges: 54.7% for AGIs below $25k, 66.7% for AGIs $25k-50k, 73.7% for AGIs $50k-75k, 72.7% for AGIs $75k-100k, 85.7% for AGIs $100k-200k)
Averages for the 2004 tax year for zip code 12966, filed in 2005:
Average Adjusted Gross Income (AGI) in 2004: $32,011 (Individual Income Tax Returns)
Here:
$32,011
State:
$59,519
Salary/wage: $31,064 (reported on 85.2% of returns)
Here:
$31,064
State:
$50,673
(% of AGI for various income ranges: 161.5% for AGIs below $10k, 80.5% for AGIs $10k-25k, 83.9% for AGIs $25k-50k, 86.1% for AGIs $50k-75k, 80.4% for AGIs $75k-100k, 63.4% for AGIs over 100k)
Taxable interest for individuals: $801 (reported on 38.9% of returns)
This zip code:
$801
New York:
$2,377
(% of AGI for various income ranges: 7.2% for AGIs below $10k, 1.3% for AGIs $10k-25k, 1.2% for AGIs $25k-50k, 0.8% for AGIs $50k-75k, 0.3% for AGIs $75k-100k, 0.2% for AGIs over 100k)
Taxable dividends: $775 (reported on 12.5% of returns)
Here:
$775
State:
$5,394
(% of AGI for various income ranges: 2.5% for AGIs below $10k, 0.1% for AGIs $10k-25k, 0.4% for AGIs $25k-50k, 0.3% for AGIs $50k-75k, 0.2% for AGIs $75k-100k)
Net capital gain/loss: +$3,454 (reported on 11.4% of returns)
Here:
+$3,454
State:
+$23,581
(% of AGI for various income ranges: -0.8% for AGIs below $10k, 1.0% for AGIs $10k-25k, 1.0% for AGIs $25k-50k, 0.4% for AGIs $50k-75k, 5.4% for AGIs $75k-100k)
Profit/loss from business: +$317 (reported on 14.2% of returns)
Here:
+$317
State:
+$13,809
(% of AGI for various income ranges: 15.1% for AGIs below $10k, 2.8% for AGIs $10k-25k, -1.4% for AGIs $25k-50k, -0.2% for AGIs $50k-75k, -0.6% for AGIs $75k-100k)
IRA payment deduction: $1,895 (reported on 1.7% of returns)
12966:
$1,895
New York:
$3,115
Total itemized deductions: $14,550 (23% of AGI, reported on 17.6% of returns)
Here:
$14,550
State:
$25,864
Here:
23.2% of AGI
State:
21.9% of AGI
(% of AGI for various income ranges: 4.3% for AGIs $10k-25k, 6.3% for AGIs $25k-50k, 10.5% for AGIs $50k-75k, 10.1% for AGIs $75k-100k, 9.9% for AGIs over 100k)
Charity contributions deductions: $2,000 (3% of AGI, reported on 15.7% of returns)
Here:
$2,000
State:
$4,439
Here:
3.2% of AGI
State:
3.6% of AGI
(% of AGI for various income ranges: 0.8% for AGIs $10k-25k, 0.7% for AGIs $25k-50k, 0.9% for AGIs $50k-75k, 1.9% for AGIs $75k-100k, 1.4% for AGIs over 100k)
Total tax: $3,635 (reported on 69.6% of returns)
12966:
$3,635
State:
$11,730
(% of AGI for various income ranges: 6.6% for AGIs below $10k, 3.6% for AGIs $10k-25k, 5.8% for AGIs $25k-50k, 7.9% for AGIs $50k-75k, 10.2% for AGIs $75k-100k, 16.8% for AGIs over 100k)
Earned income credit: $1,694 (reported on 22.4% of returns)
Here:
$1,694
State:
$1,757
Percentage of individuals using paid preparers for their 2004 taxes: 73.0%
Here:
73%
State:
67%
(% for various income ranges: 68.1% for AGIs below $10k, 72.2% for AGIs $10k-25k, 74.2% for AGIs $25k-50k, 75.6% for AGIs $50k-75k, 73.1% for AGIs $75k-100k, 96.4% for AGIs over 100k)
Household received Food Stamps/SNAP in the past 12 months: 218 Household did not receive Food Stamps/SNAP in the past 12 months: 1,027
Women who had a birth in the past 12 months: 51 (47 now married, 3 unmarried) Women who did not have a birth in the past 12 months: 615 (273 now married, 339 unmarried)
Housing units in zip code 12966 with a mortgage: 490 (66 second mortgage, 67 both second mortgage and home equity loan) Houses without a mortgage: 4
Median monthly owner costs for units with a mortgage: $1,261 Median monthly owner costs for units without a mortgage: $456
Residents with income below the poverty level in 2022:
This zip code:
18.0%
Whole state:
14.3%
Residents with income below 50% of the poverty level in 2022:
This zip code:
13.0%
Whole state:
6.8%
Median number of rooms in houses and condos:
Here:
7.0
State:
6.3
Median number of rooms in apartments:
Here:
4.3
State:
3.8
Notable locations in this zip code not listed on our city pages
Notable locations in zip code 12966: Bangor Station (A), Plumb Hill Farm (B), Papas Dairy (C), Bangor Fire Department (D). Display/hide their locations on the map
Streams, rivers, and creeks: East Branch Little Salmon River (A), Develin Brook (B), Cady Brook (C), Limekiln Brook (D). Display/hide their locations on the map
523 married couples with children.
300 single-parent households (122 men, 178 women).
90.8% of residents of 12966 zip code speak English at home.
0.7% of residents speak Spanish at home (90% very well, 5% well, 5% not well).
7.7% of residents speak other Indo-European language at home (74% very well, 23% well, 3% not well).
0.1% of residents speak Asian or Pacific Island language at home (75% very well, 25% well).
0.1% of residents speak other language at home (100% very well).
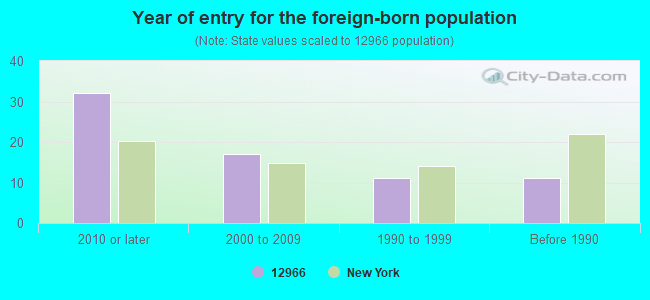
Foreign born population: 59 (1.9%) (22.2% of them are naturalized citizens)
This zip code:
1.9%
Whole state:
22.7%
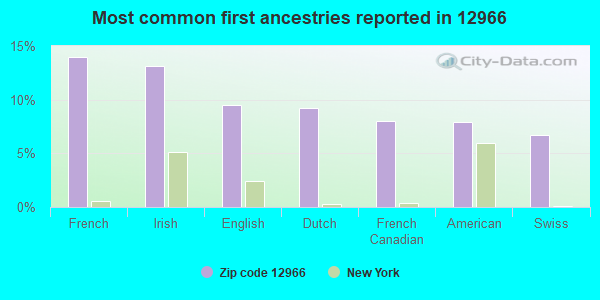
14%French
13%Irish
9%English
9%Dutch
8%French Canadian
8%American
7%Swiss
Year of entry for the foreign-born population
322010 or later
172000 to 2009
111990 to 1999
11Before 1990
Facilities with environmental interests located in this zip code:
BANGOR WD (TOWN OF BAUGOR in NORTH BANGOR, NY)
(Integrated Compliance Information System) - ICIS-02-2000-8236, FORMAL ENFORCEMENT ACTION Business SIC classification: WATER SUPPLY
FRANKLIN COUNTY BIN 3337760 (CO RTE 8 FAY BRUSHTON RD OVER in BANGOR, NY)
(Resource Conservation and Recovery Act (tracking hazardous waste)) Organizations: FRANKLIN COUNTY HIGHWAY DEPT (CONTACT/OWNER)
Housing units lacking complete plumbing facilities: 3.7% Housing units lacking complete kitchen facilities: 3.2%
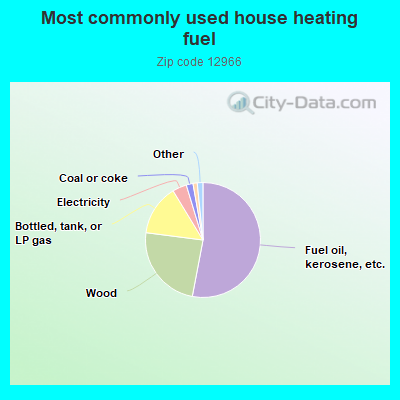
53.1%Fuel oil, kerosene, etc.
24.1%Wood
14.3%Bottled, tank, or LP gas
4.0%Electricity
1.9%Coal or coke
1.2%Other fuel
0.9%Utility gas
0.7%No fuel used
Population in 1990: 2,867.
Place of birth for U.S.-born residents:
This state: 2,508
Northeast: 368
Midwest: 34
South: 73
West: 38
70% of the 12966 zip code residents lived in the same house 5 years ago. Out of people who lived in different houses, 82% lived in this county. Out of people who lived in different counties, 50% lived in New York.
94% of the 12966 zip code residents lived in the same house 1 year ago. Out of people who lived in different houses, 92% moved from this county. Out of people who lived in different houses, 3% moved from different county within same state.
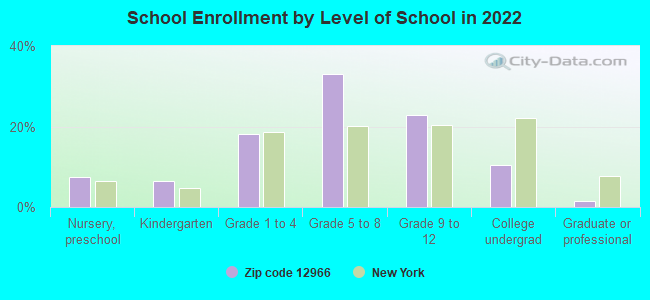
Private vs. public school enrollment:
Students in private schools in grades 1 to 8 (elementary and middle school): 94
Here:
24.2%
New York:
15.6%
Students in private schools in grades 9 to 12 (high school):
Here:
0.0%
New York:
15.0%
Students in private undergraduate colleges: 7
Here:
9.8%
New York:
39.2%
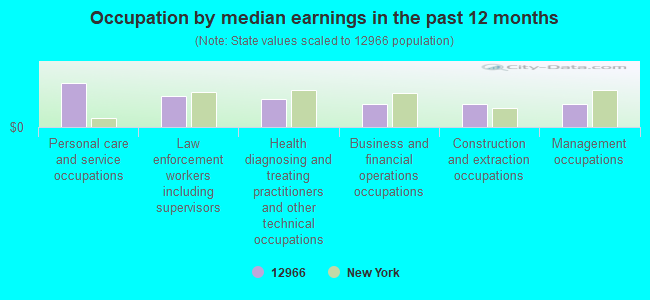
Occupation by median earnings in the past 12 months ($)
104,626Personal care and service occupations
74,407Law enforcement workers including supervisors
66,400Health diagnosing and treating practitioners and other technical occupations
55,478Business and financial operations occupations
54,837Construction and extraction occupations
53,713Management occupations
Top industries in this zip code by the number of employees in 2005:
Accommodation and Food Services: Full-Service Restaurants (20-49 employees: 1 establishment)
Other Services (except Public Administration): Religious Organizations (1-4: 2)
Construction: Masonry Contractors (1-4: 2)
Other Services (except Public Administration): Business Associations (1-4: 1)
Professional, Scientific, and Technical Services: Architectural Services (1-4: 1)
People in group quarters in 2000:
3 people in homes or halfway houses for drug/alcohol abuse
2 people in homes for the mentally retarded
Fatal accident statistics in 2012:
Fatal accident count: 1
Vehicles involved in fatal accidents: 2
Fatal accidents caused by drunken drivers: 2
Fatalities: 1
Persons involved in fatal accidents: 2
Pedestrians involved in fatal accidents: 0
Fatal accident statistics in 2011:
Fatal accident count: 1
Vehicles involved in fatal accidents: 1
Fatal accidents caused by drunken drivers: 0
Fatalities: 1
Persons involved in fatal accidents: 3
Pedestrians involved in fatal accidents: 0
2002 - 2018 National Fire Incident Reporting System (NFIRS) incidents
Based on the data from the years 2002 - 2018 the average number of fire incidents per year is 19. The highest number of fire incidents - 32 took place in 2005, and the least - 2 in 2016. The data has a declining trend.
When looking into fire subcategories, the most incidents belonged to: Structure Fires (45.3%), and Outside Fires (35.4%).
Fire incident types reported to NFIRS in Zip Code 12966

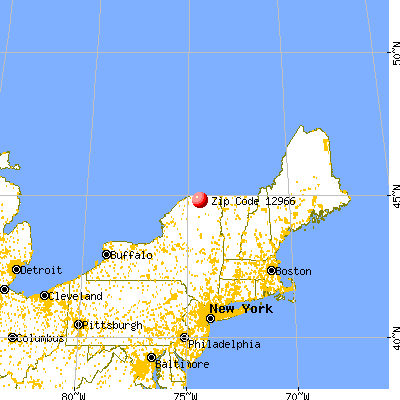


 Nearest zip codes: 12916, 12930, 12957, 12953, 12937, 12926.


 Based on the data from the years 2002 - 2018 the average number of fire incidents per year is 19. The highest number of fire incidents - 32 took place in 2005, and the least - 2 in 2016. The data has a declining trend.
 When looking into fire subcategories, the most incidents belonged to: Structure Fires (45.3%), and Outside Fires (35.4%).