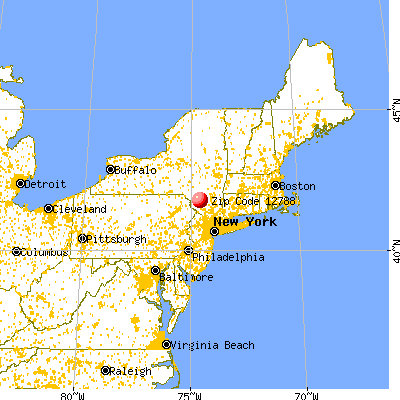
Estimated zip code population in 2022: 2,795 Zip code population in 2010: 2,908 Zip code population in 2000: 2,935
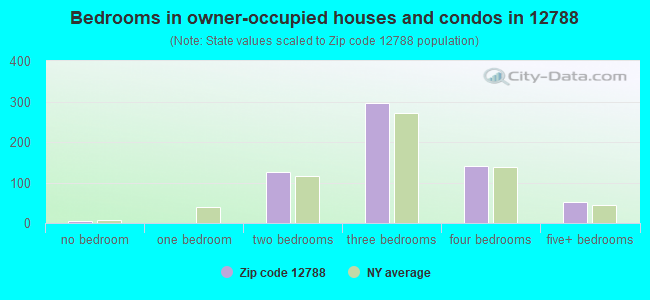
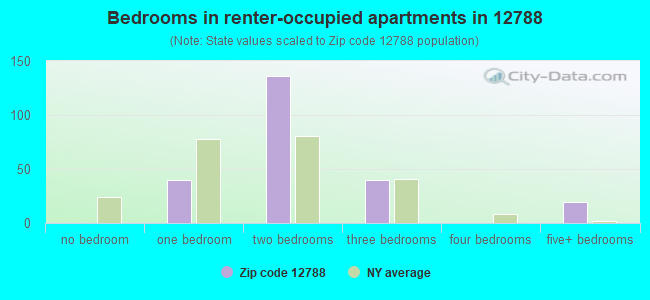
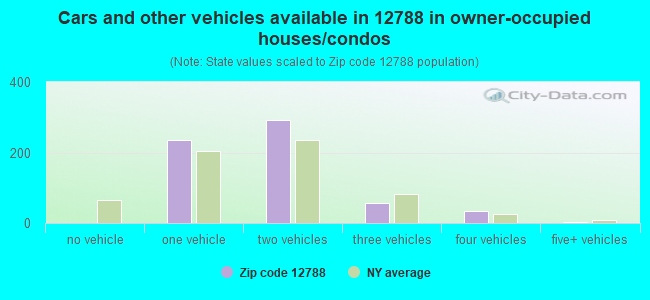
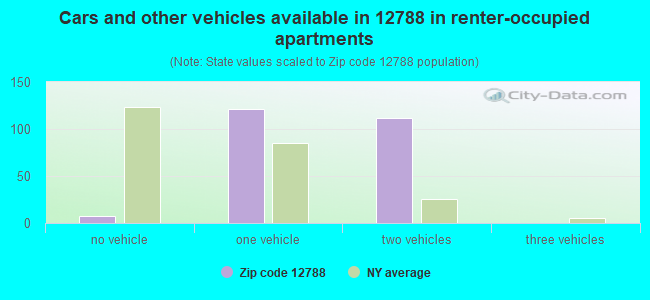
Houses and condos: 1,209 Renter-occupied apartments: 241
% of renters here:
28%
State:
46%
March 2022 cost of living index in zip code 12788: 95.3 (near average, U.S. average is 100)
Land area: 23.5 sq. mi. Water area: 0.2 sq. mi.
Population density: 119 people per square mile
(very low).
OSM Map
General Map
Google Map
MSN Map
OSM Map
General Map
Google Map
MSN Map
OSM Map
General Map
Google Map
MSN Map
OSM Map
General Map
Google Map
MSN Map
Please wait while loading the map...
Real estate property taxes paid for housing units in 2022:
This zip code:
1.3% ($3,099)
New York:
1.5% ($6,180)
Median real estate property taxes paid for housing units with mortgages in 2022: $3,505 (1.9%) Median real estate property taxes paid for housing units with no mortgage in 2022: $2,801 (1.2%)
Averages for the 2020 tax year for zip code 12788, filed in 2021:
Average Adjusted Gross Income (AGI) in 2020: $53,365 (Individual Income Tax Returns)
Here:
$53,365
State:
$90,930
Salary/wage: $48,408 (reported on 77.7% of returns)
Here:
$48,408
State:
$72,104
(% of AGI for various income ranges: 1124.8% for AGIs below $25k, 3314.2% for AGIs $25k-50k, 6282.5% for AGIs $50k-75k, 8751.2% for AGIs $75k-100k, 20463.8% for AGIs $100k-200k)
Taxable interest for individuals: $742 (reported on 29.5% of returns)
This zip code:
$742
New York:
$3,075
(% of AGI for various income ranges: 10.0% for AGIs below $25k, 14.6% for AGIs $25k-50k, 35.0% for AGIs $50k-75k, 32.5% for AGIs $75k-100k, 145.0% for AGIs $100k-200k)
Ordinary dividends: $2,513 (reported on 13.4% of returns)
Here:
$2,513
State:
$11,095
(% of AGI for various income ranges: 26.5% for AGIs below $25k, 33.8% for AGIs $25k-50k, 18.3% for AGIs $50k-75k, 66.2% for AGIs $75k-100k, 191.2% for AGIs $100k-200k)
Net capital gain/loss in AGI: +$4,200 (reported on 11.6% of returns)
Here:
+$4,200
State:
+$44,925
(% of AGI for various income ranges: 6.1% for AGIs below $25k, 21.9% for AGIs $25k-50k, 28.3% for AGIs $50k-75k, 77.5% for AGIs $75k-100k, 473.8% for AGIs $100k-200k)
Profit/loss from business: +$4,788 (reported on 15.2% of returns)
Here:
+$4,788
State:
+$14,940
(% of AGI for various income ranges: 150.4% for AGIs below $25k, 56.9% for AGIs $25k-50k, 186.7% for AGIs $50k-75k, 120.0% for AGIs $100k-200k)
Taxable individual retirement arrangement distribution: $10,350 (reported on 7.1% of returns)
12788:
$10,350
New York:
$19,609
(% of AGI for various income ranges: 170.0% for AGIs $25k-50k, 482.5% for AGIs $75k-100k)
Total itemized deductions: $20,183 (reported on 5.4% of returns)
Here:
$20,183
State:
$39,326
(% of AGI for various income ranges: 587.5% for AGIs $50k-75k, 632.5% for AGIs $100k-200k)
Charity contributions: $2,140 (reported on 4.5% of returns)
Here:
$2,140
State:
$15,420
(% of AGI for various income ranges: 10.4% for AGIs $25k-50k, 100.0% for AGIs $75k-100k)
Taxes paid: $8,900 (reported on 5.4% of returns)
12788:
$8,900
State:
$9,183
(% of AGI for various income ranges: 255.0% for AGIs $50k-75k, 285.0% for AGIs $100k-200k)
Earned income credit: $2,258 (reported on 17.0% of returns)
Here:
$2,258
State:
$2,138
(% of AGI for various income ranges: 110.9% for AGIs below $25k, 66.9% for AGIs $25k-50k)
Percentage of individuals using paid preparers for their 2020 taxes: 91.1%
Here:
91%
State:
95%
(% for various income ranges: 83.8% for AGIs below $25k, 93.8% for AGIs $25k-50k, 94.1% for AGIs $50k-75k, 100.0% for AGIs $75k-100k, 92.3% for AGIs $100k-200k, 100.0% for AGIs over 200k)
Averages for the 2012 tax year for zip code 12788, filed in 2013:
Average Adjusted Gross Income (AGI) in 2012: $48,709 (Individual Income Tax Returns)
Here:
$48,709
State:
$77,088
Salary/wage: $46,321 (reported on 80.9% of returns)
Here:
$46,321
State:
$60,593
(% of AGI for various income ranges: 73.5% for AGIs below $25k, 77.1% for AGIs $25k-50k, 73.4% for AGIs $50k-75k, 75.3% for AGIs $75k-100k, 80.2% for AGIs $100k-200k)
Taxable interest for individuals: $494 (reported on 37.2% of returns)
This zip code:
$494
New York:
$3,125
(% of AGI for various income ranges: 0.6% for AGIs below $25k, 0.4% for AGIs $25k-50k, 0.5% for AGIs $50k-75k, 0.1% for AGIs $75k-100k, 0.4% for AGIs $100k-200k)
Ordinary dividends: $2,356 (reported on 19.1% of returns)
Here:
$2,356
State:
$10,299
(% of AGI for various income ranges: 2.1% for AGIs below $25k, 1.4% for AGIs $25k-50k, 1.2% for AGIs $50k-75k, 0.6% for AGIs $75k-100k, 0.4% for AGIs $100k-200k)
Profit/loss from business: +$4,723 (reported on 13.8% of returns)
Here:
+$4,723
State:
+$16,168
(% of AGI for various income ranges: 9.2% for AGIs below $25k, 2.2% for AGIs $25k-50k, 1.8% for AGIs $50k-75k)
Taxable individual retirement arrangement distribution: $11,350 (reported on 6.4% of returns)
12788:
$11,350
New York:
$17,621
Total itemized deductions: $19,294 (22% of AGI, reported on 33.0% of returns)
Here:
$19,294
State:
$34,985
Here:
22.2% of AGI
State:
21.3% of AGI
(% of AGI for various income ranges: 6.5% for AGIs below $25k, 8.6% for AGIs $25k-50k, 13.9% for AGIs $50k-75k, 16.0% for AGIs $75k-100k, 15.3% for AGIs $100k-200k)
Charity contributions: $2,177 (reported on 27.7% of returns)
Here:
$2,177
State:
$5,572
(% of AGI for various income ranges: 0.7% for AGIs $25k-50k, 1.5% for AGIs $50k-75k, 1.8% for AGIs $75k-100k, 1.4% for AGIs $100k-200k)
Taxes paid: $8,890 (reported on 33.0% of returns)
12788:
$8,890
State:
$18,656
(% of AGI for various income ranges: 2.0% for AGIs below $25k, 3.2% for AGIs $25k-50k, 5.7% for AGIs $50k-75k, 6.8% for AGIs $75k-100k, 8.4% for AGIs $100k-200k)
Earned income credit: $2,278 (reported on 19.1% of returns)
Here:
$2,278
State:
$2,230
(% of AGI for various income ranges: 6.5% for AGIs below $25k, 1.4% for AGIs $25k-50k)
Percentage of individuals using paid preparers for their 2012 taxes: 67.0%
Here:
67%
State:
66%
(% for various income ranges: 63.9% for AGIs below $25k, 66.7% for AGIs $25k-50k, 61.5% for AGIs $50k-75k, 70.0% for AGIs $75k-100k, 81.8% for AGIs $100k-200k)
Averages for the 2004 tax year for zip code 12788, filed in 2005:
Average Adjusted Gross Income (AGI) in 2004: $39,132 (Individual Income Tax Returns)
Here:
$39,132
State:
$59,519
Salary/wage: $37,240 (reported on 82.2% of returns)
Here:
$37,240
State:
$50,673
(% of AGI for various income ranges: 111.0% for AGIs below $10k, 70.8% for AGIs $10k-25k, 80.9% for AGIs $25k-50k, 76.2% for AGIs $50k-75k, 88.7% for AGIs $75k-100k, 70.4% for AGIs over 100k)
Taxable interest for individuals: $851 (reported on 49.9% of returns)
This zip code:
$851
New York:
$2,377
(% of AGI for various income ranges: 8.5% for AGIs below $10k, 1.9% for AGIs $10k-25k, 0.9% for AGIs $25k-50k, 0.6% for AGIs $50k-75k, 0.4% for AGIs $75k-100k, 1.3% for AGIs over 100k)
Taxable dividends: $1,692 (reported on 21.2% of returns)
Here:
$1,692
State:
$5,394
(% of AGI for various income ranges: 4.4% for AGIs below $10k, 3.6% for AGIs $10k-25k, 0.8% for AGIs $25k-50k, 0.4% for AGIs $50k-75k, 0.2% for AGIs $75k-100k, 0.6% for AGIs over 100k)
Net capital gain/loss: +$242 (reported on 14.7% of returns)
Here:
+$242
State:
+$23,581
(% of AGI for various income ranges: -2.0% for AGIs below $10k, -0.6% for AGIs $10k-25k, 0.1% for AGIs $25k-50k, 0.1% for AGIs $50k-75k, -0.0% for AGIs $75k-100k, 0.6% for AGIs over 100k)
Profit/loss from business: +$2,410 (reported on 11.5% of returns)
Here:
+$2,410
State:
+$13,809
(% of AGI for various income ranges: -3.8% for AGIs below $10k, 6.4% for AGIs $10k-25k, -0.6% for AGIs $25k-50k, 1.2% for AGIs $50k-75k)
IRA payment deduction: $2,556 (reported on 2.1% of returns)
12788:
$2,556
New York:
$3,115
Total itemized deductions: $16,021 (23% of AGI, reported on 33.3% of returns)
Here:
$16,021
State:
$25,864
Here:
22.7% of AGI
State:
21.9% of AGI
(% of AGI for various income ranges: 9.4% for AGIs $10k-25k, 13.0% for AGIs $25k-50k, 14.3% for AGIs $50k-75k, 18.2% for AGIs $75k-100k, 13.2% for AGIs over 100k)
Charity contributions deductions: $1,914 (3% of AGI, reported on 30.7% of returns)
Here:
$1,914
State:
$4,439
Here:
2.6% of AGI
State:
3.6% of AGI
(% of AGI for various income ranges: 0.5% for AGIs $10k-25k, 1.3% for AGIs $25k-50k, 1.9% for AGIs $50k-75k, 2.0% for AGIs $75k-100k, 1.4% for AGIs over 100k)
Total tax: $5,355 (reported on 71.4% of returns)
12788:
$5,355
State:
$11,730
(% of AGI for various income ranges: 3.2% for AGIs below $10k, 4.5% for AGIs $10k-25k, 6.4% for AGIs $25k-50k, 8.7% for AGIs $50k-75k, 10.1% for AGIs $75k-100k, 17.3% for AGIs over 100k)
Earned income credit: $1,701 (reported on 15.7% of returns)
Here:
$1,701
State:
$1,757
Percentage of individuals using paid preparers for their 2004 taxes: 68.0%
Here:
68%
State:
67%
(% for various income ranges: 55.8% for AGIs below $10k, 66.0% for AGIs $10k-25k, 73.2% for AGIs $25k-50k, 75.6% for AGIs $50k-75k, 66.2% for AGIs $75k-100k, 81.6% for AGIs over 100k)
Household received Food Stamps/SNAP in the past 12 months: 180 Household did not receive Food Stamps/SNAP in the past 12 months: 687
Women who had a birth in the past 12 months: 46 (46 now married, 0 unmarried) Women who did not have a birth in the past 12 months: 372 (147 now married, 224 unmarried)
Housing units in zip code 12788 with a mortgage: 288 (72 second mortgage, 1 home equity loan, 71 both second mortgage and home equity loan) Houses without a mortgage: 7
Median monthly owner costs for units with a mortgage: $1,708 Median monthly owner costs for units without a mortgage: $703
Residents with income below the poverty level in 2022:
This zip code:
12.1%
Whole state:
14.3%
Residents with income below 50% of the poverty level in 2022:
This zip code:
1.8%
Whole state:
6.8%
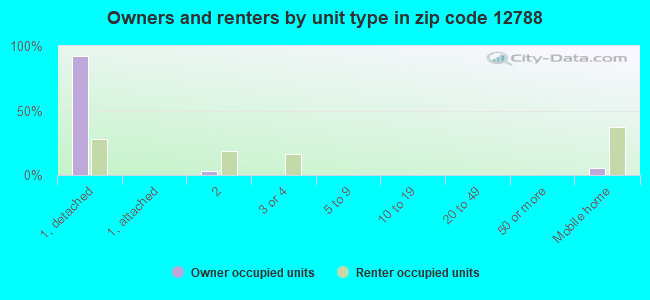
Median number of rooms in houses and condos:
Here:
5.9
State:
6.3
Median number of rooms in apartments:
Here:
4.6
State:
3.8
Notable locations in this zip code not listed on our city pages
Notable locations in zip code 12788: Woodbourne Correctional Institute (A), Allison Farms (B), Woodbourne Fire District (C). Display/hide their locations on the map
In group quarters: 890 (-1 institutionalized population)
Size of family households: 216 2-persons, 105 3-persons, 83 4-persons, 14 5-persons, 15 6-persons, 32 7-or-more-persons
Size of nonfamily households: 296 1-person, 106 2-persons
239 married couples with children.
121 single-parent households (121 men).
85.1% of residents of 12788 zip code speak English at home.
9.9% of residents speak Spanish at home (61% very well, 25% well, 8% not well, 5% not at all).
3.8% of residents speak other Indo-European language at home (20% very well, 48% well, 32% not well).
0.2% of residents speak Asian or Pacific Island language at home (100% not well).
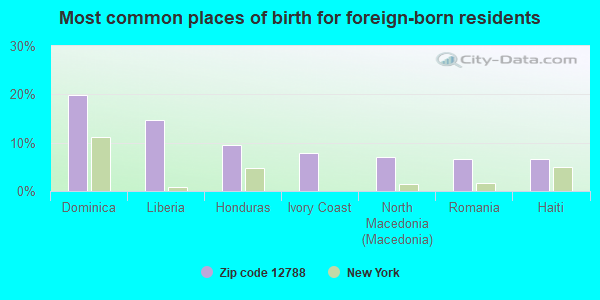
Foreign born population: 377 (13.5%) (47.6% of them are naturalized citizens)
This zip code:
13.5%
Whole state:
22.7%
20%Dominica
15%Liberia
9%Honduras
8%Ivory Coast
7%North Macedonia (Macedonia)
7%Romania
7%Haiti
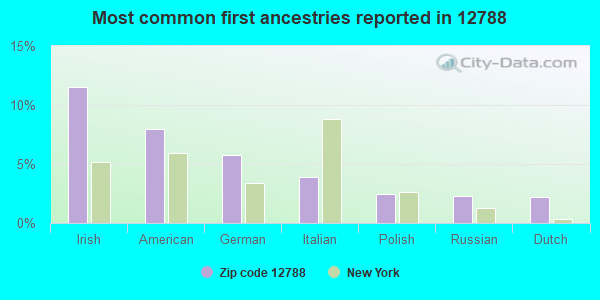
11%Irish
8%American
6%German
4%Italian
2%Polish
2%Russian
2%Dutch
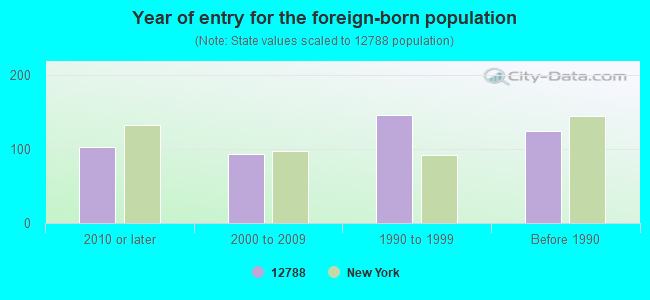
Year of entry for the foreign-born population
1032010 or later
932000 to 2009
1461990 to 1999
124Before 1990
Facilities with environmental interests located in this zip code:
BEAVER SMLTNG REF CORP (BEAVER LANE in WOODBOURNE, NY)
(Resource Conservation and Recovery Act (tracking hazardous waste)) Business NAICS classification: SECONDARY SMELTING, REFINING, AND ALLOYING OF NONFERROUS METAL (EXCEPT COPPER AND ALUMINUM). Organizations: OWNERNAME (CONTACT/OWNER)
FALLSBURG TOWN OF (HASBROUCK DR & RTE 42 in WOODBOURNE, NY)
(Resource Conservation and Recovery Act (tracking hazardous waste))
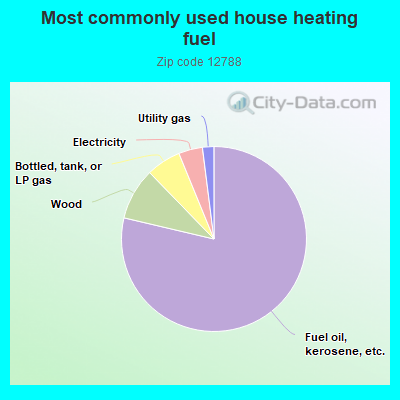
79.0%Fuel oil, kerosene, etc.
9.1%Wood
6.1%Bottled, tank, or LP gas
4.2%Electricity
2.0%Utility gas
Population in 1990: 2,561. Population change in the 1990s: +374 (+14.6%).
Place of birth for U.S.-born residents:
This state: 2,118
Northeast: 116
Midwest: 39
South: 39
52% of the 12788 zip code residents lived in the same house 5 years ago. Out of people who lived in different houses, 33% lived in this county. Out of people who lived in different counties, 50% lived in New York.
91% of the 12788 zip code residents lived in the same house 1 year ago. Out of people who lived in different houses, 88% moved from different county within same state. Out of people who lived in different houses, 4% moved from different state. Out of people who lived in different houses, 11% moved from abroad.
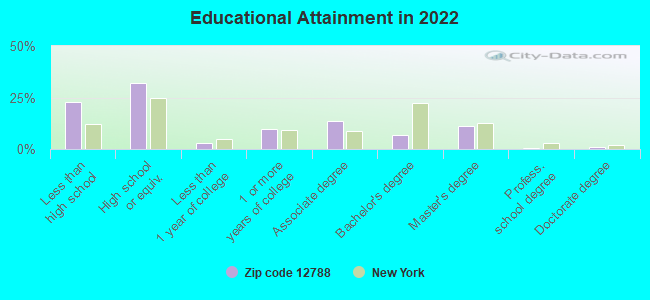
Private vs. public school enrollment:
Students in private schools in grades 1 to 8 (elementary and middle school): 14
Here:
6.1%
New York:
15.6%
Students in private schools in grades 9 to 12 (high school):
Here:
0.0%
New York:
15.0%
Students in private undergraduate colleges: 23
Here:
48.7%
New York:
39.2%
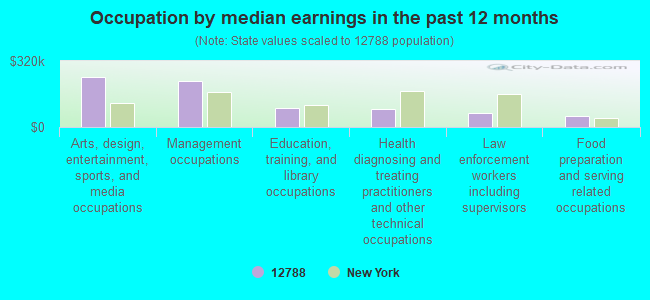
Occupation by median earnings in the past 12 months ($)
244,754Arts, design, entertainment, sports, and media occupations
222,396Management occupations
93,207Education, training, and library occupations
89,338Health diagnosing and treating practitioners and other technical occupations
66,701Law enforcement workers including supervisors
55,020Food preparation and serving related occupations
Top industries in this zip code by the number of employees in 2005:
Health Care and Social Assistance: Child Day Care Services (50-99 employees: 1 establishment)
Health Care and Social Assistance: Residential Mental Retardation Facilities (5-9: 3, 1-4: 1)
Wholesale Trade: Computer and Computer Peripheral Equipment and Software Merchant Wholesalers (10-19: 1)
Professional, Scientific, and Technical Services: Offices of Lawyers (10-19: 1)
Construction: Industrial Building Construction (10-19: 1)
Finance and Insurance: Insurance Agencies and Brokerages (10-19: 1)
Construction: New Single-Family Housing Construction (except Operative Builders) (5-9: 1, 1-4: 1)
Construction: Plumbing, Heating, and Air-Conditioning Contractors (5-9: 1, 1-4: 1)
People in group quarters in 2010:
774 people in state prisons
14 people in group homes intended for adults
8 people in workers' group living quarters and job corps centers
6 people in residential treatment centers for adults
5 people in other noninstitutional facilities
People in group quarters in 2000:
961 people in state prisons
8 people in homes for the mentally retarded
2002 - 2018 National Fire Incident Reporting System (NFIRS) incidents
Based on the data from the years 2002 - 2018 the average number of fires per year is 22. The highest number of reported fires - 63 took place in 2007, and the least - 1 in 2014. The data has a declining trend.
When looking into fire subcategories, the most reports belonged to: Structure Fires (40.7%), and Other (37.0%).
Fire incident types reported to NFIRS in Zip Code 12788


 Nearest zip codes: 12733, 12759, 12765, 12789, 12435, 12779.


 Based on the data from the years 2002 - 2018 the average number of fires per year is 22. The highest number of reported fires - 63 took place in 2007, and the least - 1 in 2014. The data has a declining trend.
 When looking into fire subcategories, the most reports belonged to: Structure Fires (40.7%), and Other (37.0%).