Estimated zip code population in 2022: 3,085 Zip code population in 2010: 3,001 Zip code population in 2000: 3,133
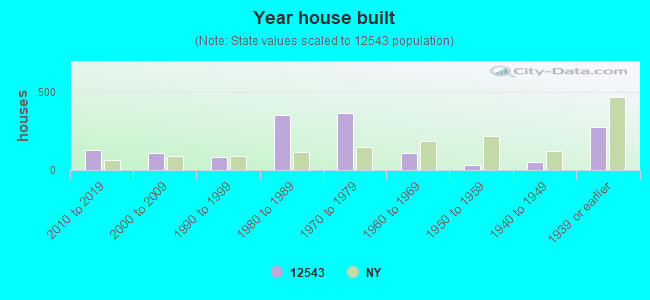
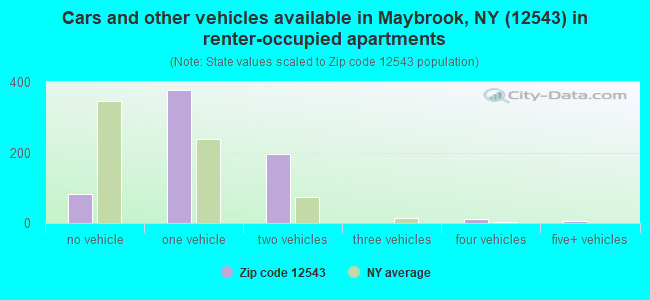
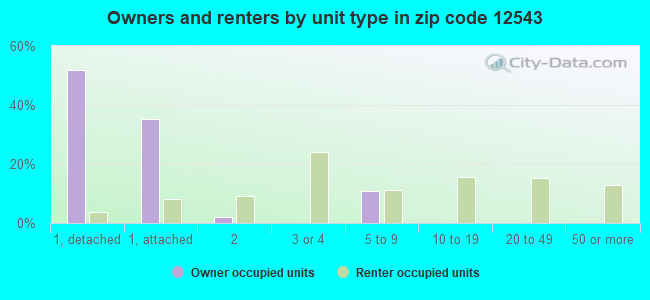
Houses and condos: 1,477 Renter-occupied apartments: 670
% of renters here:
49%
State:
46%
March 2022 cost of living index in zip code 12543: 132.1 (high, U.S. average is 100)
Land area: 11.5 sq. mi. Water area: 0.6 sq. mi.
Population density: 269 people per square mile
(very low).
OSM Map
General Map
Google Map
MSN Map
OSM Map
General Map
Google Map
MSN Map
OSM Map
General Map
Google Map
MSN Map
OSM Map
General Map
Google Map
MSN Map
Please wait while loading the map...
Real estate property taxes paid for housing units in 2022:
This zip code:
2.6% ($6,133)
New York:
1.5% ($6,180)
Median real estate property taxes paid for housing units with mortgages in 2022: $6,665 (2.6%) Median real estate property taxes paid for housing units with no mortgage in 2022: $4,827 (2.5%)
Estimated median house/condo value in 2022: $238,405
12543:
$238,405
New York:
$400,400
According to our research of New York and other state lists, there were 3 registered sex offenders living in 12543 zip code as of July 03, 2024. The ratio of all residents to sex offenders in zip code 12543 is 1,081 to 1. The ratio of registered sex offenders to all residents in this zip code is near the state average.
Median resident age:
This zip code:
44.1 years
New York median age:
40.0 years
Average household size:
This zip code:
2.2 people
New York:
2.5 people
Averages for the 2020 tax year for zip code 12543, filed in 2021:
Average Adjusted Gross Income (AGI) in 2020: $55,655 (Individual Income Tax Returns)
Here:
$55,655
State:
$90,930
Salary/wage: $51,210 (reported on 83.4% of returns)
Here:
$51,210
State:
$72,104
(% of AGI for various income ranges: 1136.9% for AGIs below $25k, 3574.8% for AGIs $25k-50k, 6197.0% for AGIs $50k-75k, 8652.0% for AGIs $75k-100k, 13835.6% for AGIs $100k-200k)
Taxable interest for individuals: $469 (reported on 29.4% of returns)
This zip code:
$469
New York:
$3,075
(% of AGI for various income ranges: 7.7% for AGIs below $25k, 17.9% for AGIs $25k-50k, 15.7% for AGIs $50k-75k, 34.7% for AGIs $75k-100k, 31.9% for AGIs $100k-200k)
Ordinary dividends: $1,435 (reported on 10.4% of returns)
Here:
$1,435
State:
$11,095
(% of AGI for various income ranges: 4.0% for AGIs below $25k, 26.4% for AGIs $25k-50k, 20.0% for AGIs $50k-75k, 28.7% for AGIs $75k-100k, 33.8% for AGIs $100k-200k)
Net capital gain/loss in AGI: +$1,460 (reported on 9.2% of returns)
Here:
+$1,460
State:
+$44,925
(% of AGI for various income ranges: 15.7% for AGIs below $25k, 0.9% for AGIs $25k-50k, 24.8% for AGIs $50k-75k, 65.0% for AGIs $100k-200k)
Profit/loss from business: +$6,188 (reported on 9.8% of returns)
Here:
+$6,188
State:
+$14,940
(% of AGI for various income ranges: 84.3% for AGIs below $25k, 84.8% for AGIs $25k-50k, 93.9% for AGIs $50k-75k, 29.3% for AGIs $75k-100k, 96.9% for AGIs $100k-200k)
Taxable individual retirement arrangement distribution: $8,520 (reported on 6.1% of returns)
12543:
$8,520
New York:
$19,609
(% of AGI for various income ranges: 26.6% for AGIs below $25k, 43.9% for AGIs $25k-50k, 149.6% for AGIs $50k-75k, 168.8% for AGIs $100k-200k)
Total itemized deductions: $21,679 (reported on 8.6% of returns)
Here:
$21,679
State:
$39,326
(% of AGI for various income ranges: 458.7% for AGIs $50k-75k, 628.0% for AGIs $75k-100k, 648.8% for AGIs $100k-200k)
Charity contributions: $3,182 (reported on 6.7% of returns)
Here:
$3,182
State:
$15,420
(% of AGI for various income ranges: 37.0% for AGIs $50k-75k, 69.3% for AGIs $75k-100k, 100.6% for AGIs $100k-200k)
Taxes paid: $8,593 (reported on 8.6% of returns)
12543:
$8,593
State:
$9,183
(% of AGI for various income ranges: 169.1% for AGIs $50k-75k, 270.0% for AGIs $75k-100k, 255.6% for AGIs $100k-200k)
Earned income credit: $2,025 (reported on 12.3% of returns)
Here:
$2,025
State:
$2,138
(% of AGI for various income ranges: 68.6% for AGIs below $25k, 50.0% for AGIs $25k-50k)
Percentage of individuals using paid preparers for their 2020 taxes: 94.5%
Here:
94%
State:
95%
(% for various income ranges: 93.6% for AGIs below $25k, 95.1% for AGIs $25k-50k, 93.5% for AGIs $50k-75k, 100.0% for AGIs $75k-100k, 95.5% for AGIs $100k-200k, 66.7% for AGIs over 200k)
Averages for the 2012 tax year for zip code 12543, filed in 2013:
Average Adjusted Gross Income (AGI) in 2012: $49,167 (Individual Income Tax Returns)
Here:
$49,167
State:
$77,088
Salary/wage: $45,627 (reported on 91.3% of returns)
Here:
$45,627
State:
$60,593
(% of AGI for various income ranges: 79.6% for AGIs below $25k, 85.6% for AGIs $25k-50k, 84.0% for AGIs $50k-75k, 86.0% for AGIs $75k-100k, 85.2% for AGIs $100k-200k)
Taxable interest for individuals: $247 (reported on 34.1% of returns)
This zip code:
$247
New York:
$3,125
(% of AGI for various income ranges: 0.3% for AGIs below $25k, 0.2% for AGIs $25k-50k, 0.2% for AGIs $50k-75k, 0.2% for AGIs $75k-100k, 0.1% for AGIs $100k-200k)
Ordinary dividends: $806 (reported on 11.6% of returns)
Here:
$806
State:
$10,299
(% of AGI for various income ranges: 0.1% for AGIs below $25k, 0.2% for AGIs $25k-50k, 0.2% for AGIs $50k-75k, 0.1% for AGIs $75k-100k, 0.2% for AGIs $100k-200k)
Net capital gain/loss in AGI: +$1,200 (reported on 8.0% of returns)
Here:
+$1,200
State:
+$42,474
(% of AGI for various income ranges: 0.9% for AGIs $100k-200k)
Profit/loss from business: +$3,783 (reported on 8.7% of returns)
Here:
+$3,783
State:
+$16,168
(% of AGI for various income ranges: 5.1% for AGIs below $25k, 1.2% for AGIs $25k-50k)
Taxable individual retirement arrangement distribution: $7,917 (reported on 4.3% of returns)
12543:
$7,917
New York:
$17,621
Total itemized deductions: $20,623 (26% of AGI, reported on 37.7% of returns)
Here:
$20,623
State:
$34,985
Here:
25.9% of AGI
State:
21.3% of AGI
(% of AGI for various income ranges: 6.1% for AGIs below $25k, 9.7% for AGIs $25k-50k, 16.4% for AGIs $50k-75k, 19.1% for AGIs $75k-100k, 20.3% for AGIs $100k-200k)
Charity contributions: $1,929 (reported on 30.4% of returns)
Here:
$1,929
State:
$5,572
(% of AGI for various income ranges: 0.8% for AGIs $25k-50k, 1.0% for AGIs $50k-75k, 1.4% for AGIs $75k-100k, 1.8% for AGIs $100k-200k)
Taxes paid: $8,921 (reported on 37.7% of returns)
12543:
$8,921
State:
$18,656
(% of AGI for various income ranges: 2.8% for AGIs below $25k, 3.8% for AGIs $25k-50k, 6.5% for AGIs $50k-75k, 8.5% for AGIs $75k-100k, 9.2% for AGIs $100k-200k)
Earned income credit: $1,991 (reported on 15.9% of returns)
Here:
$1,991
State:
$2,230
(% of AGI for various income ranges: 4.9% for AGIs below $25k, 1.0% for AGIs $25k-50k)
Percentage of individuals using paid preparers for their 2012 taxes: 63.0%
Here:
63%
State:
66%
(% for various income ranges: 59.6% for AGIs below $25k, 59.0% for AGIs $25k-50k, 66.7% for AGIs $50k-75k, 68.8% for AGIs $75k-100k, 73.3% for AGIs $100k-200k)
Averages for the 2004 tax year for zip code 12543, filed in 2005:
Average Adjusted Gross Income (AGI) in 2004: $42,042 (Individual Income Tax Returns)
Here:
$42,042
State:
$59,519
Salary/wage: $40,274 (reported on 91.9% of returns)
Here:
$40,274
State:
$50,673
(% of AGI for various income ranges: 85.9% for AGIs below $10k, 86.0% for AGIs $10k-25k, 89.6% for AGIs $25k-50k, 91.1% for AGIs $50k-75k, 90.0% for AGIs $75k-100k, 81.3% for AGIs over 100k)
Taxable interest for individuals: $421 (reported on 44.1% of returns)
This zip code:
$421
New York:
$2,377
(% of AGI for various income ranges: 4.0% for AGIs below $10k, 0.8% for AGIs $10k-25k, 0.3% for AGIs $25k-50k, 0.4% for AGIs $50k-75k, 0.3% for AGIs $75k-100k, 0.4% for AGIs over 100k)
Taxable dividends: $600 (reported on 15.8% of returns)
Here:
$600
State:
$5,394
(% of AGI for various income ranges: 0.7% for AGIs below $10k, 0.4% for AGIs $10k-25k, 0.2% for AGIs $25k-50k, 0.2% for AGIs $50k-75k, 0.1% for AGIs $75k-100k, 0.2% for AGIs over 100k)
Net capital gain/loss: +$1,653 (reported on 10.3% of returns)
Here:
+$1,653
State:
+$23,581
(% of AGI for various income ranges: 0.4% for AGIs below $10k, 1.2% for AGIs $10k-25k, 0.1% for AGIs $25k-50k, -0.1% for AGIs $50k-75k, 0.1% for AGIs $75k-100k, 1.4% for AGIs over 100k)
Profit/loss from business: +$4,927 (reported on 8.5% of returns)
Here:
+$4,927
State:
+$13,809
(% of AGI for various income ranges: 8.2% for AGIs below $10k, 4.6% for AGIs $10k-25k, 0.9% for AGIs $25k-50k, 0.2% for AGIs $50k-75k, -0.2% for AGIs $75k-100k, 1.2% for AGIs over 100k)
IRA payment deduction: $1,200 (reported on 0.7% of returns)
12543:
$1,200
New York:
$3,115
Total itemized deductions: $17,678 (26% of AGI, reported on 39.0% of returns)
Here:
$17,678
State:
$25,864
Here:
26.2% of AGI
State:
21.9% of AGI
(% of AGI for various income ranges: 8.3% for AGIs $10k-25k, 14.5% for AGIs $25k-50k, 18.5% for AGIs $50k-75k, 18.7% for AGIs $75k-100k, 18.7% for AGIs over 100k)
Charity contributions deductions: $2,232 (3% of AGI, reported on 35.5% of returns)
Here:
$2,232
State:
$4,439
Here:
3.2% of AGI
State:
3.6% of AGI
(% of AGI for various income ranges: 0.6% for AGIs $10k-25k, 1.8% for AGIs $25k-50k, 2.2% for AGIs $50k-75k, 2.1% for AGIs $75k-100k, 2.1% for AGIs over 100k)
Total tax: $4,708 (reported on 75.6% of returns)
12543:
$4,708
State:
$11,730
(% of AGI for various income ranges: 2.3% for AGIs below $10k, 4.2% for AGIs $10k-25k, 6.1% for AGIs $25k-50k, 7.9% for AGIs $50k-75k, 9.4% for AGIs $75k-100k, 13.6% for AGIs over 100k)
Earned income credit: $1,522 (reported on 12.6% of returns)
Here:
$1,522
State:
$1,757
Percentage of individuals using paid preparers for their 2004 taxes: 64.2%
Here:
64%
State:
67%
(% for various income ranges: 51.1% for AGIs below $10k, 60.0% for AGIs $10k-25k, 67.1% for AGIs $25k-50k, 68.9% for AGIs $50k-75k, 75.5% for AGIs $75k-100k, 72.3% for AGIs over 100k)
Likely homosexual households (counted as self-reported same-sex unmarried-partner households)
Lesbian couples: 0.0% of all households
Gay men: 0.4% of all households
Household received Food Stamps/SNAP in the past 12 months: 168 Household did not receive Food Stamps/SNAP in the past 12 months: 1,191
Women who had a birth in the past 12 months: 29 (29 now married, 0 unmarried) Women who did not have a birth in the past 12 months: 613 (251 now married, 359 unmarried)
Housing units in zip code 12543 with a mortgage: 454 (35 second mortgage, 29 both second mortgage and home equity loan) Houses without a mortgage: 74
Median monthly owner costs for units with a mortgage: $1,908 Median monthly owner costs for units without a mortgage: $698
Residents with income below the poverty level in 2022:
This zip code:
7.8%
Whole state:
14.3%
Residents with income below 50% of the poverty level in 2022:
This zip code:
1.4%
Whole state:
6.8%
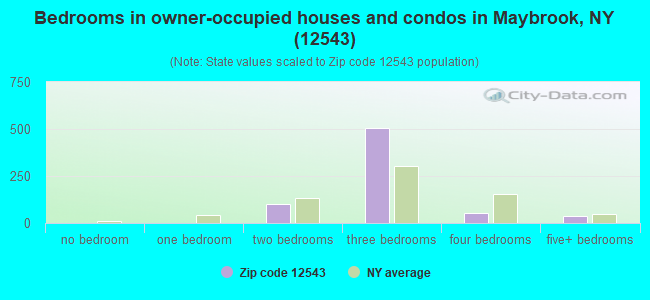
Median number of rooms in houses and condos:
Here:
6.0
State:
6.3
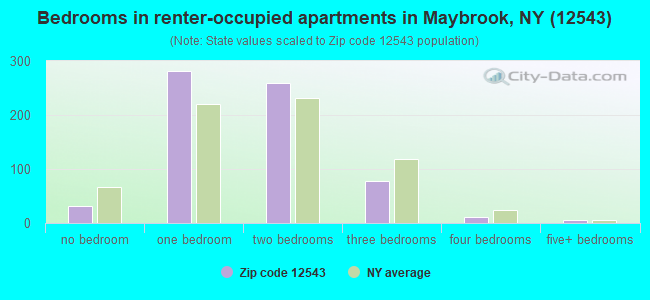
Median number of rooms in apartments:
Here:
3.6
State:
3.8
Notable locations in this zip code not listed on our city pages
In group quarters: 4 (-1 institutionalized population)
Size of family households: 346 2-persons, 185 3-persons, 130 4-persons, 93 5-persons, 12 6-persons
Size of nonfamily households: 494 1-person, 101 2-persons, 7 6-persons
330 married couples with children.
135 single-parent households (36 men, 99 women).
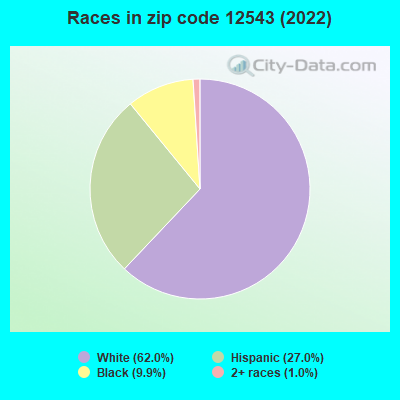
80.5% of residents of 12543 zip code speak English at home.
17.0% of residents speak Spanish at home (83% very well, 13% well, 3% not well).
2.2% of residents speak other Indo-European language at home (42% very well, 8% well, 50% not well).
0.1% of residents speak other language at home (100% very well).
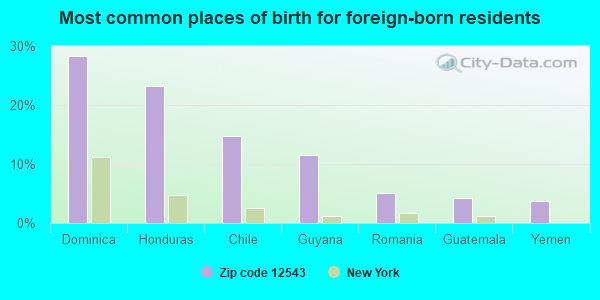
Foreign born population: 453 (14.7%) (82.4% of them are naturalized citizens)
This zip code:
14.7%
Whole state:
22.7%
28%Dominica
23%Honduras
15%Chile
12%Guyana
5%Romania
4%Guatemala
4%Yemen
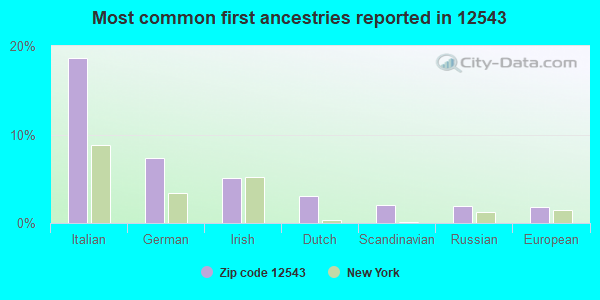
19%Italian
7%German
5%Irish
3%Dutch
2%Scandinavian
2%Russian
2%European
Year of entry for the foreign-born population
952010 or later
552000 to 2009
2161990 to 1999
132Before 1990
Facilities with environmental interests located in this zip code:
EASTERN ALLOYS INC (HENRY HENNING DR. in MAYBROOK, NY)
AIR MINOR (AIRS/AFS) STATE MASTER (New York facility tracking) - AIR PROGRAM, National Pollutant Discharge Elimination System Permit, National Pollutant Discharge Elimination System Permit (Integrated Compliance Information System) - ICIS-02-2000-4203, FORMAL ENFORCEMENT ACTION COMPLIANCE ACTIVITY (Tracking inspections of insecticide, fungicide, and rodenticide, and toxic substances) CRITERIA AND HAZARDOUS AIR POLLUTANT INVENTORY (Inventory of air pollution sources) National Pollutant Discharge Elimination System NON-MAJOR (Tracking pollutant discharge elimination systems) - permit National Pollutant Discharge Elimination System NON-MAJOR (Tracking pollutant discharge elimination systems) - permit Small Quantity Generators, between 100 kg and 1000 kg of hazardous waste/month (Resource Conservation and Recovery Act (tracking hazardous waste)) TRI REPORTER (Tracking of toxic chemicals releasing facilities) Business SIC classification: PRIMARY SMELTING AND REFINING OF NONFERROUS METALS, EXCEPT COPPER AND ALUMINUM; SECONDARY SMELTING AND REFINING OF NONFERROUS METALS; ROLLING, DRAWING, AND EXTRUDING OF NONFERROUS METALS, EXCEPT COPPER AND ALUMINUM; NONCLASSIFIABLE ESTABLISHMENTS Business NAICS classification: PRIMARY SMELTING AND REFINING OF NONFERROUS METAL (EXCEPT COPPER AND ALUMINUM).; SECONDARY SMELTING, REFINING, AND ALLOYING OF NONFERROUS METAL (EXCEPT COPPER AND ALUMINUM). Organizations: EASTERN ALLOYS, INC (CONTACT/OWNER)
, OWNERNAME (CONTACT/OWNER)
EXXON CO USA 36097 (RTE 208 & I-84 in MAYBROOK, NY)
Conditionally Exempt Small Quantity Generators, less than 100 kg/month of hazardous waste (Resource Conservation and Recovery Act (tracking hazardous waste))
CALLANAN INDUSTRIES MAYBROOK MATERIALS DIV (NEELYTOWN RD PO BOX 505 in MAYBROOK, NY)
TRI REPORTER (Tracking of toxic chemicals releasing facilities) Business SIC classification: CRUSHED AND BROKEN LIMESTONE; ASPHALT PAVING MIXTURES AND BLOCKS Alternative names: CALLANAN INDS., CALLANAN INDS. MAYBROOK PLANT
Housing units lacking complete plumbing facilities: 1.6% Housing units lacking complete kitchen facilities: 2.5%
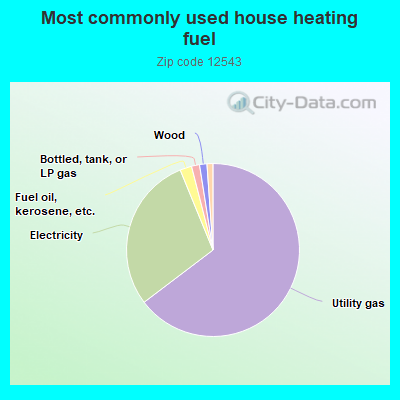
64.8%Utility gas
29.2%Electricity
2.2%Fuel oil, kerosene, etc.
1.5%Bottled, tank, or LP gas
1.4%Wood
1.1%Other fuel
Population in 1990: 2,860. Population change in the 1990s: +273 (+9.5%).
Place of birth for U.S.-born residents:
This state: 2,146
Northeast: 316
Midwest: 10
South: 80
West: 13
60% of the 12543 zip code residents lived in the same house 5 years ago. Out of people who lived in different houses, 63% lived in this county. Out of people who lived in different counties, 50% lived in New York.
92% of the 12543 zip code residents lived in the same house 1 year ago. Out of people who lived in different houses, 45% moved from this county. Out of people who lived in different houses, 48% moved from different county within same state. Out of people who lived in different houses, 6% moved from different state.
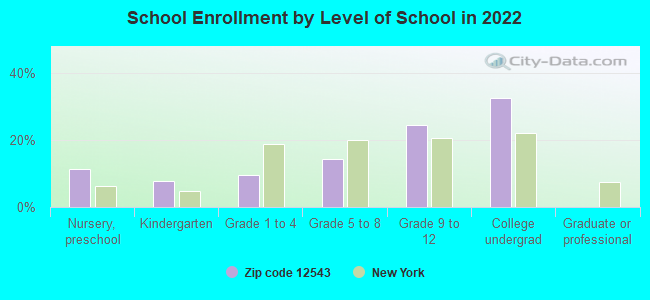
Private vs. public school enrollment:
Students in private schools in grades 1 to 8 (elementary and middle school):
Here:
0.0%
New York:
15.6%
Students in private schools in grades 9 to 12 (high school):
Here:
0.0%
New York:
15.0%
Students in private undergraduate colleges: 29
Here:
12.8%
New York:
39.2%
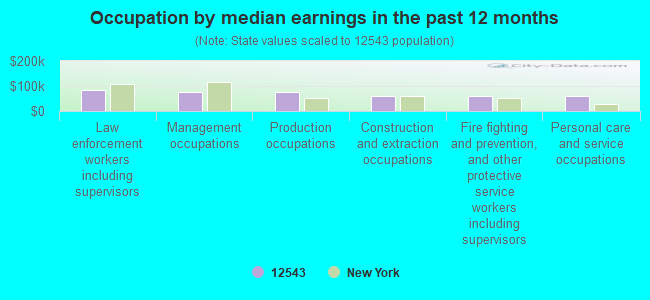
Occupation by median earnings in the past 12 months ($)
85,633Law enforcement workers including supervisors
77,332Management occupations
74,105Production occupations
61,400Construction and extraction occupations
60,371Fire fighting and prevention, and other protective service workers including supervisors
59,596Personal care and service occupations
Top industries in this zip code by the number of employees in 2005:
Health Care and Social Assistance: Offices of Dentists (10-19 employees: 1 establishment)
Other Services (except Public Administration): General Automotive Repair (10-19: 1)


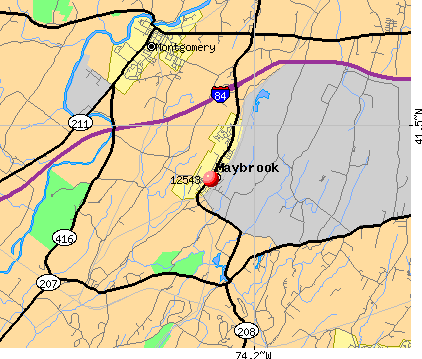 Nearest zip codes: 12575, 12586, 10992, 10914, 12577, 12549.