Estimated zip code population in 2022: 716 Zip code population in 2010: 639 Zip code population in 2000: 653
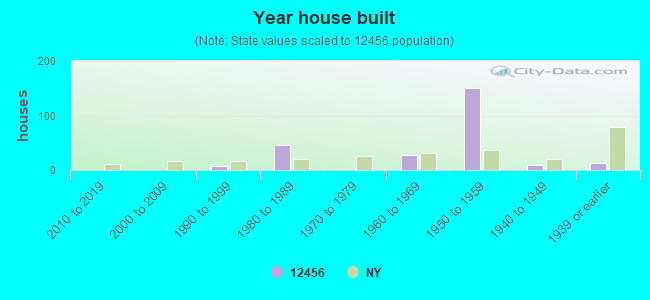
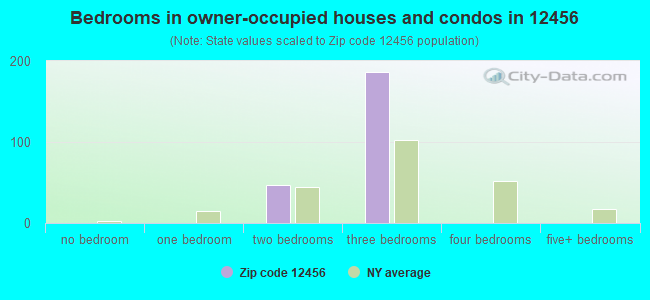
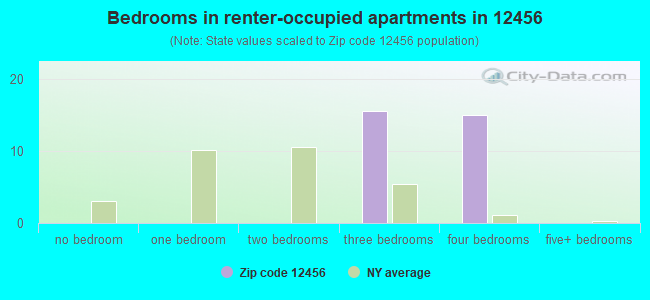
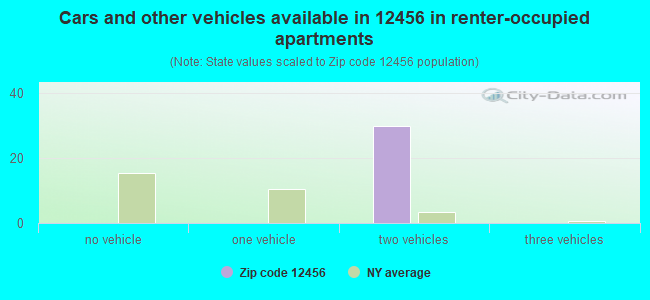
Houses and condos: 260 Renter-occupied apartments: 30
% of renters here:
12%
State:
46%
March 2022 cost of living index in zip code 12456: 104.6 (near average, U.S. average is 100)
Land area: 0.5 sq. mi. Water area: 0.0 sq. mi.
Population density: 1,325 people per square mile
(low).
OSM Map
General Map
Google Map
MSN Map
OSM Map
General Map
Google Map
MSN Map
OSM Map
General Map
Google Map
MSN Map
OSM Map
General Map
Google Map
MSN Map
Please wait while loading the map...
Real estate property taxes paid for housing units in 2022:
This zip code:
3.1% ($4,995)
New York:
1.5% ($6,180)
Median real estate property taxes paid for housing units with mortgages in 2022: $4,942 Median real estate property taxes paid for housing units with no mortgage in 2022: $5,379
Business Search- 14 Million verified businesses
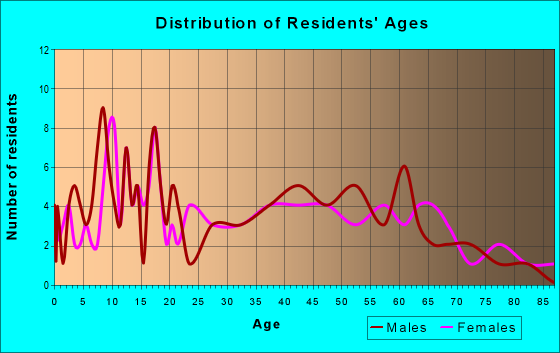
Males: 374
(52.2%)
Females: 342
(47.8%)
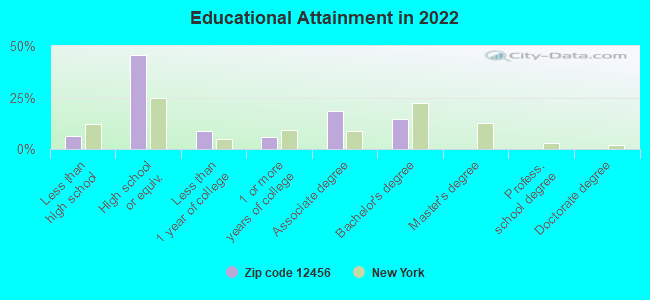
For population 25 years and over in 12456:
High school or higher: 92.8%
Bachelor's degree or higher: 14.5%
Graduate or professional degree: 0.0%
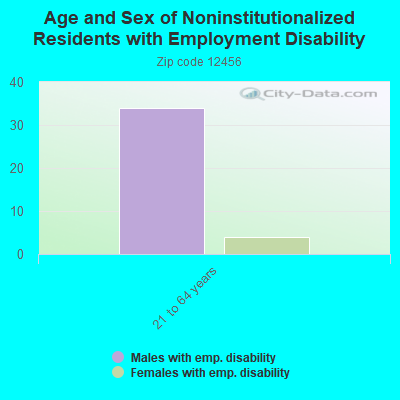
Unemployed: 5.2%
Mean travel time to work (commute): 20.8 minutes
For population 15 years and over in 12456:
Never married: 25.3%
Now married: 59.4%
Separated: 0.0%
Widowed: 6.8%
Divorced: 8.4%
Zip code 12456 compared to state average:
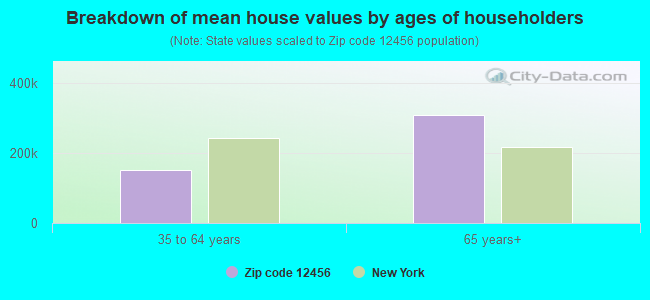
Median house value significantly below state average.
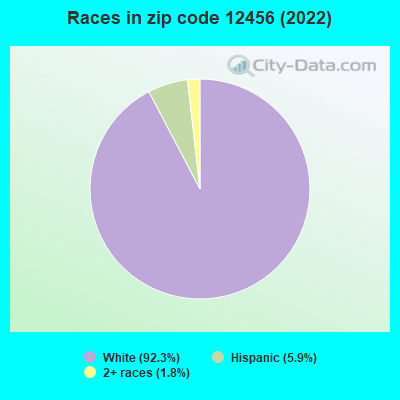
Black race population percentage significantly below state average.
Hispanic race population percentage significantly below state average.
Median age below state average.
Foreign-born population percentage significantly below state average.
Renting percentage significantly below state average.
Length of stay since moving in significantly above state average.
Number of college students significantly below state average.
Percentage of population with a bachelor's degree or higher significantly below state average.
Averages for the 2020 tax year for zip code 12456, filed in 2021:
Average Adjusted Gross Income (AGI) in 2020: $48,193 (Individual Income Tax Returns)
Here:
$48,193
State:
$90,930
Salary/wage: $42,834 (reported on 83.3% of returns)
Here:
$42,834
State:
$72,104
(% of AGI for various income ranges: 1000.0% for AGIs below $25k, 3071.8% for AGIs $25k-50k, 6010.0% for AGIs $50k-75k, 9653.3% for AGIs $75k-100k, 15706.7% for AGIs $100k-200k)
Taxable interest for individuals: $208 (reported on 31.0% of returns)
This zip code:
$208
New York:
$3,075
(% of AGI for various income ranges: 4.0% for AGIs below $25k, 3.6% for AGIs $25k-50k, 4.0% for AGIs $50k-75k, 6.7% for AGIs $75k-100k, 50.0% for AGIs $100k-200k)
Ordinary dividends: $1,100 (reported on 11.9% of returns)
Here:
$1,100
State:
$11,095
(% of AGI for various income ranges: 14.0% for AGIs below $25k, 136.7% for AGIs $75k-100k)
Net capital gain/loss in AGI: +$3,500 (reported on 7.1% of returns)
Here:
+$3,500
State:
+$44,925
(% of AGI for various income ranges: 95.5% for AGIs $25k-50k)
Profit/loss from business: +$3,200 (reported on 4.8% of returns)
Here:
+$3,200
State:
+$14,940
(% of AGI for various income ranges: 64.0% for AGIs below $25k)
Earned income credit: $1,517 (reported on 14.3% of returns)
Here:
$1,517
State:
$2,138
(% of AGI for various income ranges: 45.0% for AGIs below $25k, 41.8% for AGIs $25k-50k)
Percentage of individuals using paid preparers for their 2020 taxes: 92.9%
Here:
93%
State:
95%
(% for various income ranges: 92.3% for AGIs below $25k, 92.3% for AGIs $25k-50k, 85.7% for AGIs $50k-75k, 100.0% for AGIs $75k-100k, 100.0% for AGIs $100k-200k)
Averages for the 2012 tax year for zip code 12456, filed in 2013:
Average Adjusted Gross Income (AGI) in 2012: $40,732 (Individual Income Tax Returns)
Here:
$40,732
State:
$77,088
Salary/wage: $37,437 (reported on 85.4% of returns)
Here:
$37,437
State:
$60,593
(% of AGI for various income ranges: 73.3% for AGIs below $25k, 79.7% for AGIs $25k-50k, 78.6% for AGIs $50k-75k, 76.6% for AGIs $75k-100k, 81.9% for AGIs $100k-200k)
Taxable interest for individuals: $217 (reported on 29.3% of returns)
This zip code:
$217
New York:
$3,125
(% of AGI for various income ranges: 0.1% for AGIs below $25k, 0.2% for AGIs $25k-50k, 0.2% for AGIs $50k-75k, 0.1% for AGIs $75k-100k)
Ordinary dividends: $700 (reported on 14.6% of returns)
Here:
$700
State:
$10,299
Profit/loss from business: +$5,800 (reported on 7.3% of returns)
Here:
+$5,800
State:
+$16,168
Taxable individual retirement arrangement distribution: $7,100 (reported on 7.3% of returns)
12456:
$7,100
New York:
$17,621
Total itemized deductions: $19,600 (27% of AGI, reported on 26.8% of returns)
Here:
$19,600
State:
$34,985
Here:
27.4% of AGI
State:
21.3% of AGI
(% of AGI for various income ranges: 15.6% for AGIs $25k-50k, 12.6% for AGIs $50k-75k, 33.9% for AGIs $75k-100k)
Charity contributions: $1,457 (reported on 17.1% of returns)
Here:
$1,457
State:
$5,572
Taxes paid: $8,573 (reported on 26.8% of returns)
12456:
$8,573
State:
$18,656
(% of AGI for various income ranges: 6.1% for AGIs $25k-50k, 5.3% for AGIs $50k-75k, 16.4% for AGIs $75k-100k)
Earned income credit: $1,625 (reported on 19.5% of returns)
Here:
$1,625
State:
$2,230
(% of AGI for various income ranges: 3.3% for AGIs below $25k, 1.4% for AGIs $25k-50k)
Percentage of individuals using paid preparers for their 2012 taxes: 51.2%
Here:
51%
State:
66%
(% for various income ranges: 50.0% for AGIs below $25k, 41.7% for AGIs $25k-50k, 50.0% for AGIs $50k-75k, 133.3% for AGIs $75k-100k)
Averages for the 2004 tax year for zip code 12456, filed in 2005:
Average Adjusted Gross Income (AGI) in 2004: $35,432 (Individual Income Tax Returns)
Here:
$35,432
State:
$59,519
Salary/wage: $33,088 (reported on 88.5% of returns)
Here:
$33,088
State:
$50,673
(% of AGI for various income ranges: 82.9% for AGIs below $10k, 81.2% for AGIs $10k-25k, 87.8% for AGIs $25k-50k, 84.4% for AGIs $50k-75k, 155.3% for AGIs $75k-100k)
Taxable interest for individuals: $426 (reported on 43.0% of returns)
This zip code:
$426
New York:
$2,377
(% of AGI for various income ranges: 2.4% for AGIs below $10k, 0.9% for AGIs $10k-25k, 0.3% for AGIs $25k-50k, 0.3% for AGIs $50k-75k, 1.1% for AGIs $75k-100k)
Taxable dividends: $421 (reported on 17.8% of returns)
Here:
$421
State:
$5,394
(% of AGI for various income ranges: 0.8% for AGIs $10k-25k, 0.1% for AGIs $25k-50k, 0.2% for AGIs $50k-75k, 0.2% for AGIs $75k-100k)
Net capital gain/loss: +$4,396 (reported on 11.3% of returns)
Here:
+$4,396
State:
+$23,581
(% of AGI for various income ranges: -1.4% for AGIs below $10k, -0.1% for AGIs $25k-50k, 1.1% for AGIs $50k-75k, 9.0% for AGIs $75k-100k)
Profit/loss from business: +$3,548 (reported on 7.3% of returns)
Here:
+$3,548
State:
+$13,809
Total itemized deductions: $15,160 (22% of AGI, reported on 22.1% of returns)
Here:
$15,160
State:
$25,864
Here:
22.0% of AGI
State:
21.9% of AGI
(% of AGI for various income ranges: 5.7% for AGIs $10k-25k, 8.1% for AGIs $25k-50k, 9.3% for AGIs $50k-75k, 11.4% for AGIs $75k-100k, 16.1% for AGIs over 100k)
Charity contributions deductions: $1,452 (2% of AGI, reported on 19.7% of returns)
Here:
$1,452
State:
$4,439
Here:
2.0% of AGI
State:
3.6% of AGI
(% of AGI for various income ranges: 0.8% for AGIs $25k-50k, 0.9% for AGIs $50k-75k, 0.7% for AGIs $75k-100k, 1.8% for AGIs over 100k)
Total tax: $3,880 (reported on 72.3% of returns)
12456:
$3,880
State:
$11,730
(% of AGI for various income ranges: 1.7% for AGIs below $10k, 3.9% for AGIs $10k-25k, 6.8% for AGIs $25k-50k, 8.4% for AGIs $50k-75k, 23.1% for AGIs $75k-100k)
Earned income credit: $1,645 (reported on 17.8% of returns)
Here:
$1,645
State:
$1,757
Percentage of individuals using paid preparers for their 2004 taxes: 58.2%
Here:
58%
State:
67%
(% for various income ranges: 51.1% for AGIs below $10k, 57.7% for AGIs $10k-25k, 56.2% for AGIs $25k-50k, 62.1% for AGIs $50k-75k, 113.0% for AGIs $75k-100k)
Household received Food Stamps/SNAP in the past 12 months: 0 Household did not receive Food Stamps/SNAP in the past 12 months: 258
Women who did not have a birth in the past 12 months: 185 (117 now married, 65 unmarried)
Housing units in zip code 12456 with a mortgage: 202 (13 second mortgage, 14 home equity loan) Median monthly owner costs for units with a mortgage: $1,326 Median monthly owner costs for units without a mortgage: $935
Residents with income below the poverty level in 2022:
This zip code:
3.5%
Whole state:
14.3%
Residents with income below 50% of the poverty level in 2022:
This zip code:
3.5%
Whole state:
6.8%
Median number of rooms in houses and condos:
Here:
5.5
State:
6.3
Notable locations in this zip code not listed on our city pages
Size of family households: 103 2-persons, 27 3-persons, 87 4-persons
Size of nonfamily households: 42 1-person
148 married couples with children.
23 single-parent households (7 men, 16 women).
96.3% of residents of 12456 zip code speak English at home.
3.1% of residents speak Spanish at home (55% very well, 45% not at all).
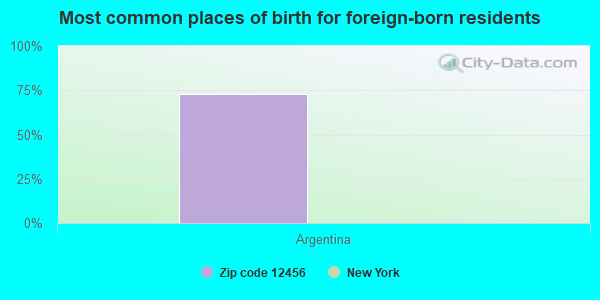
Foreign born population: 22 (3.1%) (0.0% of them are naturalized citizens)
:
3.1%
Whole state:
22.7%
73%Argentina
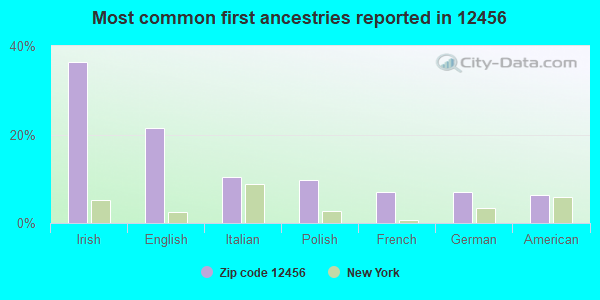
36%Irish
22%English
10%Italian
10%Polish
7%French
7%German
6%American
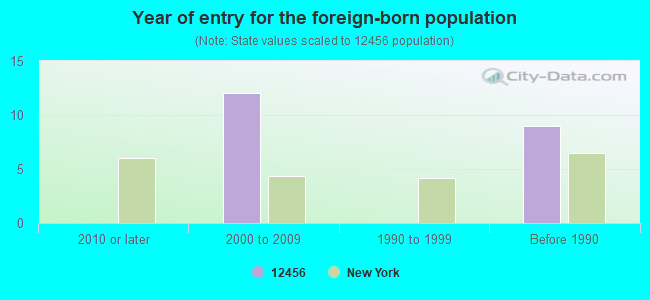
Year of entry for the foreign-born population
02010 or later
122000 to 2009
01990 to 1999
9Before 1990
Facilities with environmental interests located in this zip code:
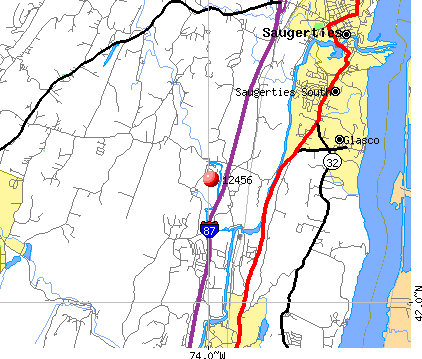
INDUSTRIAL ENV SYSTEMS INC (OLD KINGS HWY in MOUNT MARION, NY)
TSD (Resource Conservation and Recovery Act (tracking hazardous waste))
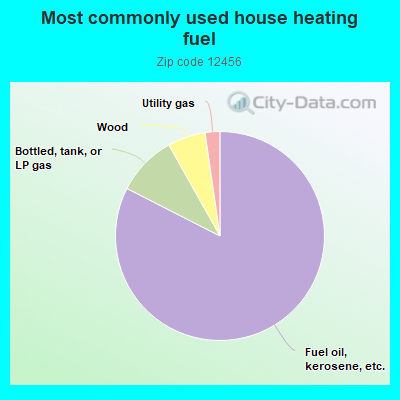
83.1%Fuel oil, kerosene, etc.
9.4%Bottled, tank, or LP gas
5.9%Wood
2.3%Utility gas
Population in 1990: 753.
Place of birth for U.S.-born residents:
This state: 655
Northeast: 6
South: 8
West: 21
72% of the 12456 zip code residents lived in the same house 5 years ago. Out of people who lived in different houses, 87% lived in this county. Out of people who lived in different counties, 50% lived in New York.
92% of the 12456 zip code residents lived in the same house 1 year ago. Out of people who lived in different houses, 35% moved from this county. Out of people who lived in different houses, 65% moved from abroad.
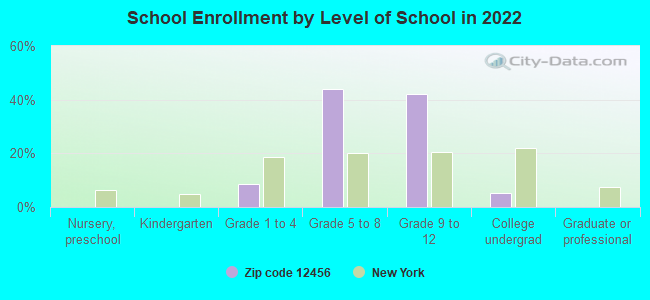
Private vs. public school enrollment:
Students in private schools in grades 1 to 8 (elementary and middle school):
Here:
0.0%
New York:
15.6%
Students in private schools in grades 9 to 12 (high school):
Here:
0.0%
New York:
15.0%
Students in private undergraduate colleges: 10
Here:
100.0%
New York:
39.2%
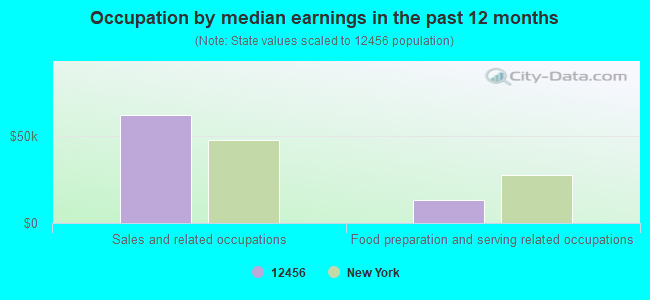
Occupation by median earnings in the past 12 months ($)
62,285Sales and related occupations
13,334Food preparation and serving related occupations
Companies with federal contracts located in this zip code:
METHODS TOOLING & MANUFACTURIN (635 GLASCO TPKE in MOUNT MARION, NY; small business) : $702,721 in 26 contractsfrom 2003 to 2006
Contracts for Hardware, Commercial, Antennas, Waveguides, and Related Equipment, Replenishable Field Medical Sets, Kits, and Outfits, Vehicular Cab, Body, and Frame Structural Components, and moreby Defense Logistics Agency, Army Signed by year:2000: $0; 2001: $0; 2002: $0; 2003: $56,100; 2004: $56,100; 2005: $299,340; 2006: $291,181.
Biggest contracts:
$284,801 with Defense Logistics Agency for Hardware, Commercial. Signed on 2006-04-21. Completion date: 2006-11-21.
$123,536 with Defense Logistics Agency for Antennas, Waveguides, and Related Equipment. Signed on 2005-12-20. Completion date: 2007-01-23.
$95,040, same as above.Signed on 2005-08-31. Completion date: 2006-05-28.
$56,100 with Defense Logistics Agency for Replenishable Field Medical Sets, Kits, and Outfits. Signed on 2003-12-11. Completion date: 2004-02-09.
Top industries in this zip code by the number of employees in 2005:
Mining: Other Crushed and Broken Stone Mining and Quarrying (50-99 employees: 1 establishment)
Health Care and Social Assistance: Home Health Care Services (20-49: 1)
Construction: Electrical Contractors (10-19: 1)
Construction: New Single-Family Housing Construction (except Operative Builders) (1-4: 1)
Real Estate and Rental and Leasing: Lessors of Residential Buildings and Dwellings (1-4: 1)
Wholesale Trade: Meat and Meat Product Merchant Wholesalers (1-4: 1)
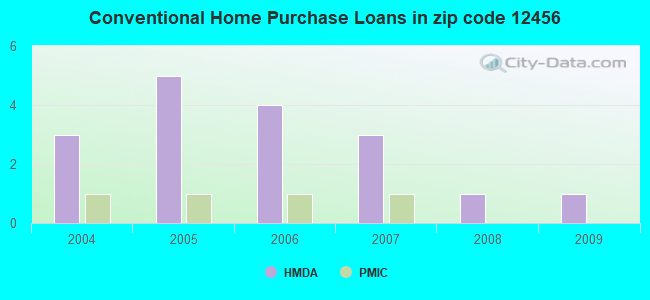
Home Mortgage Disclosure Act Aggregated Statistics For Year 2009 (Based on 2 partial tracts)
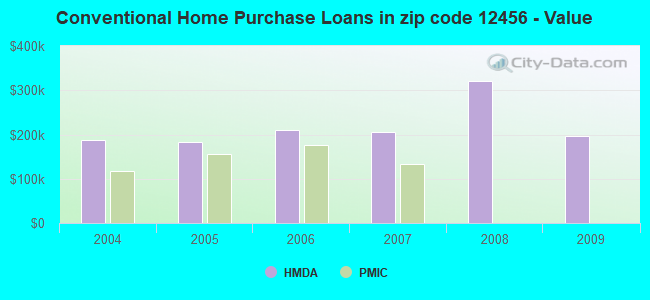
B) Conventional Home Purchase Loans
C) Refinancings
D) Home Improvement Loans
F) Non-occupant Loans on < 5 Family Dwellings (A B C & D)
Number
Average Value
Number
Average Value
Number
Average Value
Number
Average Value
LOANS ORIGINATED
1
$197,550
3
$166,233
1
$23,210
1
$135,090
APPLICATIONS APPROVED, NOT ACCEPTED
0
$0
0
$0
0
$0
0
$0
APPLICATIONS DENIED
0
$0
2
$125,385
0
$0
0
$0
APPLICATIONS WITHDRAWN
0
$0
1
$229,760
0
$0
0
$0
FILES CLOSED FOR INCOMPLETENESS
0
$0
0
$0
0
$0
0
$0
Aggregated Statistics For Year 2008 (Based on 2 partial tracts)
B) Conventional Home Purchase Loans
C) Refinancings
D) Home Improvement Loans
F) Non-occupant Loans on < 5 Family Dwellings (A B C & D)
Number
Average Value
Number
Average Value
Number
Average Value
Number
Average Value
LOANS ORIGINATED
1
$321,930
3
$172,330
1
$84,180
1
$150,900
APPLICATIONS APPROVED, NOT ACCEPTED
0
$0
1
$99,930
0
$0
0
$0
APPLICATIONS DENIED
1
$91,880
2
$205,215
1
$91,050
0
$0
APPLICATIONS WITHDRAWN
0
$0
1
$132,370
0
$0
0
$0
FILES CLOSED FOR INCOMPLETENESS
0
$0
0
$0
0
$0
0
$0
Aggregated Statistics For Year 2007 (Based on 2 partial tracts)
B) Conventional Home Purchase Loans
C) Refinancings
D) Home Improvement Loans
F) Non-occupant Loans on < 5 Family Dwellings (A B C & D)
G) Loans On Manufactured Home Dwelling (A B C & D)
Number
Average Value
Number
Average Value
Number
Average Value
Number
Average Value
Number
Average Value
LOANS ORIGINATED
3
$205,800
3
$207,357
2
$40,165
2
$184,110
0
$0
APPLICATIONS APPROVED, NOT ACCEPTED
0
$0
1
$131,960
0
$0
0
$0
0
$0
APPLICATIONS DENIED
1
$129,830
3
$196,190
2
$48,335
0
$0
1
$70,570
APPLICATIONS WITHDRAWN
0
$0
2
$143,265
0
$0
0
$0
0
$0
FILES CLOSED FOR INCOMPLETENESS
0
$0
0
$0
0
$0
0
$0
0
$0
Aggregated Statistics For Year 2006 (Based on 2 partial tracts)
B) Conventional Home Purchase Loans
C) Refinancings
D) Home Improvement Loans
F) Non-occupant Loans on < 5 Family Dwellings (A B C & D)
Number
Average Value
Number
Average Value
Number
Average Value
Number
Average Value
LOANS ORIGINATED
4
$210,560
5
$144,200
2
$74,620
1
$136,160
APPLICATIONS APPROVED, NOT ACCEPTED
0
$0
1
$122,720
0
$0
0
$0
APPLICATIONS DENIED
1
$111,590
4
$163,200
1
$93,480
0
$0
APPLICATIONS WITHDRAWN
1
$105,910
3
$137,620
0
$0
0
$0
FILES CLOSED FOR INCOMPLETENESS
0
$0
1
$159,370
0
$0
0
$0
Aggregated Statistics For Year 2005 (Based on 2 partial tracts)
B) Conventional Home Purchase Loans
C) Refinancings
D) Home Improvement Loans
F) Non-occupant Loans on < 5 Family Dwellings (A B C & D)
G) Loans On Manufactured Home Dwelling (A B C & D)
Number
Average Value
Number
Average Value
Number
Average Value
Number
Average Value
Number
Average Value
LOANS ORIGINATED
5
$182,726
6
$158,793
2
$62,900
2
$145,070
0
$0
APPLICATIONS APPROVED, NOT ACCEPTED
0
$0
2
$174,225
0
$0
0
$0
0
$0
APPLICATIONS DENIED
1
$171,440
5
$139,700
1
$66,070
0
$0
1
$58,370
APPLICATIONS WITHDRAWN
1
$117,100
4
$132,740
1
$56,060
0
$0
0
$0
FILES CLOSED FOR INCOMPLETENESS
0
$0
2
$164,250
0
$0
0
$0
0
$0
Aggregated Statistics For Year 2004 (Based on 2 partial tracts)
B) Conventional Home Purchase Loans
C) Refinancings
D) Home Improvement Loans
F) Non-occupant Loans on < 5 Family Dwellings (A B C & D)
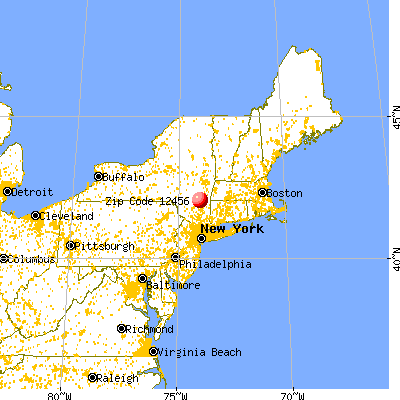


 Nearest zip codes: 12475, 12449, 12401, 12432, 12477, 12507.