Estimated zip code population in 2022: 1,756 Zip code population in 2010: 2,037 Zip code population in 2000: 2,096
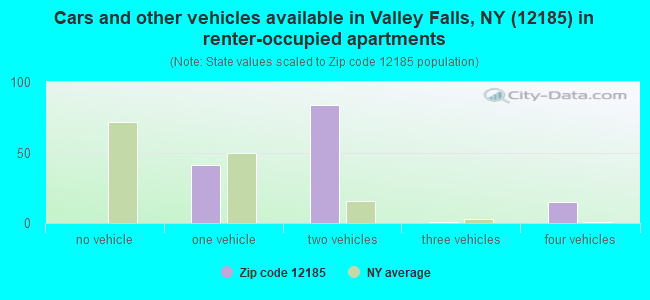
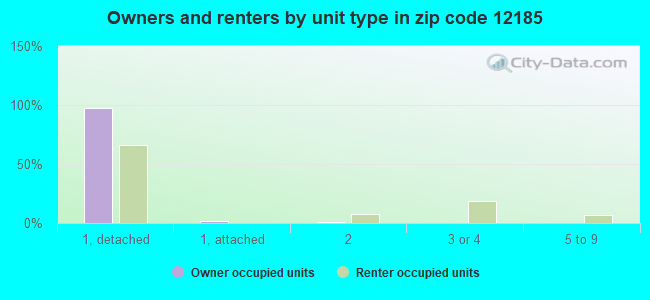
Houses and condos: 774 Renter-occupied apartments: 140
% of renters here:
20%
State:
46%
March 2022 cost of living index in zip code 12185: 94.2 (less than average, U.S. average is 100)
Land area: 24.3 sq. mi. Water area: 0.3 sq. mi.
Population density: 72 people per square mile
(very low).
OSM Map
General Map
Google Map
MSN Map
OSM Map
General Map
Google Map
MSN Map
OSM Map
General Map
Google Map
MSN Map
OSM Map
General Map
Google Map
MSN Map
Please wait while loading the map...
Real estate property taxes paid for housing units in 2022:
This zip code:
1.7% ($3,803)
New York:
1.5% ($6,180)
Median real estate property taxes paid for housing units with mortgages in 2022: $4,301 (1.9%) Median real estate property taxes paid for housing units with no mortgage in 2022: $3,018 (1.4%)
Business Search- 14 Million verified businesses
Males: 968
(55.1%)
Females: 788
(44.9%)
For population 25 years and over in 12185:
High school or higher: 92.9%
Bachelor's degree or higher: 31.5%
Graduate or professional degree: 12.4%
Unemployed: 1.0%
Mean travel time to work (commute): 30.6 minutes
For population 15 years and over in 12185:
Never married: 23.2%
Now married: 68.0%
Separated: 0.1%
Widowed: 3.8%
Divorced: 4.9%
Zip code 12185 compared to state average:
Median house value below state average.
Unemployed percentage significantly below state average.
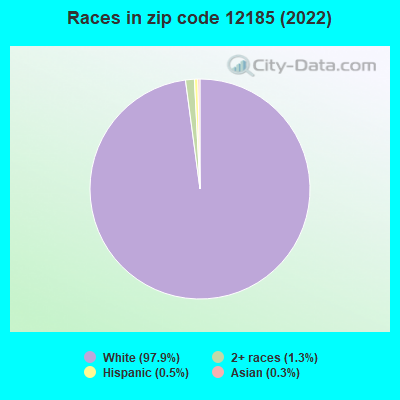
Black race population percentage significantly below state average.
Hispanic race population percentage significantly below state average.
Median age above state average.
Foreign-born population percentage significantly below state average.
Renting percentage significantly below state average.
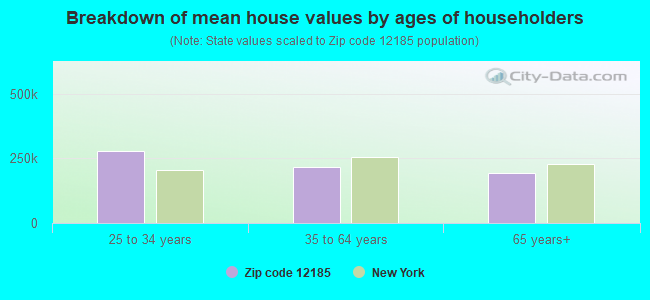
Estimated median house/condo value in 2022: $221,726
12185:
$221,726
New York:
$400,400
According to our research of New York and other state lists, there were 3 registered sex offenders living in 12185 zip code as of July 03, 2024. The ratio of all residents to sex offenders in zip code 12185 is 813 to 1. The ratio of registered sex offenders to all residents in this zip code is near the state average.
Median resident age:
This zip code:
46.1 years
New York median age:
40.0 years
Average household size:
This zip code:
2.5 people
New York:
2.5 people
Averages for the 2020 tax year for zip code 12185, filed in 2021:
Average Adjusted Gross Income (AGI) in 2020: $68,534 (Individual Income Tax Returns)
Here:
$68,534
State:
$90,930
Salary/wage: $61,025 (reported on 79.8% of returns)
Here:
$61,025
State:
$72,104
(% of AGI for various income ranges: 1083.3% for AGIs below $25k, 3623.9% for AGIs $25k-50k, 6294.2% for AGIs $50k-75k, 8443.3% for AGIs $75k-100k, 14743.3% for AGIs $100k-200k)
Taxable interest for individuals: $611 (reported on 35.4% of returns)
This zip code:
$611
New York:
$3,075
(% of AGI for various income ranges: 5.3% for AGIs below $25k, 22.2% for AGIs $25k-50k, 10.8% for AGIs $50k-75k, 27.8% for AGIs $75k-100k, 69.2% for AGIs $100k-200k)
Ordinary dividends: $4,106 (reported on 17.2% of returns)
Here:
$4,106
State:
$11,095
(% of AGI for various income ranges: 8.7% for AGIs below $25k, 53.9% for AGIs $25k-50k, 30.8% for AGIs $50k-75k, 68.9% for AGIs $75k-100k, 407.5% for AGIs $100k-200k)
Net capital gain/loss in AGI: +$12,777 (reported on 13.1% of returns)
Here:
+$12,777
State:
+$44,925
(% of AGI for various income ranges: 18.3% for AGIs $25k-50k, 221.7% for AGIs $50k-75k, 1135.0% for AGIs $100k-200k)
Profit/loss from business: +$16,692 (reported on 12.1% of returns)
Here:
+$16,692
State:
+$14,940
(% of AGI for various income ranges: 335.0% for AGIs $25k-50k, 1166.7% for AGIs $100k-200k)
Taxable individual retirement arrangement distribution: $15,650 (reported on 8.1% of returns)
12185:
$15,650
New York:
$19,609
(% of AGI for various income ranges: 123.3% for AGIs $25k-50k, 238.3% for AGIs $50k-75k, 620.0% for AGIs $100k-200k)
Total itemized deductions: $21,500 (reported on 5.1% of returns)
Here:
$21,500
State:
$39,326
(% of AGI for various income ranges: 1194.4% for AGIs $75k-100k)
Charity contributions: $3,133 (reported on 3.0% of returns)
Here:
$3,133
State:
$15,420
(% of AGI for various income ranges: 78.3% for AGIs $50k-75k)
Taxes paid: $7,960 (reported on 5.1% of returns)
12185:
$7,960
State:
$9,183
(% of AGI for various income ranges: 442.2% for AGIs $75k-100k)
Earned income credit: $2,433 (reported on 9.1% of returns)
Here:
$2,433
State:
$2,138
(% of AGI for various income ranges: 81.3% for AGIs below $25k, 53.9% for AGIs $25k-50k)
Percentage of individuals using paid preparers for their 2020 taxes: 93.9%
Here:
94%
State:
95%
(% for various income ranges: 95.5% for AGIs below $25k, 92.3% for AGIs $25k-50k, 93.8% for AGIs $50k-75k, 92.3% for AGIs $75k-100k, 94.4% for AGIs $100k-200k, 100.0% for AGIs over 200k)
Averages for the 2012 tax year for zip code 12185, filed in 2013:
Average Adjusted Gross Income (AGI) in 2012: $56,135 (Individual Income Tax Returns)
Here:
$56,135
State:
$77,088
Salary/wage: $51,267 (reported on 86.3% of returns)
Here:
$51,267
State:
$60,593
(% of AGI for various income ranges: 73.7% for AGIs below $25k, 81.4% for AGIs $25k-50k, 80.6% for AGIs $50k-75k, 73.5% for AGIs $75k-100k, 81.0% for AGIs $100k-200k, 78.7% for AGIs over 200k)
Taxable interest for individuals: $511 (reported on 40.0% of returns)
This zip code:
$511
New York:
$3,125
(% of AGI for various income ranges: 1.1% for AGIs below $25k, 0.4% for AGIs $25k-50k, 0.6% for AGIs $50k-75k, 0.3% for AGIs $100k-200k)
Ordinary dividends: $2,358 (reported on 20.0% of returns)
Here:
$2,358
State:
$10,299
(% of AGI for various income ranges: 1.1% for AGIs below $25k, 0.9% for AGIs $25k-50k, 0.8% for AGIs $50k-75k, 0.6% for AGIs $75k-100k, 1.3% for AGIs $100k-200k)
Net capital gain/loss in AGI: +$5,692 (reported on 12.6% of returns)
Here:
+$5,692
State:
+$42,474
(% of AGI for various income ranges: 0.9% for AGIs $25k-50k, 0.1% for AGIs $75k-100k, 3.8% for AGIs $100k-200k)
Profit/loss from business: +$5,875 (reported on 12.6% of returns)
Here:
+$5,875
State:
+$16,168
(% of AGI for various income ranges: 4.2% for AGIs below $25k, 1.1% for AGIs $25k-50k, 3.8% for AGIs $75k-100k, 0.6% for AGIs $100k-200k)
Taxable individual retirement arrangement distribution: $9,922 (reported on 9.5% of returns)
12185:
$9,922
New York:
$17,621
(% of AGI for various income ranges: 1.8% for AGIs below $25k, 2.1% for AGIs $25k-50k, 2.8% for AGIs $75k-100k, 2.4% for AGIs $100k-200k)
Total itemized deductions: $20,212 (21% of AGI, reported on 35.8% of returns)
Here:
$20,212
State:
$34,985
Here:
21.1% of AGI
State:
21.3% of AGI
(% of AGI for various income ranges: 11.3% for AGIs below $25k, 8.4% for AGIs $25k-50k, 11.7% for AGIs $50k-75k, 13.6% for AGIs $75k-100k, 15.2% for AGIs $100k-200k, 14.8% for AGIs over 200k)
Charity contributions: $1,821 (reported on 29.5% of returns)
Here:
$1,821
State:
$5,572
(% of AGI for various income ranges: 0.6% for AGIs $25k-50k, 0.7% for AGIs $50k-75k, 1.2% for AGIs $75k-100k, 1.8% for AGIs $100k-200k)
Taxes paid: $10,388 (reported on 35.8% of returns)
12185:
$10,388
State:
$18,656
(% of AGI for various income ranges: 4.2% for AGIs below $25k, 3.6% for AGIs $25k-50k, 5.6% for AGIs $50k-75k, 6.7% for AGIs $75k-100k, 8.1% for AGIs $100k-200k, 9.7% for AGIs over 200k)
Earned income credit: $1,900 (reported on 12.6% of returns)
Here:
$1,900
State:
$2,230
(% of AGI for various income ranges: 4.5% for AGIs below $25k, 0.6% for AGIs $25k-50k)
Percentage of individuals using paid preparers for their 2012 taxes: 55.8%
Here:
56%
State:
66%
(% for various income ranges: 48.4% for AGIs below $25k, 56.0% for AGIs $25k-50k, 64.3% for AGIs $50k-75k, 54.5% for AGIs $75k-100k, 75.0% for AGIs $100k-200k)
Averages for the 2004 tax year for zip code 12185, filed in 2005:
Average Adjusted Gross Income (AGI) in 2004: $42,372 (Individual Income Tax Returns)
Here:
$42,372
State:
$59,519
Salary/wage: $39,765 (reported on 86.8% of returns)
Here:
$39,765
State:
$50,673
(% of AGI for various income ranges: 79.3% for AGIs below $10k, 78.2% for AGIs $10k-25k, 81.3% for AGIs $25k-50k, 84.5% for AGIs $50k-75k, 89.6% for AGIs $75k-100k, 73.9% for AGIs over 100k)
Taxable interest for individuals: $926 (reported on 54.9% of returns)
This zip code:
$926
New York:
$2,377
(% of AGI for various income ranges: 6.4% for AGIs below $10k, 1.4% for AGIs $10k-25k, 1.9% for AGIs $25k-50k, 0.9% for AGIs $50k-75k, 0.3% for AGIs $75k-100k, 1.1% for AGIs over 100k)
Taxable dividends: $1,893 (reported on 26.5% of returns)
Here:
$1,893
State:
$5,394
(% of AGI for various income ranges: 8.8% for AGIs below $10k, 2.1% for AGIs $10k-25k, 0.8% for AGIs $25k-50k, 0.8% for AGIs $50k-75k, 0.3% for AGIs $75k-100k, 1.8% for AGIs over 100k)
Net capital gain/loss: +$3,030 (reported on 16.7% of returns)
Here:
+$3,030
State:
+$23,581
(% of AGI for various income ranges: 6.0% for AGIs below $10k, -0.2% for AGIs $10k-25k, -0.3% for AGIs $25k-50k, 0.6% for AGIs $50k-75k, 0.1% for AGIs $75k-100k, 4.2% for AGIs over 100k)
Profit/loss from business: +$5,985 (reported on 13.5% of returns)
Here:
+$5,985
State:
+$13,809
(% of AGI for various income ranges: 0.4% for AGIs below $10k, 3.6% for AGIs $10k-25k, 3.6% for AGIs $25k-50k, 1.6% for AGIs $50k-75k, 0.3% for AGIs $75k-100k, 1.4% for AGIs over 100k)
IRA payment deduction: $2,542 (reported on 2.4% of returns)
12185:
$2,542
New York:
$3,115
Total itemized deductions: $16,059 (21% of AGI, reported on 32.4% of returns)
Here:
$16,059
State:
$25,864
Here:
21.1% of AGI
State:
21.9% of AGI
(% of AGI for various income ranges: 7.1% for AGIs $10k-25k, 7.6% for AGIs $25k-50k, 14.0% for AGIs $50k-75k, 15.3% for AGIs $75k-100k, 15.5% for AGIs over 100k)
Charity contributions deductions: $1,948 (2% of AGI, reported on 29.4% of returns)
Here:
$1,948
State:
$4,439
Here:
2.5% of AGI
State:
3.6% of AGI
(% of AGI for various income ranges: 0.5% for AGIs $10k-25k, 0.8% for AGIs $25k-50k, 1.6% for AGIs $50k-75k, 1.6% for AGIs $75k-100k, 1.8% for AGIs over 100k)
Total tax: $5,150 (reported on 77.0% of returns)
12185:
$5,150
State:
$11,730
(% of AGI for various income ranges: 2.1% for AGIs below $10k, 4.0% for AGIs $10k-25k, 6.9% for AGIs $25k-50k, 8.6% for AGIs $50k-75k, 9.7% for AGIs $75k-100k, 14.4% for AGIs over 100k)
Earned income credit: $1,586 (reported on 13.5% of returns)
Here:
$1,586
State:
$1,757
Percentage of individuals using paid preparers for their 2004 taxes: 55.0%
Here:
55%
State:
67%
(% for various income ranges: 45.7% for AGIs below $10k, 51.4% for AGIs $10k-25k, 58.8% for AGIs $25k-50k, 57.4% for AGIs $50k-75k, 62.2% for AGIs $75k-100k, 60.3% for AGIs over 100k)
Household received Food Stamps/SNAP in the past 12 months: 34 Household did not receive Food Stamps/SNAP in the past 12 months: 659
Women who had a birth in the past 12 months: 41 (36 now married, 5 unmarried) Women who did not have a birth in the past 12 months: 272 (188 now married, 78 unmarried)
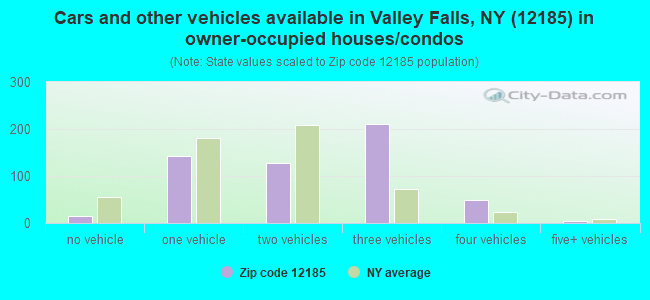
Housing units in zip code 12185 with a mortgage: 321 (23 second mortgage, 24 both second mortgage and home equity loan) Houses without a mortgage: 14
Median monthly owner costs for units with a mortgage: $1,403 Median monthly owner costs for units without a mortgage: $640
Residents with income below the poverty level in 2022:
This zip code:
4.5%
Whole state:
14.3%
Residents with income below 50% of the poverty level in 2022:
This zip code:
3.1%
Whole state:
6.8%
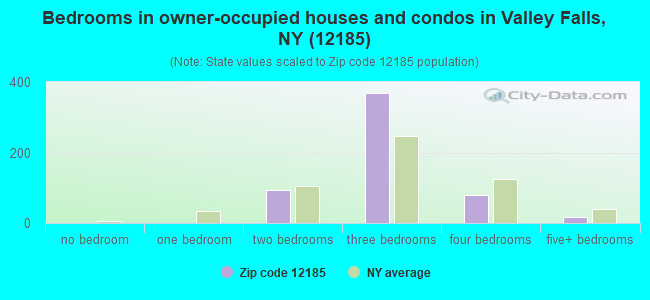
Median number of rooms in houses and condos:
Here:
6.3
State:
6.3
Median number of rooms in apartments:
Here:
5.5
State:
3.8
Notable locations in this zip code not listed on our city pages
Notable locations in zip code 12185: Elihu Farm (A), Valley Falls Village Wastewater Treatment Facility (B), Valley Falls Free Library (C), Valley Falls Volunteer Fire Department (D). Display/hide their locations on the map
Churches in zip code 12185 include: Saint Georges Church (A), Whiteside Church (B), Pittstown United Methodist Church (C). Display/hide their locations on the map
Size of family households: 222 2-persons, 203 3-persons, 87 4-persons, 27 5-persons, 6 6-persons, 5 7-or-more-persons
Size of nonfamily households: 125 1-person, 17 2-persons
217 married couples with children.
35 single-parent households (18 men, 17 women).
99.2% of residents of 12185 zip code speak English at home.
0.1% of residents speak Spanish at home (100% very well).
0.5% of residents speak other Indo-European language at home (100% very well).
0.1% of residents speak Asian or Pacific Island language at home (100% not well).
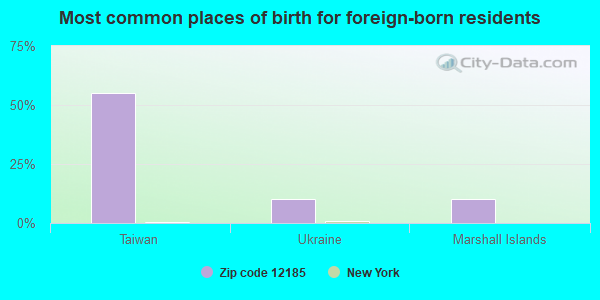
Foreign born population: 21 (1.2%) (86.3% of them are naturalized citizens)
This zip code:
1.2%
Whole state:
22.7%
55%Taiwan
10%Ukraine
10%Marshall Islands
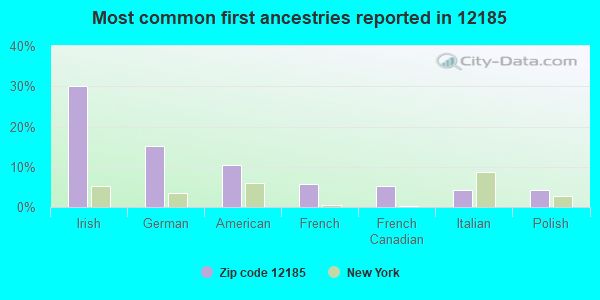
30%Irish
15%German
10%American
6%French
5%French Canadian
4%Italian
4%Polish
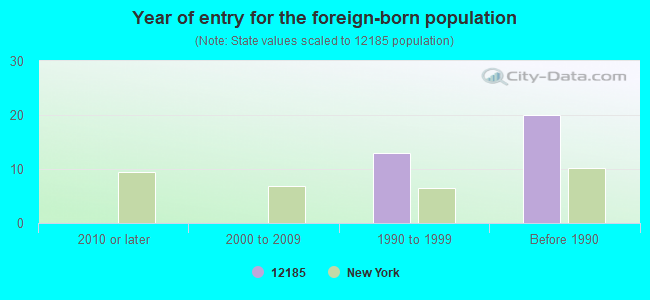
Year of entry for the foreign-born population
02010 or later
02000 to 2009
131990 to 1999
20Before 1990
Facilities with environmental interests located in this zip code:
C M BASSETT & SON INC (MAIN ST in VALLEY FALLS, NY)
(Resource Conservation and Recovery Act (tracking hazardous waste))
Housing units lacking complete plumbing facilities: 1.9% Housing units lacking complete kitchen facilities: 2.4%
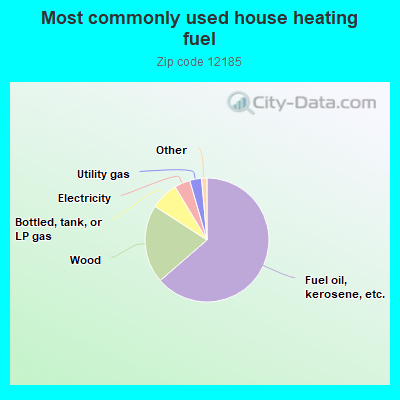
63.9%Fuel oil, kerosene, etc.
20.6%Wood
7.3%Bottled, tank, or LP gas
4.1%Electricity
3.1%Utility gas
0.9%Other fuel
0.6%Coal or coke
Population in 1990: 1,835. Population change in the 1990s: +261 (+14.2%).
Place of birth for U.S.-born residents:
This state: 1,501
Northeast: 128
Midwest: 33
South: 20
West: 31
66% of the 12185 zip code residents lived in the same house 5 years ago. Out of people who lived in different houses, 67% lived in this county. Out of people who lived in different counties, 50% lived in New York.
88% of the 12185 zip code residents lived in the same house 1 year ago. Out of people who lived in different houses, 21% moved from this county. Out of people who lived in different houses, 11% moved from different county within same state. Out of people who lived in different houses, 68% moved from different state. Out of people who lived in different houses, 5% moved from abroad.
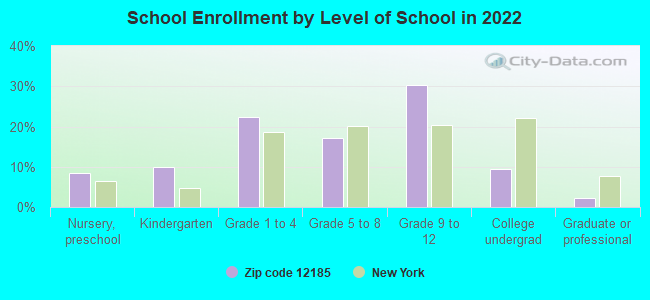
Private vs. public school enrollment:
Students in private schools in grades 1 to 8 (elementary and middle school): 28
Here:
27.3%
New York:
15.6%
Students in private schools in grades 9 to 12 (high school): 6
Here:
8.2%
New York:
15.0%
Students in private undergraduate colleges:
Here:
3.8%
New York:
39.2%
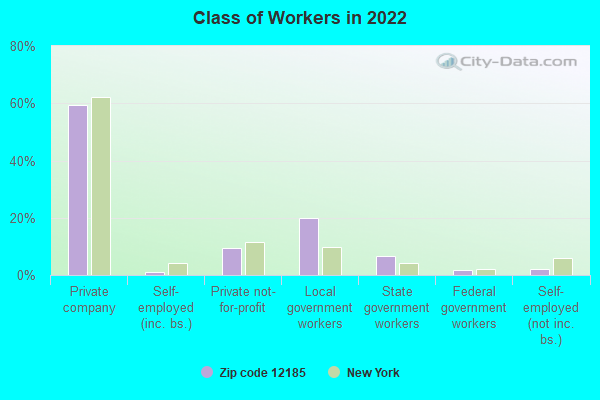
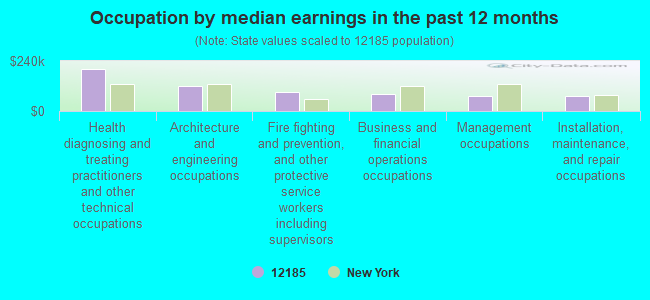
Occupation by median earnings in the past 12 months ($)
203,341Health diagnosing and treating practitioners and other technical occupations
122,182Architecture and engineering occupations
93,083Fire fighting and prevention, and other protective service workers including supervisors
81,993Business and financial operations occupations
74,002Management occupations
73,707Installation, maintenance, and repair occupations
Top industries in this zip code by the number of employees in 2005:
Construction: All Other Specialty Trade Contractors (5-9 employees: 1 establishment, 1-4 employees: 1 establishment)
Construction: New Single-Family Housing Construction (except Operative Builders) (1-4: 4)
Professional, Scientific, and Technical Services: Veterinary Services (5-9: 1)
Professional, Scientific, and Technical Services: Landscape Architectural Services (1-4: 2)
Construction: Site Preparation Contractors (1-4: 2)
Other Services (except Public Administration): Religious Organizations (1-4: 2)
Construction: Residential Remodelers (1-4: 1)
Fatal accident statistics in 2010:
Fatal accident count: 3
Vehicles involved in fatal accidents: 4
Fatal accidents caused by drunken drivers: 1
Fatalities: 4
Persons involved in fatal accidents: 7
Pedestrians involved in fatal accidents: 0
Home Mortgage Disclosure Act Aggregated Statistics For Year 2009 (Based on 4 partial tracts)
A) FHA, FSA/RHS & VA Home Purchase Loans
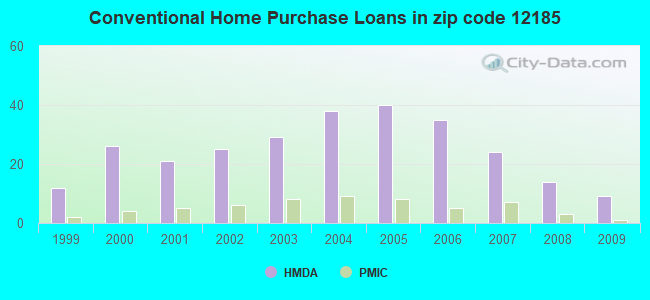
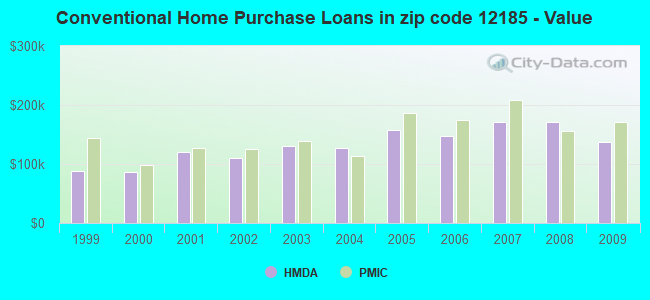
B) Conventional Home Purchase Loans
C) Refinancings
D) Home Improvement Loans
F) Non-occupant Loans on < 5 Family Dwellings (A B C & D)
G) Loans On Manufactured Home Dwelling (A B C & D)
Number
Average Value
Number
Average Value
Number
Average Value
Number
Average Value
Number
Average Value
Number
Average Value
LOANS ORIGINATED
11
$171,221
9
$137,533
42
$141,408
7
$30,689
0
$0
1
$108,570
APPLICATIONS APPROVED, NOT ACCEPTED
1
$175,080
1
$104,470
6
$151,287
1
$57,980
0
$0
0
$0
APPLICATIONS DENIED
2
$140,925
4
$125,958
31
$161,788
7
$38,243
2
$122,815
4
$53,270
APPLICATIONS WITHDRAWN
1
$134,630
1
$258,490
14
$174,209
0
$0
0
$0
0
$0
FILES CLOSED FOR INCOMPLETENESS
0
$0
1
$147,680
1
$120,960
0
$0
0
$0
0
$0
Aggregated Statistics For Year 2008 (Based on 4 partial tracts)
A) FHA, FSA/RHS & VA Home Purchase Loans
B) Conventional Home Purchase Loans
C) Refinancings
D) Home Improvement Loans
F) Non-occupant Loans on < 5 Family Dwellings (A B C & D)
G) Loans On Manufactured Home Dwelling (A B C & D)
Number
Average Value
Number
Average Value
Number
Average Value
Number
Average Value
Number
Average Value
Number
Average Value
LOANS ORIGINATED
6
$137,497
14
$171,923
35
$157,176
11
$36,365
1
$254,870
1
$137,970
APPLICATIONS APPROVED, NOT ACCEPTED
1
$164,360
4
$110,120
7
$135,780
2
$54,410
1
$158,710
2
$53,175
APPLICATIONS DENIED
0
$0
3
$265,790
30
$141,452
13
$39,066
2
$93,105
3
$72,277
APPLICATIONS WITHDRAWN
2
$207,295
2
$172,745
11
$184,725
1
$98,970
0
$0
0
$0
FILES CLOSED FOR INCOMPLETENESS
0
$0
0
$0
5
$166,756
1
$56,580
0
$0
0
$0
Aggregated Statistics For Year 2007 (Based on 4 partial tracts)
A) FHA, FSA/RHS & VA Home Purchase Loans
B) Conventional Home Purchase Loans
C) Refinancings
D) Home Improvement Loans
F) Non-occupant Loans on < 5 Family Dwellings (A B C & D)
G) Loans On Manufactured Home Dwelling (A B C & D)
Number
Average Value
Number
Average Value
Number
Average Value
Number
Average Value
Number
Average Value
Number
Average Value
LOANS ORIGINATED
4
$138,292
24
$171,463
42
$140,879
13
$40,356
2
$242,600
4
$86,350
APPLICATIONS APPROVED, NOT ACCEPTED
0
$0
4
$142,435
14
$143,456
4
$68,578
0
$0
1
$46,770
APPLICATIONS DENIED
0
$0
8
$122,788
38
$128,406
14
$44,556
2
$153,220
3
$57,960
APPLICATIONS WITHDRAWN
0
$0
2
$120,270
18
$140,003
2
$40,355
1
$101,840
1
$72,150
FILES CLOSED FOR INCOMPLETENESS
0
$0
2
$128,710
5
$179,202
1
$43,460
0
$0
0
$0
Aggregated Statistics For Year 2006 (Based on 4 partial tracts)
A) FHA, FSA/RHS & VA Home Purchase Loans
B) Conventional Home Purchase Loans
C) Refinancings
D) Home Improvement Loans
F) Non-occupant Loans on < 5 Family Dwellings (A B C & D)
G) Loans On Manufactured Home Dwelling (A B C & D)
Number
Average Value
Number
Average Value
Number
Average Value
Number
Average Value
Number
Average Value
Number
Average Value
LOANS ORIGINATED
5
$133,194
35
$147,907
55
$123,223
17
$51,669
2
$71,905
7
$67,587
APPLICATIONS APPROVED, NOT ACCEPTED
0
$0
6
$107,435
12
$129,989
2
$36,595
1
$63,770
3
$94,170
APPLICATIONS DENIED
1
$94,330
8
$181,188
40
$121,786
21
$38,040
2
$87,445
5
$67,338
APPLICATIONS WITHDRAWN
2
$120,025
5
$130,372
25
$127,496
4
$54,570
1
$121,950
1
$93,570
FILES CLOSED FOR INCOMPLETENESS
0
$0
2
$83,145
9
$158,918
1
$141,790
0
$0
0
$0
Aggregated Statistics For Year 2005 (Based on 4 partial tracts)
A) FHA, FSA/RHS & VA Home Purchase Loans
B) Conventional Home Purchase Loans
C) Refinancings
D) Home Improvement Loans
F) Non-occupant Loans on < 5 Family Dwellings (A B C & D)
G) Loans On Manufactured Home Dwelling (A B C & D)
Number
Average Value
Number
Average Value
Number
Average Value
Number
Average Value
Number
Average Value
Number
Average Value
LOANS ORIGINATED
4
$141,362
40
$158,464
58
$122,660
25
$46,302
1
$170,410
6
$87,800
APPLICATIONS APPROVED, NOT ACCEPTED
0
$0
7
$123,059
11
$123,058
3
$40,043
1
$64,170
3
$46,927
APPLICATIONS DENIED
2
$100,110
15
$96,760
50
$111,871
21
$42,879
1
$78,920
9
$50,457
APPLICATIONS WITHDRAWN
1
$103,180
4
$91,080
40
$128,698
5
$88,974
1
$61,180
3
$68,770
FILES CLOSED FOR INCOMPLETENESS
0
$0
4
$150,090
9
$154,838
1
$30,980
0
$0
1
$30,060
Aggregated Statistics For Year 2004 (Based on 4 partial tracts)
A) FHA, FSA/RHS & VA Home Purchase Loans
B) Conventional Home Purchase Loans
C) Refinancings
D) Home Improvement Loans
F) Non-occupant Loans on < 5 Family Dwellings (A B C & D)
G) Loans On Manufactured Home Dwelling (A B C & D)
Number
Average Value
Number
Average Value
Number
Average Value
Number
Average Value
Number
Average Value
Number
Average Value
LOANS ORIGINATED
7
$115,711
38
$127,247
62
$109,810
11
$34,364
6
$92,712
4
$72,695
APPLICATIONS APPROVED, NOT ACCEPTED
1
$99,540
3
$118,940
11
$112,416
2
$79,485
0
$0
0
$0
APPLICATIONS DENIED
0
$0
7
$90,170
51
$112,631
13
$30,939
1
$212,810
5
$42,930
APPLICATIONS WITHDRAWN
2
$79,535
6
$97,548
42
$113,241
4
$40,202
1
$73,380
2
$81,890
FILES CLOSED FOR INCOMPLETENESS
0
$0
3
$140,067
4
$131,640
2
$45,555
1
$22,630
0
$0
Aggregated Statistics For Year 2003 (Based on 4 partial tracts)
A) FHA, FSA/RHS & VA Home Purchase Loans
B) Conventional Home Purchase Loans
C) Refinancings
D) Home Improvement Loans
F) Non-occupant Loans on < 5 Family Dwellings (A B C & D)
Number
Average Value
Number
Average Value
Number
Average Value
Number
Average Value
Number
Average Value
LOANS ORIGINATED
8
$104,282
29
$130,033
99
$102,554
5
$18,068
3
$111,057
APPLICATIONS APPROVED, NOT ACCEPTED
0
$0
4
$98,260
16
$99,782
1
$21,210
1
$34,840
APPLICATIONS DENIED
1
$73,100
7
$65,170
45
$106,386
8
$27,068
1
$83,610
APPLICATIONS WITHDRAWN
2
$74,110
3
$108,750
27
$103,851
2
$15,970
0
$0
FILES CLOSED FOR INCOMPLETENESS
0
$0
0
$0
5
$111,104
0
$0
0
$0
Aggregated Statistics For Year 2002 (Based on 4 partial tracts)
A) FHA, FSA/RHS & VA Home Purchase Loans
B) Conventional Home Purchase Loans
C) Refinancings
D) Home Improvement Loans
F) Non-occupant Loans on < 5 Family Dwellings (A B C & D)
Number
Average Value
Number
Average Value
Number
Average Value
Number
Average Value
Number
Average Value
LOANS ORIGINATED
7
$108,641
25
$109,883
70
$97,601
7
$28,269
1
$66,030
APPLICATIONS APPROVED, NOT ACCEPTED
0
$0
2
$78,515
13
$98,695
2
$32,855
0
$0
APPLICATIONS DENIED
1
$81,790
9
$41,512
26
$97,589
8
$19,138
0
$0
APPLICATIONS WITHDRAWN
1
$135,970
2
$94,810
14
$85,726
2
$16,345
0
$0
FILES CLOSED FOR INCOMPLETENESS
0
$0
0
$0
3
$91,817
1
$22,920
0
$0
Aggregated Statistics For Year 2001 (Based on 4 partial tracts)
A) FHA, FSA/RHS & VA Home Purchase Loans
B) Conventional Home Purchase Loans
C) Refinancings
D) Home Improvement Loans
F) Non-occupant Loans on < 5 Family Dwellings (A B C & D)
Number
Average Value
Number
Average Value
Number
Average Value
Number
Average Value
Number
Average Value
LOANS ORIGINATED
10
$89,128
21
$119,825
52
$102,324
10
$13,653
1
$62,240
APPLICATIONS APPROVED, NOT ACCEPTED
0
$0
7
$59,913
5
$89,608
3
$15,990
0
$0
APPLICATIONS DENIED
0
$0
11
$49,117
31
$78,502
7
$13,911
1
$96,200
APPLICATIONS WITHDRAWN
0
$0
1
$42,090
13
$72,430
2
$28,715
0
$0
FILES CLOSED FOR INCOMPLETENESS
0
$0
0
$0
3
$107,847
0
$0
0
$0
Aggregated Statistics For Year 2000 (Based on 4 partial tracts)
A) FHA, FSA/RHS & VA Home Purchase Loans
B) Conventional Home Purchase Loans
C) Refinancings
D) Home Improvement Loans
F) Non-occupant Loans on < 5 Family Dwellings (A B C & D)
Number
Average Value
Number
Average Value
Number
Average Value
Number
Average Value
Number
Average Value
LOANS ORIGINATED
11
$84,691
26
$87,016
21
$70,701
16
$21,676
1
$37,560
APPLICATIONS APPROVED, NOT ACCEPTED
0
$0
6
$81,383
5
$53,184
5
$31,034
1
$40,090
APPLICATIONS DENIED
2
$59,385
22
$47,725
23
$63,720
8
$20,204
2
$41,700
APPLICATIONS WITHDRAWN
2
$79,770
1
$100,900
15
$68,056
1
$29,150
1
$24,430
FILES CLOSED FOR INCOMPLETENESS
0
$0
0
$0
1
$58,340
0
$0
0
$0
Aggregated Statistics For Year 1999 (Based on 2 partial tracts)
A) FHA, FSA/RHS & VA Home Purchase Loans
B) Conventional Home Purchase Loans
C) Refinancings
D) Home Improvement Loans
F) Non-occupant Loans on < 5 Family Dwellings (A B C & D)
Detailed PMIC statistics for the following Tracts:0518.00
, 0519.01
2002 - 2018 National Fire Incident Reporting System (NFIRS) incidents
According to the data from the years 2002 - 2018 the average number of fires per year is 8. The highest number of fires - 25 took place in 2004, and the least - 0 in 2016. The data has a declining trend.
When looking into fire subcategories, the most incidents belonged to: Structure Fires (65.6%), and Outside Fires (17.6%).
Fire incident types reported to NFIRS in Zip Code 12185


 Nearest zip codes: 12121, 12094, 12154, 12182, 12180, 12052.
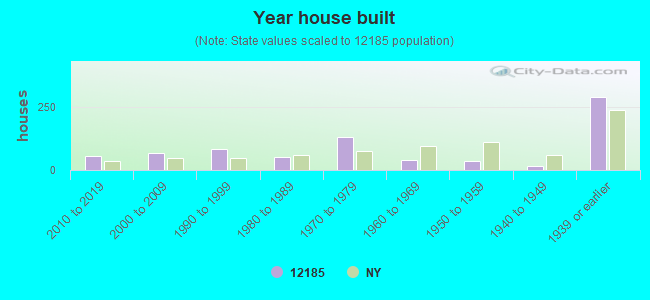


 According to the data from the years 2002 - 2018 the average number of fires per year is 8. The highest number of fires - 25 took place in 2004, and the least - 0 in 2016. The data has a declining trend.
 When looking into fire subcategories, the most incidents belonged to: Structure Fires (65.6%), and Outside Fires (17.6%).