Estimated zip code population in 2022: 305 Zip code population in 2010: 516 Zip code population in 2000: 534
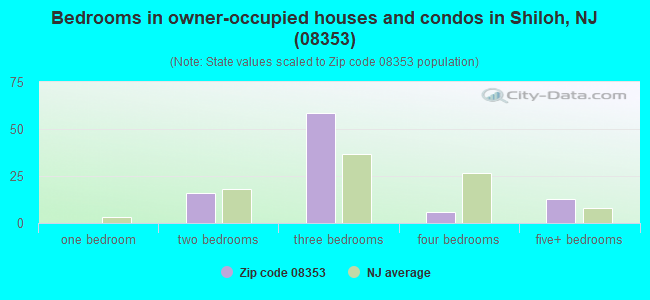
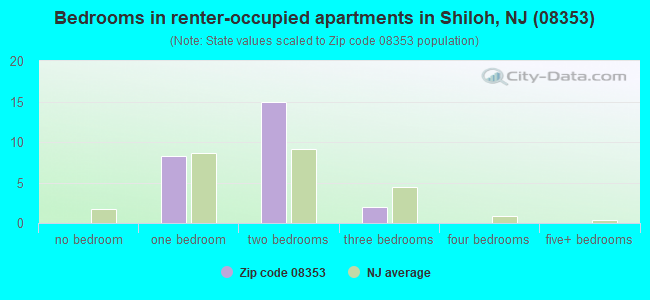
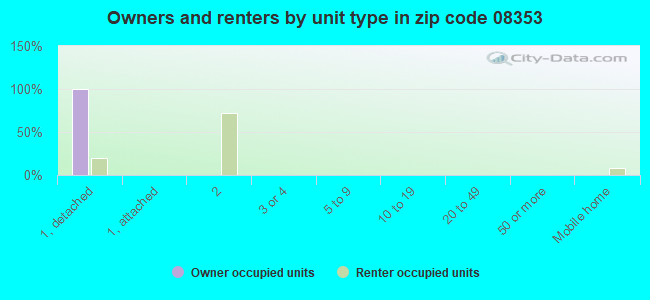
Houses and condos: 128 Renter-occupied apartments: 25
% of renters here:
21%
State:
35%
March 2022 cost of living index in zip code 08353: 93.2 (less than average, U.S. average is 100)
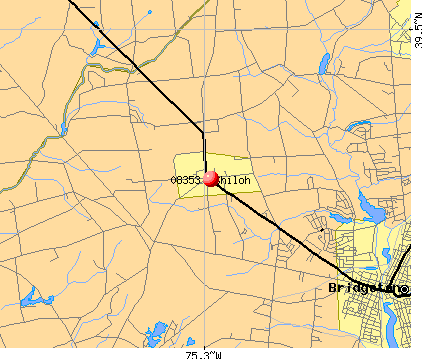
Land area: 1.2 sq. mi. Water area: 0.0 sq. mi.
Population density: 253 people per square mile
(very low).
OSM Map
Google Map
MSN Map
OSM Map
General Map
Google Map
MSN Map
OSM Map
Google Map
MSN Map
OSM Map
Google Map
MSN Map
Please wait while loading the map...
Real estate property taxes paid for housing units in 2022:
This zip code:
2.4% ($4,837)
New Jersey:
2.1% ($8,897)
Median real estate property taxes paid for housing units with mortgages in 2022: $4,886 (2.7%) Median real estate property taxes paid for housing units with no mortgage in 2022: $4,800 (2.2%)
Business Search- 14 Million verified businesses
Males: 117
(38.4%)
Females: 188
(61.6%)
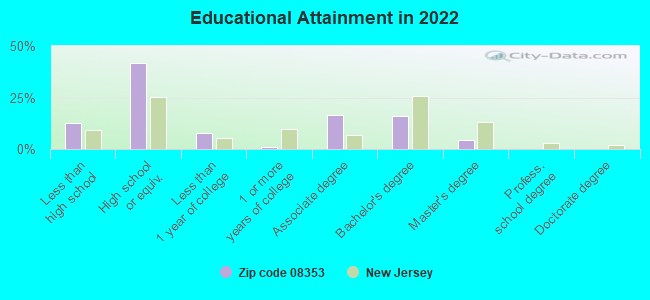
For population 25 years and over in 08353:
High school or higher: 85.0%
Bachelor's degree or higher: 19.9%
Graduate or professional degree: 4.3%
Unemployed: 7.2%
Mean travel time to work (commute): 27.5 minutes
For population 15 years and over in 08353:
Never married: 34.7%
Now married: 40.4%
Separated: 1.7%
Widowed: 10.5%
Divorced: 12.7%
Zip code 08353 compared to state average:
Median house value below state average.
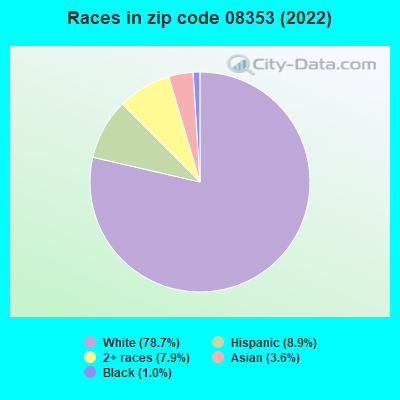
Black race population percentage significantly below state average.
Hispanic race population percentage below state average.
Median age above state average.
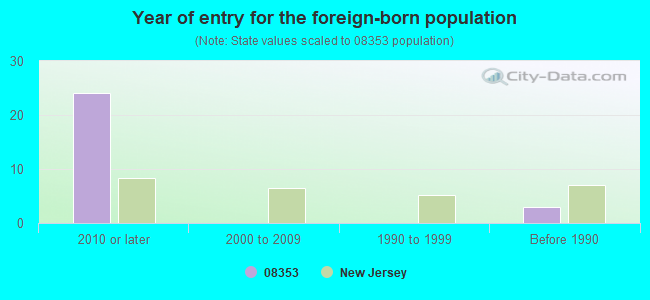
Foreign-born population percentage significantly below state average.
Renting percentage below state average.
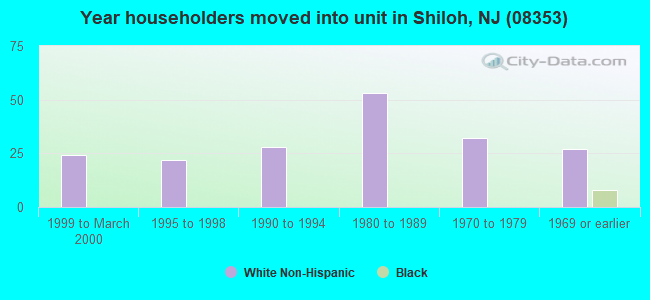
Length of stay since moving in significantly above state average.
Percentage of population with a bachelor's degree or higher below state average.
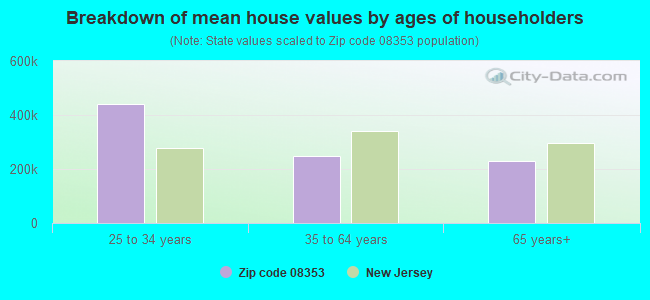
Estimated median house/condo value in 2022: $205,475
08353:
$205,475
New Jersey:
$428,900
Median resident age:
This zip code:
48.4 years
New Jersey median age:
40.4 years
Average household size:
This zip code:
2.6 people
New Jersey:
2.6 people
Averages for the 2020 tax year for zip code 08353, filed in 2021:
Average Adjusted Gross Income (AGI) in 2020: $58,754 (Individual Income Tax Returns)
Here:
$58,754
State:
$95,247
Salary/wage: $53,285 (reported on 76.9% of returns)
Here:
$53,285
State:
$80,635
(% of AGI for various income ranges: 1168.0% for AGIs below $25k, 2966.0% for AGIs $25k-50k, 6073.3% for AGIs $50k-75k, 10585.0% for AGIs $75k-100k, 15503.3% for AGIs $100k-200k)
Taxable interest for individuals: $256 (reported on 34.6% of returns)
This zip code:
$256
New Jersey:
$2,414
(% of AGI for various income ranges: 30.0% for AGIs $25k-50k, 13.3% for AGIs $50k-75k, 13.3% for AGIs $100k-200k)
Ordinary dividends: $950 (reported on 15.4% of returns)
Here:
$950
State:
$8,057
(% of AGI for various income ranges: 190.0% for AGIs $75k-100k)
Net capital gain/loss in AGI: +$400 (reported on 7.7% of returns)
Here:
+$400
State:
+$25,022
(% of AGI for various income ranges: 16.0% for AGIs below $25k)
Taxable individual retirement arrangement distribution: $8,900 (reported on 11.5% of returns)
08353:
$8,900
New Jersey:
$21,558
(% of AGI for various income ranges: 534.0% for AGIs $25k-50k)
Earned income credit: $1,450 (reported on 15.4% of returns)
Here:
$1,450
State:
$2,148
(% of AGI for various income ranges: 116.0% for AGIs below $25k)
Percentage of individuals using paid preparers for their 2020 taxes: 92.3%
Here:
92%
State:
92%
(% for various income ranges: 100.0% for AGIs below $25k, 85.7% for AGIs $25k-50k, 75.0% for AGIs $50k-75k, 100.0% for AGIs $75k-100k, 100.0% for AGIs $100k-200k)
Averages for the 2012 tax year for zip code 08353, filed in 2013:
Average Adjusted Gross Income (AGI) in 2012: $54,593 (Individual Income Tax Returns)
Here:
$54,593
State:
$79,688
Salary/wage: $46,252 (reported on 86.2% of returns)
Here:
$46,252
State:
$68,122
(% of AGI for various income ranges: 78.5% for AGIs below $25k, 81.2% for AGIs $25k-50k, 78.6% for AGIs $50k-75k, 77.4% for AGIs $75k-100k, 63.7% for AGIs $100k-200k)
Taxable interest for individuals: $400 (reported on 44.8% of returns)
This zip code:
$400
New Jersey:
$2,193
(% of AGI for various income ranges: 1.1% for AGIs below $25k, 0.6% for AGIs $50k-75k, 0.3% for AGIs $100k-200k)
Ordinary dividends: $867 (reported on 20.7% of returns)
Here:
$867
State:
$6,828
Net capital gain/loss in AGI: +$6,525 (reported on 13.8% of returns)
Here:
+$6,525
State:
+$15,358
Profit/loss from business: +$9,767 (reported on 10.3% of returns)
Here:
+$9,767
State:
+$19,577
Taxable individual retirement arrangement distribution: $9,150 (reported on 6.9% of returns)
08353:
$9,150
New Jersey:
$18,214
Total itemized deductions: $16,010 (18% of AGI, reported on 34.5% of returns)
Here:
$16,010
State:
$30,827
Here:
18.4% of AGI
State:
21.2% of AGI
Charity contributions: $2,986 (reported on 24.1% of returns)
Here:
$2,986
State:
$3,451
Taxes paid: $7,867 (reported on 31.0% of returns)
08353:
$7,867
State:
$15,801
Earned income credit: $2,225 (reported on 13.8% of returns)
Here:
$2,225
State:
$2,182
(% of AGI for various income ranges: 7.2% for AGIs below $25k)
Percentage of individuals using paid preparers for their 2012 taxes: 58.6%
Here:
59%
State:
65%
(% for various income ranges: 50.0% for AGIs below $25k, 66.7% for AGIs $25k-50k, 50.0% for AGIs $50k-75k, 66.7% for AGIs $75k-100k, 75.0% for AGIs $100k-200k)
Averages for the 2004 tax year for zip code 08353, filed in 2005:
Average Adjusted Gross Income (AGI) in 2004: $44,927 (Individual Income Tax Returns)
Here:
$44,927
State:
$64,921
Salary/wage: $44,246 (reported on 84.8% of returns)
Here:
$44,246
State:
$57,755
(% of AGI for various income ranges: 76.3% for AGIs below $10k, 64.5% for AGIs $10k-25k, 84.8% for AGIs $25k-50k, 85.9% for AGIs $50k-75k, 86.6% for AGIs $75k-100k, 85.8% for AGIs over 100k)
Taxable interest for individuals: $606 (reported on 56.3% of returns)
This zip code:
$606
New Jersey:
$2,068
(% of AGI for various income ranges: 4.7% for AGIs below $10k, 2.9% for AGIs $10k-25k, 0.8% for AGIs $25k-50k, 0.4% for AGIs $50k-75k, 0.5% for AGIs $75k-100k, 0.2% for AGIs over 100k)
Taxable dividends: $567 (reported on 22.2% of returns)
Here:
$567
State:
$3,959
(% of AGI for various income ranges: 1.0% for AGIs $10k-25k, 0.1% for AGIs $25k-50k, 0.2% for AGIs $50k-75k, 0.5% for AGIs $75k-100k, 0.1% for AGIs over 100k)
Net capital gain/loss: +$514 (reported on 11.6% of returns)
Here:
+$514
State:
+$13,591
(% of AGI for various income ranges: 11.2% for AGIs below $10k, -0.1% for AGIs $50k-75k, 0.0% for AGIs over 100k)
Profit/loss from business: +$3,360 (reported on 8.3% of returns)
Here:
+$3,360
State:
+$17,520
Total itemized deductions: $14,138 (19% of AGI, reported on 31.1% of returns)
Here:
$14,138
State:
$23,924
Here:
18.7% of AGI
State:
21.1% of AGI
(% of AGI for various income ranges: 12.6% for AGIs $25k-50k, 9.4% for AGIs $50k-75k, 12.4% for AGIs $75k-100k, 10.2% for AGIs over 100k)
Charity contributions deductions: $2,333 (3% of AGI, reported on 26.8% of returns)
Here:
$2,333
State:
$3,242
Here:
2.8% of AGI
State:
2.7% of AGI
(% of AGI for various income ranges: 0.7% for AGIs $25k-50k, 1.8% for AGIs $50k-75k, 2.1% for AGIs $75k-100k, 1.7% for AGIs over 100k)
Total tax: $5,659 (reported on 82.5% of returns)
08353:
$5,659
State:
$12,321
(% of AGI for various income ranges: 2.4% for AGIs below $10k, 4.3% for AGIs $10k-25k, 8.1% for AGIs $25k-50k, 9.7% for AGIs $50k-75k, 11.4% for AGIs $75k-100k, 14.9% for AGIs over 100k)
Earned income credit: $1,556 (reported on 8.9% of returns)
Here:
$1,556
State:
$1,711
Percentage of individuals using paid preparers for their 2004 taxes: 58.3%
Here:
58%
State:
65%
(% for various income ranges: 36.6% for AGIs below $10k, 66.7% for AGIs $10k-25k, 55.1% for AGIs $25k-50k, 60.8% for AGIs $50k-75k, 72.4% for AGIs $75k-100k, 57.1% for AGIs over 100k)
Household received Food Stamps/SNAP in the past 12 months: 16 Household did not receive Food Stamps/SNAP in the past 12 months: 102
Women who had a birth in the past 12 months: 2 (3 now married, 0 unmarried) Women who did not have a birth in the past 12 months: 60 (21 now married, 39 unmarried)
Housing units in zip code 08353 with a mortgage: 41 (4 second mortgage, 4 both second mortgage and home equity loan) Median monthly owner costs for units with a mortgage: $1,501 Median monthly owner costs for units without a mortgage: $736
Residents with income below the poverty level in 2022:
This zip code:
9.8%
Whole state:
9.7%
Residents with income below 50% of the poverty level in 2022:
This zip code:
4.9%
Whole state:
5.2%
Median number of rooms in houses and condos:
Here:
7.4
State:
6.8
Median number of rooms in apartments:
Here:
4.5
State:
3.9
Notable locations in this zip code not listed on our city pages
Size of family households: 30 2-persons, 23 3-persons, 11 4-persons, 5 5-persons, 1 6-persons, 4 7-or-more-persons
Size of nonfamily households: 32 1-person, 8 2-persons
16 married couples with children.
17 single-parent households (2 men, 15 women).
86.8% of residents of 08353 zip code speak English at home.
13.5% of residents speak Spanish at home (3% very well, 56% well, 41% not well).
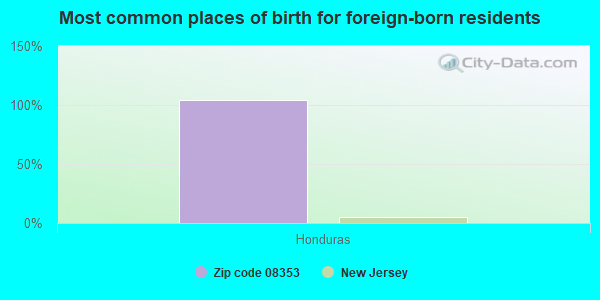
Foreign born population: 25 (8.3%) (0.0% of them are naturalized citizens)
:
8.3%
Whole state:
23.5%
104%Honduras
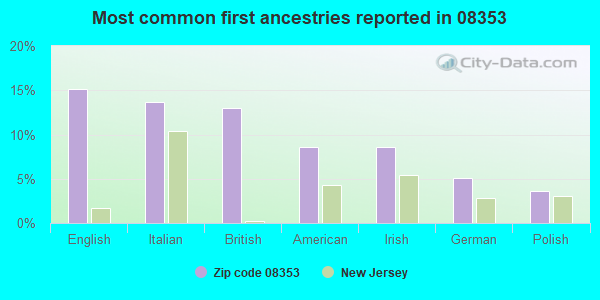
15%English
14%Italian
13%British
9%American
9%Irish
5%German
4%Polish
Year of entry for the foreign-born population
242010 or later
02000 to 2009
01990 to 1999
3Before 1990
Facilities with environmental interests located in this zip code:
BENDERS AUTO BODY (HIGHWAY 49 MILE MARKER 22 in SHILOH, NJ)
(Resource Conservation and Recovery Act (tracking hazardous waste))
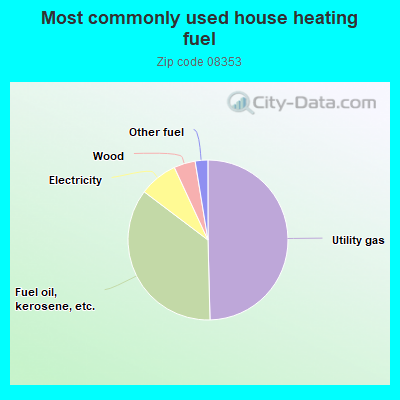
50.3%Utility gas
36.2%Fuel oil, kerosene, etc.
7.9%Electricity
4.4%Wood
2.6%Other fuel
Place of birth for U.S.-born residents:
This state: 208
Northeast: 28
Midwest: 2
South: 27
West: 12
79% of the 08353 zip code residents lived in the same house 5 years ago. Out of people who lived in different houses, 42% lived in this county. Out of people who lived in different counties, 50% lived in New Jersey.
97% of the 08353 zip code residents lived in the same house 1 year ago. Out of people who lived in different houses, 14% moved from this county. Out of people who lived in different houses, 71% moved from different county within same state.
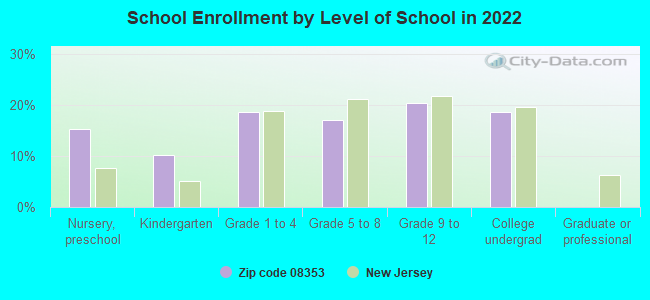
Private vs. public school enrollment:
Students in private schools in grades 1 to 8 (elementary and middle school): 6
Here:
29.3%
New Jersey:
12.3%
Students in private schools in grades 9 to 12 (high school):
Here:
0.0%
New Jersey:
13.1%
Students in private undergraduate colleges:
Here:
0.0%
New Jersey:
33.2%
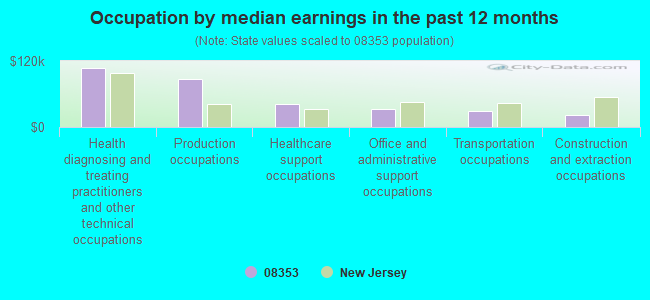
Occupation by median earnings in the past 12 months ($)
106,765Health diagnosing and treating practitioners and other technical occupations
87,348Production occupations
41,670Healthcare support occupations
32,615Office and administrative support occupations
28,665Transportation occupations
22,125Construction and extraction occupations
Top industries in this zip code by the number of employees in 2005:
Wholesale Trade: Farm and Garden Machinery and Equipment Merchant Wholesalers (20-49 employees: 1 establishment)
Arts, Entertainment, and Recreation: All Other Amusement and Recreation Industries (10-19: 1)
Health Care and Social Assistance: Offices of Physicians (except Mental Health Specialists) (10-19: 1)
Finance and Insurance: Commercial Banking (5-9: 1)
Other Services (except Public Administration): General Automotive Repair (1-4: 2)
Other Services (except Public Administration): Automotive Body, Paint, and Interior Repair and Maintenance (1-4: 1)
Home Mortgage Disclosure Act Aggregated Statistics For Year 2009 (Based on 2 partial tracts)
A) FHA, FSA/RHS & VA Home Purchase Loans
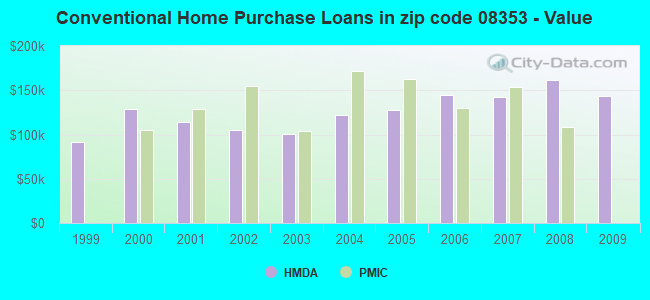
B) Conventional Home Purchase Loans
C) Refinancings
D) Home Improvement Loans
Number
Average Value
Number
Average Value
Number
Average Value
Number
Average Value
LOANS ORIGINATED
2
$139,990
1
$144,060
6
$144,588
2
$37,290
APPLICATIONS APPROVED, NOT ACCEPTED
0
$0
0
$0
0
$0
0
$0
APPLICATIONS DENIED
0
$0
0
$0
3
$166,853
0
$0
APPLICATIONS WITHDRAWN
0
$0
0
$0
1
$203,610
0
$0
FILES CLOSED FOR INCOMPLETENESS
0
$0
0
$0
0
$0
0
$0
Aggregated Statistics For Year 2008 (Based on 2 partial tracts)
A) FHA, FSA/RHS & VA Home Purchase Loans
B) Conventional Home Purchase Loans
C) Refinancings
D) Home Improvement Loans
Number
Average Value
Number
Average Value
Number
Average Value
Number
Average Value
LOANS ORIGINATED
1
$170,920
2
$161,755
6
$143,392
3
$44,857
APPLICATIONS APPROVED, NOT ACCEPTED
0
$0
0
$0
1
$200,840
1
$19,370
APPLICATIONS DENIED
0
$0
0
$0
4
$160,540
1
$51,990
APPLICATIONS WITHDRAWN
0
$0
0
$0
2
$161,790
0
$0
FILES CLOSED FOR INCOMPLETENESS
0
$0
0
$0
1
$103,900
0
$0
Aggregated Statistics For Year 2007 (Based on 2 partial tracts)
B) Conventional Home Purchase Loans
C) Refinancings
D) Home Improvement Loans
Number
Average Value
Number
Average Value
Number
Average Value
LOANS ORIGINATED
3
$141,847
7
$139,556
3
$67,147
APPLICATIONS APPROVED, NOT ACCEPTED
0
$0
1
$175,560
0
$0
APPLICATIONS DENIED
0
$0
6
$130,750
2
$77,980
APPLICATIONS WITHDRAWN
0
$0
3
$178,597
0
$0
FILES CLOSED FOR INCOMPLETENESS
0
$0
1
$186,930
0
$0
Aggregated Statistics For Year 2006 (Based on 2 partial tracts)
A) FHA, FSA/RHS & VA Home Purchase Loans
B) Conventional Home Purchase Loans
C) Refinancings
D) Home Improvement Loans
F) Non-occupant Loans on < 5 Family Dwellings (A B C & D)
Number
Average Value
Number
Average Value
Number
Average Value
Number
Average Value
Number
Average Value
LOANS ORIGINATED
1
$130,750
4
$144,495
10
$121,430
4
$40,112
1
$44,580
APPLICATIONS APPROVED, NOT ACCEPTED
0
$0
1
$117,360
2
$154,310
0
$0
0
$0
APPLICATIONS DENIED
0
$0
1
$174,280
4
$133,275
2
$52,585
0
$0
APPLICATIONS WITHDRAWN
0
$0
0
$0
4
$149,768
0
$0
0
$0
FILES CLOSED FOR INCOMPLETENESS
0
$0
0
$0
1
$172,340
0
$0
0
$0
Aggregated Statistics For Year 2005 (Based on 2 partial tracts)
B) Conventional Home Purchase Loans
C) Refinancings
D) Home Improvement Loans
F) Non-occupant Loans on < 5 Family Dwellings (A B C & D)
Number
Average Value
Number
Average Value
Number
Average Value
Number
Average Value
LOANS ORIGINATED
5
$128,208
10
$113,531
3
$41,390
1
$37,030
APPLICATIONS APPROVED, NOT ACCEPTED
0
$0
1
$154,460
0
$0
0
$0
APPLICATIONS DENIED
1
$55,130
5
$145,904
2
$82,245
0
$0
APPLICATIONS WITHDRAWN
1
$85,420
6
$149,088
1
$76,000
0
$0
FILES CLOSED FOR INCOMPLETENESS
0
$0
1
$73,450
0
$0
0
$0
Aggregated Statistics For Year 2004 (Based on 2 partial tracts)
B) Conventional Home Purchase Loans
C) Refinancings
D) Home Improvement Loans
F) Non-occupant Loans on < 5 Family Dwellings (A B C & D)
Number
Average Value
Number
Average Value
Number
Average Value
Number
Average Value
LOANS ORIGINATED
5
$121,490
9
$111,527
2
$39,195
1
$86,020
APPLICATIONS APPROVED, NOT ACCEPTED
0
$0
1
$147,210
0
$0
0
$0
APPLICATIONS DENIED
1
$104,050
4
$116,858
2
$19,000
0
$0
APPLICATIONS WITHDRAWN
0
$0
3
$125,040
1
$56,030
0
$0
FILES CLOSED FOR INCOMPLETENESS
0
$0
1
$78,170
0
$0
0
$0
Aggregated Statistics For Year 2003 (Based on 2 partial tracts)
A) FHA, FSA/RHS & VA Home Purchase Loans
B) Conventional Home Purchase Loans
C) Refinancings
D) Home Improvement Loans
Number
Average Value
Number
Average Value
Number
Average Value
Number
Average Value
LOANS ORIGINATED
1
$84,220
3
$100,907
17
$100,109
2
$37,215
APPLICATIONS APPROVED, NOT ACCEPTED
0
$0
1
$86,240
2
$118,185
0
$0
APPLICATIONS DENIED
0
$0
1
$43,910
7
$99,003
1
$29,470
APPLICATIONS WITHDRAWN
0
$0
0
$0
5
$94,174
0
$0
FILES CLOSED FOR INCOMPLETENESS
0
$0
0
$0
1
$108,680
0
$0
Aggregated Statistics For Year 2002 (Based on 2 partial tracts)
A) FHA, FSA/RHS & VA Home Purchase Loans
B) Conventional Home Purchase Loans
C) Refinancings
D) Home Improvement Loans
Number
Average Value
Number
Average Value
Number
Average Value
Number
Average Value
LOANS ORIGINATED
1
$53,180
3
$105,367
10
$84,973
2
$28,875
APPLICATIONS APPROVED, NOT ACCEPTED
0
$0
0
$0
2
$83,590
0
$0
APPLICATIONS DENIED
0
$0
1
$30,670
4
$91,742
1
$13,840
APPLICATIONS WITHDRAWN
0
$0
0
$0
3
$109,707
0
$0
FILES CLOSED FOR INCOMPLETENESS
0
$0
0
$0
1
$85,420
0
$0
Aggregated Statistics For Year 2001 (Based on 2 partial tracts)
A) FHA, FSA/RHS & VA Home Purchase Loans
B) Conventional Home Purchase Loans
C) Refinancings
D) Home Improvement Loans
Number
Average Value
Number
Average Value
Number
Average Value
Number
Average Value
LOANS ORIGINATED
1
$78,320
2
$113,735
5
$84,434
2
$28,500
APPLICATIONS APPROVED, NOT ACCEPTED
0
$0
0
$0
1
$35,830
0
$0
APPLICATIONS DENIED
0
$0
0
$0
3
$87,540
1
$23,560
APPLICATIONS WITHDRAWN
0
$0
0
$0
3
$76,893
0
$0
FILES CLOSED FOR INCOMPLETENESS
0
$0
0
$0
1
$78,760
0
$0
Aggregated Statistics For Year 2000 (Based on 2 partial tracts)
A) FHA, FSA/RHS & VA Home Purchase Loans
B) Conventional Home Purchase Loans
C) Refinancings
D) Home Improvement Loans
Number
Average Value
Number
Average Value
Number
Average Value
Number
Average Value
LOANS ORIGINATED
1
$73,150
2
$128,355
2
$72,895
1
$39,050
APPLICATIONS APPROVED, NOT ACCEPTED
0
$0
0
$0
1
$40,090
1
$18,180
APPLICATIONS DENIED
0
$0
1
$64,250
3
$64,103
1
$31,490
APPLICATIONS WITHDRAWN
0
$0
0
$0
2
$71,320
0
$0
FILES CLOSED FOR INCOMPLETENESS
0
$0
0
$0
1
$53,030
0
$0
Aggregated Statistics For Year 1999 (Based on 1 partial tract)


 Nearest zip codes: 08302, 08323, 08001, 08318, 08072, 08320.