Estimated zip code population in 2022: 3,203 Zip code population in 2010: 3,279 Zip code population in 2000: 3,595
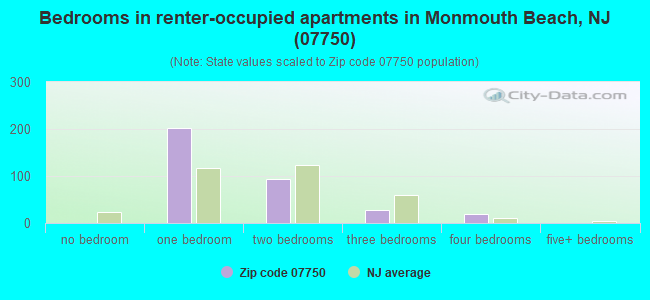
Houses and condos: 1,927 Renter-occupied apartments: 337
% of renters here:
22%
State:
35%
March 2022 cost of living index in zip code 07750: 122.3 (high, U.S. average is 100)
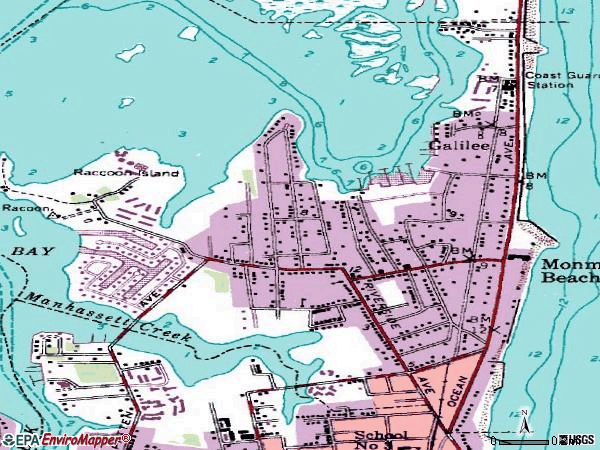
Land area: 1.1 sq. mi. Water area: 1.0 sq. mi.
Population density: 2,979 people per square mile
(average).
OSM Map
Google Map
MSN Map
OSM Map
General Map
Google Map
MSN Map
OSM Map
Google Map
MSN Map
OSM Map
Google Map
MSN Map
Please wait while loading the map...
Real estate property taxes paid for housing units in 2022:
This zip code:
1.0% ($9,521)
New Jersey:
2.1% ($8,897)
Median real estate property taxes paid for housing units with mortgages in 2022: $9,557 (0.9%) Median real estate property taxes paid for housing units with no mortgage in 2022: $9,121 (1.0%)
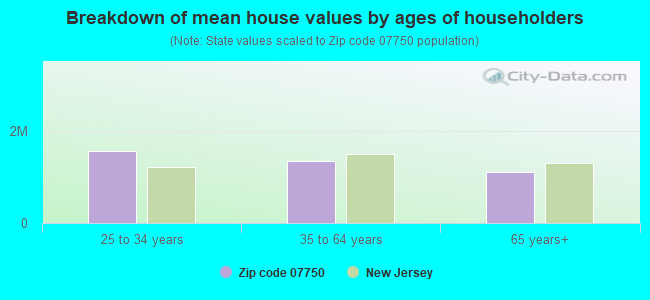
Estimated median house/condo value in 2022: $975,229
07750:
$975,229
New Jersey:
$428,900
Median resident age:
This zip code:
58.5 years
New Jersey median age:
40.4 years
Average household size:
This zip code:
2.1 people
New Jersey:
2.6 people
Averages for the 2020 tax year for zip code 07750, filed in 2021:
Average Adjusted Gross Income (AGI) in 2020: $258,985 (Individual Income Tax Returns)
Here:
$258,985
State:
$95,247
Salary/wage: $234,267 (reported on 72.3% of returns)
Here:
$234,267
State:
$80,635
(% of AGI for various income ranges: 1334.1% for AGIs below $25k, 3521.8% for AGIs $25k-50k, 5786.7% for AGIs $50k-75k, 9171.4% for AGIs $75k-100k, 22333.6% for AGIs $100k-200k, 217335.0% for AGIs over 200k)
Taxable interest for individuals: $4,118 (reported on 54.9% of returns)
This zip code:
$4,118
New Jersey:
$2,414
(% of AGI for various income ranges: 92.4% for AGIs below $25k, 143.6% for AGIs $25k-50k, 135.8% for AGIs $50k-75k, 451.4% for AGIs $75k-100k, 502.1% for AGIs $100k-200k, 2218.3% for AGIs over 200k)
Ordinary dividends: $15,051 (reported on 54.3% of returns)
Here:
$15,051
State:
$8,057
(% of AGI for various income ranges: 154.1% for AGIs below $25k, 562.7% for AGIs $25k-50k, 627.5% for AGIs $50k-75k, 1120.0% for AGIs $75k-100k, 1160.7% for AGIs $100k-200k, 9173.3% for AGIs over 200k)
Net capital gain/loss in AGI: +$44,430 (reported on 50.5% of returns)
Here:
+$44,430
State:
+$25,022
(% of AGI for various income ranges: 55.3% for AGIs below $25k, 255.5% for AGIs $25k-50k, 349.2% for AGIs $50k-75k, 552.9% for AGIs $75k-100k, 2930.7% for AGIs $100k-200k, 30030.0% for AGIs over 200k)
Profit/loss from business: +$50,823 (reported on 21.2% of returns)
Here:
+$50,823
State:
+$18,035
(% of AGI for various income ranges: 128.2% for AGIs below $25k, 260.9% for AGIs $25k-50k, 470.0% for AGIs $50k-75k, 745.7% for AGIs $75k-100k, 3332.9% for AGIs $100k-200k, 11303.3% for AGIs over 200k)
Taxable individual retirement arrangement distribution: $30,187 (reported on 16.8% of returns)
07750:
$30,187
New Jersey:
$21,558
(% of AGI for various income ranges: 108.2% for AGIs below $25k, 440.9% for AGIs $25k-50k, 652.5% for AGIs $50k-75k, 1187.1% for AGIs $75k-100k, 2136.4% for AGIs $100k-200k, 3403.3% for AGIs over 200k)
Self-employed (Keogh) retirement plans: $36,517 (reported on 3.3% of returns)
07750:
$36,517
New Jersey:
$30,844
(% of AGI for various income ranges: 377.1% for AGIs $100k-200k, 1385.8% for AGIs over 200k)
Total itemized deductions: $38,625 (reported on 29.9% of returns)
Here:
$38,625
State:
$32,863
(% of AGI for various income ranges: 1104.5% for AGIs $25k-50k, 1055.0% for AGIs $50k-75k, 1734.3% for AGIs $75k-100k, 3070.0% for AGIs $100k-200k, 11042.5% for AGIs over 200k)
Charity contributions: $8,378 (reported on 27.7% of returns)
Here:
$8,378
State:
$7,880
(% of AGI for various income ranges: 46.4% for AGIs $25k-50k, 76.7% for AGIs $50k-75k, 205.7% for AGIs $75k-100k, 409.3% for AGIs $100k-200k, 2844.2% for AGIs over 200k)
Taxes paid: $9,380 (reported on 29.9% of returns)
07750:
$9,380
State:
$9,183
(% of AGI for various income ranges: 258.2% for AGIs $25k-50k, 228.3% for AGIs $50k-75k, 557.1% for AGIs $75k-100k, 982.1% for AGIs $100k-200k, 2363.3% for AGIs over 200k)
Earned income credit: $720 (reported on 2.7% of returns)
Here:
$720
State:
$2,148
(% of AGI for various income ranges: 21.2% for AGIs below $25k)
Percentage of individuals using paid preparers for their 2020 taxes: 91.8%
Here:
92%
State:
92%
(% for various income ranges: 92.1% for AGIs below $25k, 90.0% for AGIs $25k-50k, 86.4% for AGIs $50k-75k, 88.2% for AGIs $75k-100k, 92.5% for AGIs $100k-200k, 95.7% for AGIs over 200k)
Averages for the 2012 tax year for zip code 07750, filed in 2013:
Average Adjusted Gross Income (AGI) in 2012: $164,809 (Individual Income Tax Returns)
Here:
$164,809
State:
$79,688
Salary/wage: $132,178 (reported on 72.7% of returns)
Here:
$132,178
State:
$68,122
(% of AGI for various income ranges: 50.6% for AGIs below $25k, 55.7% for AGIs $25k-50k, 47.7% for AGIs $50k-75k, 52.9% for AGIs $75k-100k, 61.9% for AGIs $100k-200k, 58.8% for AGIs over 200k)
Taxable interest for individuals: $4,640 (reported on 58.7% of returns)
This zip code:
$4,640
New Jersey:
$2,193
(% of AGI for various income ranges: 4.7% for AGIs below $25k, 3.0% for AGIs $25k-50k, 3.3% for AGIs $50k-75k, 1.9% for AGIs $75k-100k, 1.3% for AGIs $100k-200k, 1.5% for AGIs over 200k)
Ordinary dividends: $11,494 (reported on 51.2% of returns)
Here:
$11,494
State:
$6,828
(% of AGI for various income ranges: 10.0% for AGIs below $25k, 5.6% for AGIs $25k-50k, 5.5% for AGIs $50k-75k, 5.4% for AGIs $75k-100k, 3.1% for AGIs $100k-200k, 3.2% for AGIs over 200k)
Net capital gain/loss in AGI: +$20,038 (reported on 44.2% of returns)
Here:
+$20,038
State:
+$15,358
(% of AGI for various income ranges: 1.8% for AGIs $25k-50k, 1.0% for AGIs $50k-75k, 1.1% for AGIs $75k-100k, 1.9% for AGIs $100k-200k, 7.2% for AGIs over 200k)
Profit/loss from business: +$51,635 (reported on 18.0% of returns)
Here:
+$51,635
State:
+$19,577
(% of AGI for various income ranges: 17.5% for AGIs below $25k, 8.0% for AGIs $25k-50k, 4.8% for AGIs $50k-75k, 3.1% for AGIs $75k-100k, 8.2% for AGIs $100k-200k, 4.9% for AGIs over 200k)
Taxable individual retirement arrangement distribution: $19,982 (reported on 19.2% of returns)
07750:
$19,982
New Jersey:
$18,214
(% of AGI for various income ranges: 7.2% for AGIs below $25k, 6.8% for AGIs $25k-50k, 5.5% for AGIs $50k-75k, 5.2% for AGIs $75k-100k, 4.9% for AGIs $100k-200k, 0.9% for AGIs over 200k)
Self-employment retirement plans: $27,680 (reported on 2.9% of returns)
07750:
$27,680
New Jersey:
$24,511
(% of AGI for various income ranges: 3.7% for AGIs $50k-75k, 0.5% for AGIs over 200k)
Total itemized deductions: $53,550 (22% of AGI, reported on 64.5% of returns)
Here:
$53,550
State:
$30,827
Here:
22.4% of AGI
State:
21.2% of AGI
(% of AGI for various income ranges: 40.0% for AGIs below $25k, 32.1% for AGIs $25k-50k, 26.6% for AGIs $50k-75k, 23.8% for AGIs $75k-100k, 31.4% for AGIs $100k-200k, 16.9% for AGIs over 200k)
Charity contributions: $3,693 (reported on 57.0% of returns)
Here:
$3,693
State:
$3,451
(% of AGI for various income ranges: 1.6% for AGIs below $25k, 1.7% for AGIs $25k-50k, 1.9% for AGIs $50k-75k, 1.5% for AGIs $75k-100k, 1.7% for AGIs $100k-200k, 1.1% for AGIs over 200k)
Taxes paid: $25,339 (reported on 64.0% of returns)
07750:
$25,339
State:
$15,801
(% of AGI for various income ranges: 11.3% for AGIs below $25k, 9.2% for AGIs $25k-50k, 9.4% for AGIs $50k-75k, 8.8% for AGIs $75k-100k, 9.6% for AGIs $100k-200k, 10.0% for AGIs over 200k)
Earned income credit: $1,400 (reported on 2.9% of returns)
Here:
$1,400
State:
$2,182
(% of AGI for various income ranges: 1.7% for AGIs below $25k)
Percentage of individuals using paid preparers for their 2012 taxes: 74.4%
Here:
74%
State:
65%
(% for various income ranges: 65.9% for AGIs below $25k, 69.6% for AGIs $25k-50k, 71.4% for AGIs $50k-75k, 70.6% for AGIs $75k-100k, 80.0% for AGIs $100k-200k, 87.5% for AGIs over 200k)
Averages for the 2004 tax year for zip code 07750, filed in 2005:
Average Adjusted Gross Income (AGI) in 2004: $117,301 (Individual Income Tax Returns)
Here:
$117,301
State:
$64,921
Salary/wage: $95,831 (reported on 71.3% of returns)
Here:
$95,831
State:
$57,755
(% of AGI for various income ranges: 584.4% for AGIs below $10k, 50.1% for AGIs $10k-25k, 56.8% for AGIs $25k-50k, 57.7% for AGIs $50k-75k, 62.8% for AGIs $75k-100k, 57.3% for AGIs over 100k)
Taxable interest for individuals: $4,203 (reported on 68.7% of returns)
This zip code:
$4,203
New Jersey:
$2,068
(% of AGI for various income ranges: 63.4% for AGIs below $10k, 5.4% for AGIs $10k-25k, 3.7% for AGIs $25k-50k, 3.9% for AGIs $50k-75k, 3.1% for AGIs $75k-100k, 2.0% for AGIs over 100k)
Taxable dividends: $5,972 (reported on 56.6% of returns)
Here:
$5,972
State:
$3,959
(% of AGI for various income ranges: 69.3% for AGIs below $10k, 7.9% for AGIs $10k-25k, 3.8% for AGIs $25k-50k, 5.2% for AGIs $50k-75k, 3.9% for AGIs $75k-100k, 2.3% for AGIs over 100k)
Net capital gain/loss: +$17,570 (reported on 51.1% of returns)
Here:
+$17,570
State:
+$13,591
(% of AGI for various income ranges: -49.8% for AGIs below $10k, -1.5% for AGIs $10k-25k, -0.2% for AGIs $25k-50k, 2.3% for AGIs $50k-75k, 3.0% for AGIs $75k-100k, 9.4% for AGIs over 100k)
Profit/loss from business: +$45,747 (reported on 18.2% of returns)
Here:
+$45,747
State:
+$17,520
(% of AGI for various income ranges: 62.3% for AGIs below $10k, 15.6% for AGIs $10k-25k, 8.0% for AGIs $25k-50k, 3.9% for AGIs $50k-75k, 6.0% for AGIs $75k-100k, 7.2% for AGIs over 100k)
IRA payment deduction: $3,732 (reported on 4.3% of returns)
07750:
$3,732
New Jersey:
$3,270
Self-employed pension: $21,083 (reported on 2.5% of returns)
Here:
$21,083
New Jersey:
$17,258
Total itemized deductions: $35,537 (21% of AGI, reported on 62.6% of returns)
Here:
$35,537
State:
$23,924
Here:
20.6% of AGI
State:
21.1% of AGI
(% of AGI for various income ranges: 235.4% for AGIs below $10k, 37.3% for AGIs $10k-25k, 23.7% for AGIs $25k-50k, 23.8% for AGIs $50k-75k, 22.9% for AGIs $75k-100k, 17.1% for AGIs over 100k)
Charity contributions deductions: $5,088 (3% of AGI, reported on 58.3% of returns)
Here:
$5,088
State:
$3,242
Here:
2.8% of AGI
State:
2.7% of AGI
(% of AGI for various income ranges: 7.4% for AGIs below $10k, 2.2% for AGIs $10k-25k, 2.4% for AGIs $25k-50k, 2.3% for AGIs $50k-75k, 2.6% for AGIs $75k-100k, 2.5% for AGIs over 100k)
Total tax: $28,396 (reported on 81.7% of returns)
07750:
$28,396
State:
$12,321
(% of AGI for various income ranges: 19.1% for AGIs below $10k, 5.4% for AGIs $10k-25k, 9.2% for AGIs $25k-50k, 10.8% for AGIs $50k-75k, 11.8% for AGIs $75k-100k, 22.4% for AGIs over 100k)
Earned income credit: $1,208 (reported on 3.8% of returns)
Here:
$1,208
State:
$1,711
Percentage of individuals using paid preparers for their 2004 taxes: 72.7%
Here:
73%
State:
65%
(% for various income ranges: 66.6% for AGIs below $10k, 71.2% for AGIs $10k-25k, 65.5% for AGIs $25k-50k, 71.2% for AGIs $50k-75k, 71.4% for AGIs $75k-100k, 82.5% for AGIs over 100k)
Household received Food Stamps/SNAP in the past 12 months: 23 Household did not receive Food Stamps/SNAP in the past 12 months: 1,515
Women who had a birth in the past 12 months: 5 (0 now married, 5 unmarried) Women who did not have a birth in the past 12 months: 411 (127 now married, 284 unmarried)
Housing units in zip code 07750 with a mortgage: 552 (81 second mortgage, 73 both second mortgage and home equity loan) Houses without a mortgage: 13
Median monthly owner costs for units with a mortgage: $3,744 Median monthly owner costs for units without a mortgage: $1,425
Residents with income below the poverty level in 2022:
This zip code:
2.6%
Whole state:
9.7%
Residents with income below 50% of the poverty level in 2022:
This zip code:
1.1%
Whole state:
5.2%
Median number of rooms in houses and condos:
Here:
7.1
State:
6.8
Median number of rooms in apartments:
Here:
3.0
State:
3.9
Notable locations in this zip code not listed on our city pages
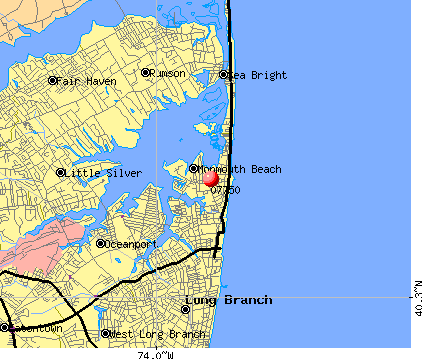
Notable locations in zip code 07750: Monmouth Beach Club (A), Monmouth Beach First Aid Squad (B), Monmouth Beach Fire Department (C). Display/hide their locations on the map
Size of family households: 507 2-persons, 275 3-persons, 72 4-persons, 53 5-persons, 23 6-persons
Size of nonfamily households: 573 1-person, 53 2-persons
351 married couples with children.
14 single-parent households (14 men).
88.3% of residents of 07750 zip code speak English at home.
4.0% of residents speak Spanish at home (87% very well, 6% well, 6% not well).
3.7% of residents speak other Indo-European language at home (100% very well).
4.0% of residents speak Asian or Pacific Island language at home (100% very well).
0.5% of residents speak other language at home (100% very well).
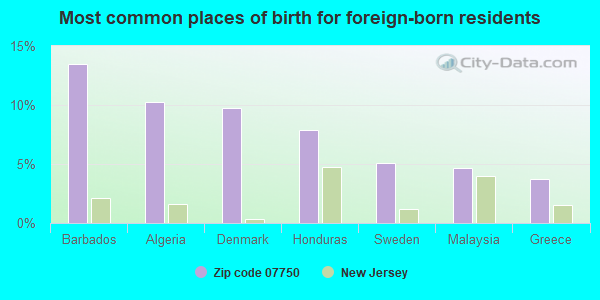
Foreign born population: 216 (6.7%) (83.6% of them are naturalized citizens)
This zip code:
6.7%
Whole state:
23.5%
13%Barbados
10%Algeria
10%Denmark
8%Honduras
5%Sweden
5%Malaysia
4%Greece
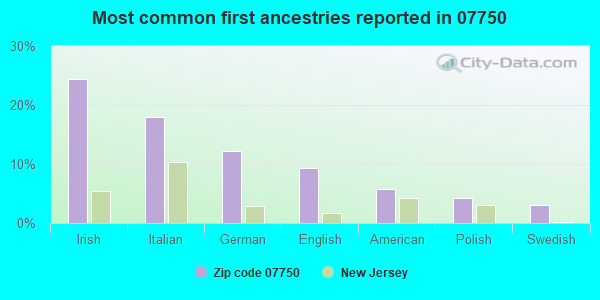
24%Irish
18%Italian
12%German
9%English
6%American
4%Polish
3%Swedish
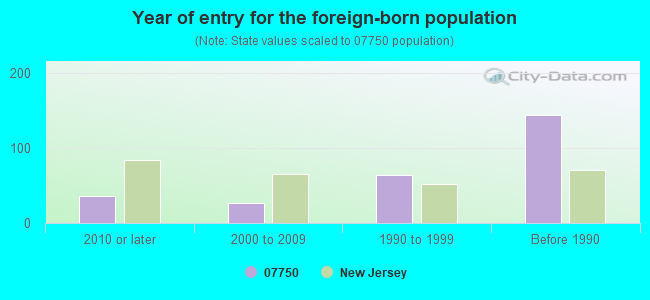
Year of entry for the foreign-born population
362010 or later
272000 to 2009
641990 to 1999
144Before 1990
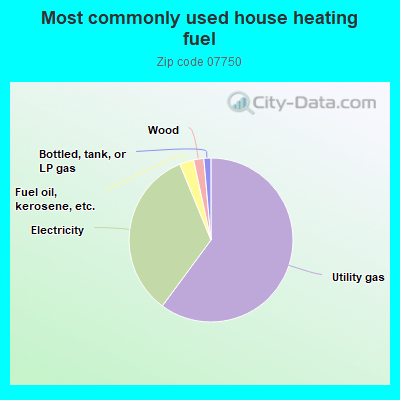
60.3%Utility gas
33.8%Electricity
2.8%Fuel oil, kerosene, etc.
2.0%Wood
1.4%Bottled, tank, or LP gas
Population in 1990: 3,329. Population change in the 1990s: +266 (+8.0%).
Place of birth for U.S.-born residents:
This state: 1,673
Northeast: 1,020
Midwest: 125
South: 79
West: 25
61% of the 07750 zip code residents lived in the same house 5 years ago. Out of people who lived in different houses, 65% lived in this county. Out of people who lived in different counties, 50% lived in New Jersey.
88% of the 07750 zip code residents lived in the same house 1 year ago. Out of people who lived in different houses, 47% moved from this county. Out of people who lived in different houses, 22% moved from different county within same state. Out of people who lived in different houses, 26% moved from different state. Out of people who lived in different houses, 3% moved from abroad.
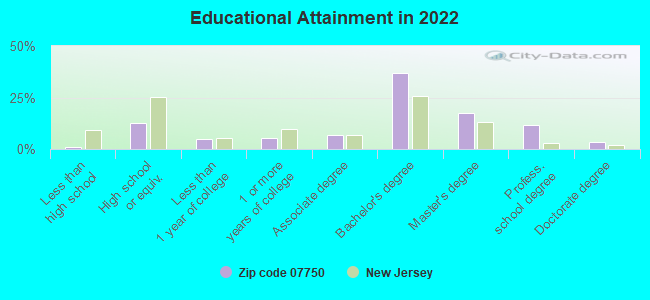
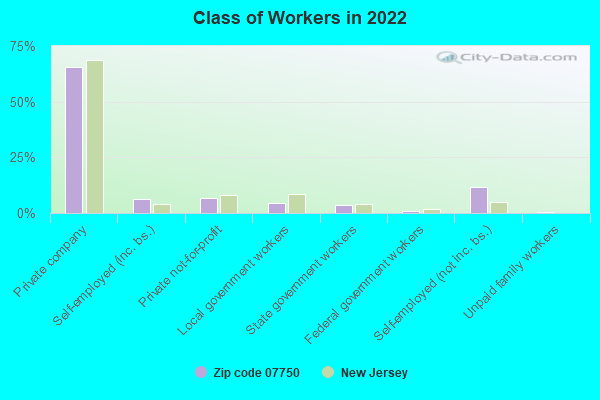
Private vs. public school enrollment:
Students in private schools in grades 1 to 8 (elementary and middle school): 96
Here:
54.9%
New Jersey:
12.3%
Students in private schools in grades 9 to 12 (high school): 17
Here:
16.5%
New Jersey:
13.1%
Students in private undergraduate colleges: 17
Here:
16.7%
New Jersey:
33.2%
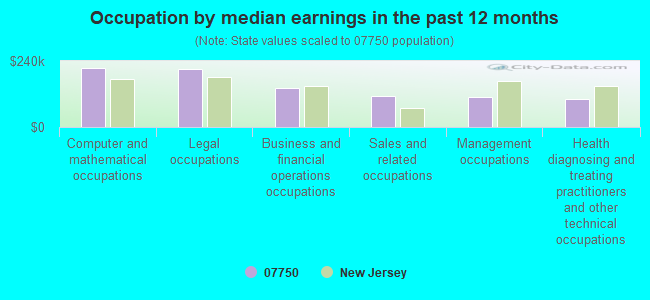
Occupation by median earnings in the past 12 months ($)
215,535Computer and mathematical occupations
209,477Legal occupations
143,144Business and financial operations occupations
112,371Sales and related occupations
108,246Management occupations
101,330Health diagnosing and treating practitioners and other technical occupations
Companies with federal contracts located in this zip code:
TWO RIVERS WATER RECLAMATION A (1 HIGHLAND AVE in MONMOUTH BEACH, NJ) : $993,598 in 12 contractsfrom 1999 to 2001
Contracts for Other Utilities by Army Signed by year:2000: $519,965; 2001: $421,941; 2002: $0; 2003: $0; 2004: $0; 2005: $0; 2006: $0.
Biggest contracts:
$168,777 with Army for Other Utilities. Signed on 2001-03-20. Completion date: 2001-03-31.
$129,991, same as above.Signed on 2000-06-16. Completion date: 2000-08-18.
$129,991, same as above.Signed on 2000-08-21. Completion date: 2000-09-30.
$129,991, same as above.Signed on 2000-04-18. Completion date: 2000-09-30.
ALFONSE M ARMINIO (172 WHARFSIDE in MONMOUTH BEACH, NJ; small business) : $39,101 in 11 contractsfrom 2001 to 2004
Contracts for Chaplain Services, Gas Services by Army Signed by year:2000: $0; 2001: $12,124; 2002: $12,124; 2003: $12,142; 2004: $2,711; 2005: $0; 2006: $0.
Biggest contracts:
$12,142 with Army for Chaplain Services. Signed on 2004-10-20. Completion date: 2004-10-31.
$12,142, same as above.Signed on 2003-10-14. Completion date: 2004-09-30.
$12,124 with Army for Gas Services. Signed on 2001-10-15. Completion date: 2002-09-30.
$11,124, same as above.Signed on 2002-11-14. Completion date: 2003-09-30.
Top industries in this zip code by the number of employees in 2005:
Other Services (except Public Administration): Other Similar Organizations (except Business, Professional, Labor, and Political Organizations) (10-19: 2, 1-4: 1)
Administrative and Support and Waste Management and Remediation Services: Janitorial Services (10-19: 1, 1-4: 1)
Other Services (except Public Administration): Other Personal and Household Goods Repair and Maintenance (10-19: 1)
Arts, Entertainment, and Recreation: Marinas (5-9: 1, 1-4: 3)
Construction: New Single-Family Housing Construction (except Operative Builders) (5-9: 1, 1-4: 1)
Information: Cellular and Other Wireless Telecommunications (5-9: 1, 1-4: 1)
Other Services (except Public Administration): Religious Organizations (5-9: 1)
Professional, Scientific, and Technical Services: Architectural Services (5-9: 1)
Home Mortgage Disclosure Act Aggregated Statistics For Year 2009 (Based on 2 partial tracts)
A) FHA, FSA/RHS & VA Home Purchase Loans
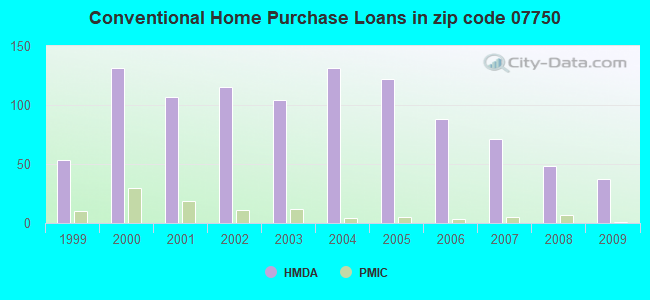
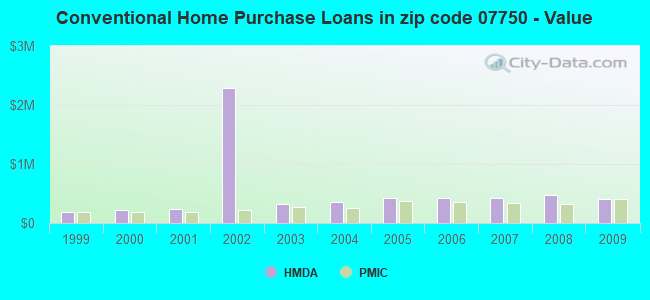
B) Conventional Home Purchase Loans
C) Refinancings
D) Home Improvement Loans
F) Non-occupant Loans on < 5 Family Dwellings (A B C & D)
Number
Average Value
Number
Average Value
Number
Average Value
Number
Average Value
Number
Average Value
LOANS ORIGINATED
4
$349,240
37
$409,603
174
$361,227
8
$382,359
51
$324,254
APPLICATIONS APPROVED, NOT ACCEPTED
0
$0
5
$602,358
15
$400,478
0
$0
5
$461,568
APPLICATIONS DENIED
0
$0
9
$423,809
58
$452,719
3
$261,657
16
$279,995
APPLICATIONS WITHDRAWN
0
$0
5
$379,896
35
$358,125
1
$109,480
5
$297,786
FILES CLOSED FOR INCOMPLETENESS
0
$0
0
$0
12
$346,778
1
$164,220
3
$274,063
Aggregated Statistics For Year 2008 (Based on 2 partial tracts)
A) FHA, FSA/RHS & VA Home Purchase Loans
B) Conventional Home Purchase Loans
C) Refinancings
D) Home Improvement Loans
F) Non-occupant Loans on < 5 Family Dwellings (A B C & D)
Number
Average Value
Number
Average Value
Number
Average Value
Number
Average Value
Number
Average Value
LOANS ORIGINATED
4
$653,322
48
$481,073
80
$398,274
10
$441,095
33
$333,549
APPLICATIONS APPROVED, NOT ACCEPTED
0
$0
8
$407,676
11
$245,036
2
$122,620
3
$508,353
APPLICATIONS DENIED
0
$0
7
$471,077
32
$435,902
9
$191,590
10
$499,448
APPLICATIONS WITHDRAWN
2
$608,710
7
$515,651
18
$382,633
2
$1,018,165
4
$331,178
FILES CLOSED FOR INCOMPLETENESS
0
$0
1
$454,340
2
$414,930
0
$0
0
$0
Aggregated Statistics For Year 2007 (Based on 2 partial tracts)
A) FHA, FSA/RHS & VA Home Purchase Loans
B) Conventional Home Purchase Loans
C) Refinancings
D) Home Improvement Loans
F) Non-occupant Loans on < 5 Family Dwellings (A B C & D)
Number
Average Value
Number
Average Value
Number
Average Value
Number
Average Value
Number
Average Value
LOANS ORIGINATED
3
$356,903
71
$430,765
94
$536,720
16
$124,808
42
$430,361
APPLICATIONS APPROVED, NOT ACCEPTED
0
$0
10
$302,165
22
$274,247
5
$286,400
5
$316,616
APPLICATIONS DENIED
0
$0
8
$362,652
36
$814,683
7
$22,679
10
$619,657
APPLICATIONS WITHDRAWN
1
$238,670
4
$498,135
18
$574,101
2
$257,280
3
$519,300
FILES CLOSED FOR INCOMPLETENESS
0
$0
2
$538,095
4
$454,342
0
$0
0
$0
Aggregated Statistics For Year 2006 (Based on 2 partial tracts)
A) FHA, FSA/RHS & VA Home Purchase Loans
B) Conventional Home Purchase Loans
C) Refinancings
D) Home Improvement Loans
F) Non-occupant Loans on < 5 Family Dwellings (A B C & D)
Number
Average Value
Number
Average Value
Number
Average Value
Number
Average Value
Number
Average Value
LOANS ORIGINATED
1
$255,090
88
$421,971
126
$419,413
31
$82,498
57
$352,602
APPLICATIONS APPROVED, NOT ACCEPTED
0
$0
7
$381,147
24
$384,229
8
$120,428
4
$261,658
APPLICATIONS DENIED
0
$0
10
$388,873
42
$688,238
4
$169,420
15
$508,060
APPLICATIONS WITHDRAWN
0
$0
11
$436,626
34
$521,221
0
$0
7
$515,964
FILES CLOSED FOR INCOMPLETENESS
0
$0
2
$236,475
8
$365,390
1
$164,220
2
$578,600
Aggregated Statistics For Year 2005 (Based on 2 partial tracts)
B) Conventional Home Purchase Loans
C) Refinancings
D) Home Improvement Loans
F) Non-occupant Loans on < 5 Family Dwellings (A B C & D)
Number
Average Value
Number
Average Value
Number
Average Value
Number
Average Value
LOANS ORIGINATED
122
$421,426
159
$368,844
12
$391,300
66
$373,393
APPLICATIONS APPROVED, NOT ACCEPTED
18
$438,346
27
$381,477
4
$79,100
8
$341,578
APPLICATIONS DENIED
18
$565,221
21
$414,304
1
$525,500
7
$537,703
APPLICATIONS WITHDRAWN
18
$569,661
33
$421,398
4
$187,210
4
$876,660
FILES CLOSED FOR INCOMPLETENESS
4
$379,895
3
$245,237
0
$0
1
$191,590
Aggregated Statistics For Year 2004 (Based on 2 partial tracts)
A) FHA, FSA/RHS & VA Home Purchase Loans
B) Conventional Home Purchase Loans
C) Refinancings
D) Home Improvement Loans
F) Non-occupant Loans on < 5 Family Dwellings (A B C & D)
Number
Average Value
Number
Average Value
Number
Average Value
Number
Average Value
Number
Average Value
LOANS ORIGINATED
1
$261,660
131
$354,782
139
$317,019
18
$65,019
62
$306,579
APPLICATIONS APPROVED, NOT ACCEPTED
0
$0
26
$385,075
19
$384,793
3
$253,630
15
$408,287
APPLICATIONS DENIED
0
$0
19
$411,703
43
$265,476
9
$132,592
9
$396,561
APPLICATIONS WITHDRAWN
0
$0
21
$388,237
27
$259,549
1
$504,700
11
$409,455
FILES CLOSED FOR INCOMPLETENESS
0
$0
5
$544,992
1
$225,530
0
$0
3
$612,723
Aggregated Statistics For Year 2003 (Based on 2 partial tracts)
B) Conventional Home Purchase Loans
C) Refinancings
D) Home Improvement Loans
F) Non-occupant Loans on < 5 Family Dwellings (A B C & D)
Number
Average Value
Number
Average Value
Number
Average Value
Number
Average Value
LOANS ORIGINATED
104
$322,366
420
$247,597
14
$87,115
76
$250,479
APPLICATIONS APPROVED, NOT ACCEPTED
9
$345,227
49
$319,994
4
$49,812
7
$301,383
APPLICATIONS DENIED
13
$366,842
59
$208,179
8
$61,992
12
$173,070
APPLICATIONS WITHDRAWN
5
$455,656
54
$260,015
1
$16,420
1
$229,910
FILES CLOSED FOR INCOMPLETENESS
3
$572,217
11
$188,704
1
$109,480
3
$349,240
Aggregated Statistics For Year 2002 (Based on 2 partial tracts)
A) FHA, FSA/RHS & VA Home Purchase Loans
B) Conventional Home Purchase Loans
C) Refinancings
D) Home Improvement Loans
F) Non-occupant Loans on < 5 Family Dwellings (A B C & D)
Number
Average Value
Number
Average Value
Number
Average Value
Number
Average Value
Number
Average Value
LOANS ORIGINATED
1
$134,660
115
$2,296,595
293
$308,622
25
$59,995
54
$1,602,544
APPLICATIONS APPROVED, NOT ACCEPTED
0
$0
21
$449,806
35
$228,782
8
$42,286
3
$366,027
APPLICATIONS DENIED
0
$0
5
$365,882
46
$197,112
8
$30,518
9
$170,667
APPLICATIONS WITHDRAWN
0
$0
8
$3,985,072
38
$187,038
4
$36,950
4
$156,010
FILES CLOSED FOR INCOMPLETENESS
0
$0
3
$497,040
8
$302,712
0
$0
1
$24,090
Aggregated Statistics For Year 2001 (Based on 2 partial tracts)
A) FHA, FSA/RHS & VA Home Purchase Loans
B) Conventional Home Purchase Loans
C) Refinancings
D) Home Improvement Loans
F) Non-occupant Loans on < 5 Family Dwellings (A B C & D)
Number
Average Value
Number
Average Value
Number
Average Value
Number
Average Value
Number
Average Value
LOANS ORIGINATED
3
$150,353
107
$232,517
170
$212,146
19
$79,286
23
$183,307
APPLICATIONS APPROVED, NOT ACCEPTED
0
$0
10
$129,953
26
$251,341
3
$102,547
3
$124,077
APPLICATIONS DENIED
0
$0
3
$185,387
26
$160,852
14
$81,171
3
$118,967
APPLICATIONS WITHDRAWN
0
$0
8
$217,865
26
$264,268
4
$30,655
3
$200,350
FILES CLOSED FOR INCOMPLETENESS
0
$0
3
$227,353
10
$194,655
0
$0
0
$0
Aggregated Statistics For Year 2000 (Based on 2 partial tracts)
A) FHA, FSA/RHS & VA Home Purchase Loans
B) Conventional Home Purchase Loans
C) Refinancings
D) Home Improvement Loans
E) Loans on Dwellings For 5+ Families
F) Non-occupant Loans on < 5 Family Dwellings (A B C & D)
Number
Average Value
Number
Average Value
Number
Average Value
Number
Average Value
Number
Average Value
Number
Average Value
LOANS ORIGINATED
1
$147,800
131
$217,999
46
$199,944
13
$73,015
1
$459,820
21
$183,510
APPLICATIONS APPROVED, NOT ACCEPTED
1
$144,510
18
$246,634
7
$103,693
7
$54,740
0
$0
1
$169,690
APPLICATIONS DENIED
0
$0
9
$408,969
24
$188,853
11
$32,247
0
$0
1
$157,650
APPLICATIONS WITHDRAWN
0
$0
10
$249,833
11
$123,215
0
$0
0
$0
3
$251,803
FILES CLOSED FOR INCOMPLETENESS
0
$0
3
$207,647
7
$200,191
3
$34,303
0
$0
1
$218,960
Aggregated Statistics For Year 1999 (Based on 1 partial tract)
A) FHA, FSA/RHS & VA Home Purchase Loans
B) Conventional Home Purchase Loans
C) Refinancings
D) Home Improvement Loans
F) Non-occupant Loans on < 5 Family Dwellings (A B C & D)
Detailed PMIC statistics for the following Tracts:8041.00
2002 - 2018 National Fire Incident Reporting System (NFIRS) incidents
Based on the data from the years 2002 - 2018 the average number of fires per year is 20. The highest number of fires - 41 took place in 2011, and the least - 0 in 2003. The data has an increasing trend.
When looking into fire subcategories, the most reports belonged to: Structure Fires (70.1%), and Outside Fires (20.6%).
Fire incident types reported to NFIRS in Zip Code 07750


 Nearest zip codes: 07757, 07760, 07740, 07739, 07703, 07764.


 : $993,598 in 12 contracts from 1999 to 2001

 Based on the data from the years 2002 - 2018 the average number of fires per year is 20. The highest number of fires - 41 took place in 2011, and the least - 0 in 2003. The data has an increasing trend.
 When looking into fire subcategories, the most reports belonged to: Structure Fires (70.1%), and Outside Fires (20.6%).