Estimated zip code population in 2022: 14,869 Zip code population in 2010: 13,538 Zip code population in 2000: 12,153
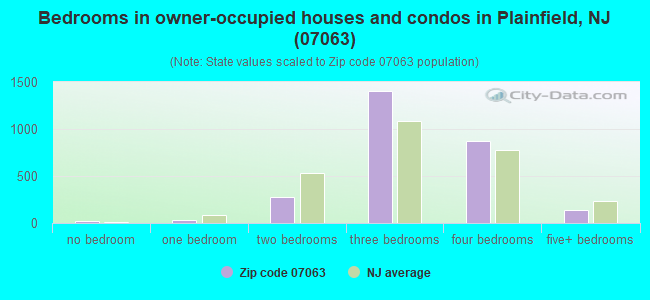
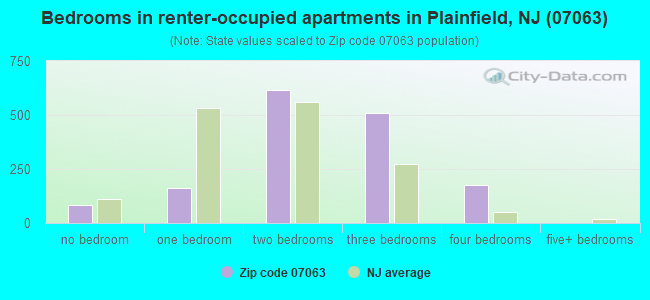
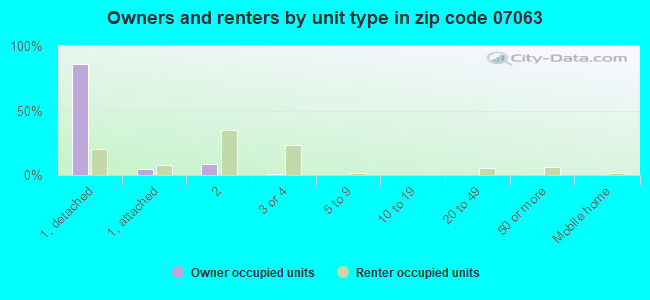
Houses and condos: 4,362 Renter-occupied apartments: 1,584
% of renters here:
37%
State:
35%
March 2022 cost of living index in zip code 07063: 113.6 (more than average, U.S. average is 100)
Land area: 1.8 sq. mi. Water area: 0.0 sq. mi.
Population density: 8,166 people per square mile
(high).
OSM Map
Google Map
MSN Map
OSM Map
General Map
Google Map
MSN Map
OSM Map
Google Map
MSN Map
OSM Map
Google Map
MSN Map
Please wait while loading the map...
Real estate property taxes paid for housing units in 2022:
This zip code:
2.3% ($8,638)
New Jersey:
2.1% ($8,897)
Median real estate property taxes paid for housing units with mortgages in 2022: $8,589 (2.3%) Median real estate property taxes paid for housing units with no mortgage in 2022: $8,884 (2.6%)
Estimated median house/condo value in 2022: $369,277
07063:
$369,277
New Jersey:
$428,900
According to our research of New Jersey and other state lists, there were 3 registered sex offenders living in 07063 zip code as of July 02, 2024. The ratio of all residents to sex offenders in zip code 07063 is 4,692 to 1. The ratio of registered sex offenders to all residents in this zip code is much lower than the state average.
Median resident age:
This zip code:
33.1 years
New Jersey median age:
40.4 years
Average household size:
This zip code:
3.3 people
New Jersey:
2.6 people
Averages for the 2020 tax year for zip code 07063, filed in 2021:
Average Adjusted Gross Income (AGI) in 2020: $47,443 (Individual Income Tax Returns)
Here:
$47,443
State:
$95,247
Salary/wage: $45,483 (reported on 85.4% of returns)
Here:
$45,483
State:
$80,635
(% of AGI for various income ranges: 1364.8% for AGIs below $25k, 3885.5% for AGIs $25k-50k, 6670.6% for AGIs $50k-75k, 10133.0% for AGIs $75k-100k, 18383.9% for AGIs $100k-200k, 56455.0% for AGIs over 200k)
Taxable interest for individuals: $704 (reported on 12.4% of returns)
This zip code:
$704
New Jersey:
$2,414
(% of AGI for various income ranges: 4.8% for AGIs below $25k, 5.3% for AGIs $25k-50k, 7.2% for AGIs $50k-75k, 24.7% for AGIs $75k-100k, 66.3% for AGIs $100k-200k, 77.5% for AGIs over 200k)
Ordinary dividends: $3,169 (reported on 7.1% of returns)
Here:
$3,169
State:
$8,057
(% of AGI for various income ranges: 5.8% for AGIs below $25k, 8.3% for AGIs $25k-50k, 14.6% for AGIs $50k-75k, 65.1% for AGIs $75k-100k, 196.1% for AGIs $100k-200k, 510.0% for AGIs over 200k)
Net capital gain/loss in AGI: +$3,740 (reported on 5.9% of returns)
Here:
+$3,740
State:
+$25,022
(% of AGI for various income ranges: 1.5% for AGIs below $25k, 4.1% for AGIs $25k-50k, 14.4% for AGIs $50k-75k, 64.7% for AGIs $75k-100k, 213.7% for AGIs $100k-200k, 612.5% for AGIs over 200k)
Profit/loss from business: +$6,951 (reported on 16.6% of returns)
Here:
+$6,951
State:
+$18,035
(% of AGI for various income ranges: 223.6% for AGIs below $25k, 123.4% for AGIs $25k-50k, 102.3% for AGIs $50k-75k, 127.2% for AGIs $75k-100k, 219.8% for AGIs $100k-200k)
Taxable individual retirement arrangement distribution: $15,464 (reported on 3.4% of returns)
07063:
$15,464
New Jersey:
$21,558
(% of AGI for various income ranges: 11.5% for AGIs below $25k, 32.7% for AGIs $25k-50k, 68.1% for AGIs $50k-75k, 136.5% for AGIs $75k-100k, 484.6% for AGIs $100k-200k)
Total itemized deductions: $25,979 (reported on 10.5% of returns)
Here:
$25,979
State:
$32,863
(% of AGI for various income ranges: 47.4% for AGIs below $25k, 207.9% for AGIs $25k-50k, 522.2% for AGIs $50k-75k, 1029.5% for AGIs $75k-100k, 1364.9% for AGIs $100k-200k, 3872.5% for AGIs over 200k)
Charity contributions: $5,538 (reported on 8.2% of returns)
Here:
$5,538
State:
$7,880
(% of AGI for various income ranges: 2.4% for AGIs below $25k, 29.8% for AGIs $25k-50k, 76.5% for AGIs $50k-75k, 140.7% for AGIs $75k-100k, 248.8% for AGIs $100k-200k, 1392.5% for AGIs over 200k)
Taxes paid: $9,622 (reported on 10.5% of returns)
07063:
$9,622
State:
$9,183
(% of AGI for various income ranges: 20.3% for AGIs below $25k, 74.9% for AGIs $25k-50k, 205.9% for AGIs $50k-75k, 410.7% for AGIs $75k-100k, 480.7% for AGIs $100k-200k, 1092.5% for AGIs over 200k)
Earned income credit: $2,360 (reported on 19.3% of returns)
Here:
$2,360
State:
$2,148
(% of AGI for various income ranges: 112.2% for AGIs below $25k, 75.8% for AGIs $25k-50k)
Percentage of individuals using paid preparers for their 2020 taxes: 89.1%
Here:
89%
State:
92%
(% for various income ranges: 84.4% for AGIs below $25k, 91.7% for AGIs $25k-50k, 92.0% for AGIs $50k-75k, 91.8% for AGIs $75k-100k, 92.9% for AGIs $100k-200k, 88.9% for AGIs over 200k)
Averages for the 2012 tax year for zip code 07063, filed in 2013:
Average Adjusted Gross Income (AGI) in 2012: $40,863 (Individual Income Tax Returns)
Here:
$40,863
State:
$79,688
Salary/wage: $39,204 (reported on 88.8% of returns)
Here:
$39,204
State:
$68,122
(% of AGI for various income ranges: 81.0% for AGIs below $25k, 88.2% for AGIs $25k-50k, 86.1% for AGIs $50k-75k, 82.5% for AGIs $75k-100k, 87.7% for AGIs $100k-200k, 74.0% for AGIs over 200k)
Taxable interest for individuals: $706 (reported on 16.2% of returns)
This zip code:
$706
New Jersey:
$2,193
(% of AGI for various income ranges: 0.3% for AGIs below $25k, 0.2% for AGIs $25k-50k, 0.3% for AGIs $50k-75k, 0.4% for AGIs $75k-100k, 0.2% for AGIs $100k-200k, 0.7% for AGIs over 200k)
Ordinary dividends: $2,122 (reported on 9.1% of returns)
Here:
$2,122
State:
$6,828
(% of AGI for various income ranges: 0.5% for AGIs below $25k, 0.1% for AGIs $25k-50k, 0.3% for AGIs $50k-75k, 1.0% for AGIs $75k-100k, 0.6% for AGIs $100k-200k, 0.5% for AGIs over 200k)
Net capital gain/loss in AGI: +$152 (reported on 5.2% of returns)
Here:
+$152
State:
+$15,358
(% of AGI for various income ranges: 0.2% for AGIs $100k-200k)
Profit/loss from business: +$6,583 (reported on 11.3% of returns)
Here:
+$6,583
State:
+$19,577
(% of AGI for various income ranges: 5.7% for AGIs below $25k, 1.4% for AGIs $25k-50k, 1.4% for AGIs $50k-75k, 1.0% for AGIs $75k-100k, 1.1% for AGIs $100k-200k)
Taxable individual retirement arrangement distribution: $11,635 (reported on 4.1% of returns)
07063:
$11,635
New Jersey:
$18,214
(% of AGI for various income ranges: 0.7% for AGIs below $25k, 0.9% for AGIs $25k-50k, 1.2% for AGIs $50k-75k, 1.9% for AGIs $75k-100k, 1.4% for AGIs $100k-200k)
Total itemized deductions: $21,408 (28% of AGI, reported on 31.6% of returns)
Here:
$21,408
State:
$30,827
Here:
28.2% of AGI
State:
21.2% of AGI
(% of AGI for various income ranges: 9.1% for AGIs below $25k, 11.9% for AGIs $25k-50k, 19.4% for AGIs $50k-75k, 22.0% for AGIs $75k-100k, 20.1% for AGIs $100k-200k, 15.4% for AGIs over 200k)
Charity contributions: $2,819 (reported on 25.2% of returns)
Here:
$2,819
State:
$3,451
(% of AGI for various income ranges: 0.7% for AGIs below $25k, 1.3% for AGIs $25k-50k, 1.9% for AGIs $50k-75k, 2.4% for AGIs $75k-100k, 2.3% for AGIs $100k-200k, 1.4% for AGIs over 200k)
Taxes paid: $9,258 (reported on 31.4% of returns)
07063:
$9,258
State:
$15,801
(% of AGI for various income ranges: 3.5% for AGIs below $25k, 4.4% for AGIs $25k-50k, 8.1% for AGIs $50k-75k, 9.6% for AGIs $75k-100k, 9.5% for AGIs $100k-200k, 8.4% for AGIs over 200k)
Earned income credit: $2,283 (reported on 22.8% of returns)
Here:
$2,283
State:
$2,182
(% of AGI for various income ranges: 6.7% for AGIs below $25k, 1.3% for AGIs $25k-50k)
Percentage of individuals using paid preparers for their 2012 taxes: 71.2%
Here:
71%
State:
65%
(% for various income ranges: 72.0% for AGIs below $25k, 74.3% for AGIs $25k-50k, 68.8% for AGIs $50k-75k, 68.2% for AGIs $75k-100k, 62.0% for AGIs $100k-200k, 75.0% for AGIs over 200k)
Averages for the 2004 tax year for zip code 07063, filed in 2005:
Average Adjusted Gross Income (AGI) in 2004: $37,775 (Individual Income Tax Returns)
Here:
$37,775
State:
$64,921
Salary/wage: $36,547 (reported on 90.6% of returns)
Here:
$36,547
State:
$57,755
(% of AGI for various income ranges: 88.2% for AGIs below $10k, 84.4% for AGIs $10k-25k, 90.9% for AGIs $25k-50k, 87.5% for AGIs $50k-75k, 87.8% for AGIs $75k-100k, 85.3% for AGIs over 100k)
Taxable interest for individuals: $882 (reported on 30.3% of returns)
This zip code:
$882
New Jersey:
$2,068
(% of AGI for various income ranges: 1.9% for AGIs below $10k, 1.2% for AGIs $10k-25k, 0.5% for AGIs $25k-50k, 0.5% for AGIs $50k-75k, 1.0% for AGIs $75k-100k, 0.5% for AGIs over 100k)
Taxable dividends: $1,669 (reported on 14.0% of returns)
Here:
$1,669
State:
$3,959
(% of AGI for various income ranges: 1.4% for AGIs below $10k, 0.6% for AGIs $10k-25k, 0.3% for AGIs $25k-50k, 0.8% for AGIs $50k-75k, 0.6% for AGIs $75k-100k, 0.8% for AGIs over 100k)
Net capital gain/loss: +$2,751 (reported on 8.9% of returns)
Here:
+$2,751
State:
+$13,591
(% of AGI for various income ranges: -1.0% for AGIs below $10k, 0.1% for AGIs $10k-25k, 0.3% for AGIs $25k-50k, 0.1% for AGIs $50k-75k, 0.1% for AGIs $75k-100k, 2.5% for AGIs over 100k)
Profit/loss from business: +$6,637 (reported on 9.1% of returns)
Here:
+$6,637
State:
+$17,520
(% of AGI for various income ranges: 6.8% for AGIs below $10k, 4.0% for AGIs $10k-25k, 0.8% for AGIs $25k-50k, 0.9% for AGIs $50k-75k, 1.2% for AGIs $75k-100k, 1.5% for AGIs over 100k)
IRA payment deduction: $2,286 (reported on 1.1% of returns)
07063:
$2,286
New Jersey:
$3,270
Total itemized deductions: $18,688 (30% of AGI, reported on 38.8% of returns)
Here:
$18,688
State:
$23,924
Here:
29.8% of AGI
State:
21.1% of AGI
(% of AGI for various income ranges: 12.5% for AGIs below $10k, 12.7% for AGIs $10k-25k, 17.0% for AGIs $25k-50k, 24.0% for AGIs $50k-75k, 23.6% for AGIs $75k-100k, 18.8% for AGIs over 100k)
Charity contributions deductions: $2,738 (4% of AGI, reported on 33.7% of returns)
Here:
$2,738
State:
$3,242
Here:
4.2% of AGI
State:
2.7% of AGI
(% of AGI for various income ranges: 1.0% for AGIs below $10k, 1.2% for AGIs $10k-25k, 2.1% for AGIs $25k-50k, 3.4% for AGIs $50k-75k, 3.0% for AGIs $75k-100k, 2.6% for AGIs over 100k)
Total tax: $4,619 (reported on 67.0% of returns)
07063:
$4,619
State:
$12,321
(% of AGI for various income ranges: 2.3% for AGIs below $10k, 3.0% for AGIs $10k-25k, 5.4% for AGIs $25k-50k, 8.3% for AGIs $50k-75k, 9.7% for AGIs $75k-100k, 14.2% for AGIs over 100k)
Earned income credit: $1,782 (reported on 22.2% of returns)
Here:
$1,782
State:
$1,711
Percentage of individuals using paid preparers for their 2004 taxes: 70.2%
Here:
70%
State:
65%
(% for various income ranges: 62.1% for AGIs below $10k, 74.2% for AGIs $10k-25k, 72.6% for AGIs $25k-50k, 70.0% for AGIs $50k-75k, 68.7% for AGIs $75k-100k, 66.9% for AGIs over 100k)
Likely homosexual households (counted as self-reported same-sex unmarried-partner households)
Lesbian couples: 0.2% of all households
Gay men: 0.0% of all households
Household received Food Stamps/SNAP in the past 12 months: 572 Household did not receive Food Stamps/SNAP in the past 12 months: 3,781
Women who had a birth in the past 12 months: 233 (130 now married, 101 unmarried) Women who did not have a birth in the past 12 months: 2,931 (943 now married, 1,994 unmarried)
Housing units in zip code 07063 with a mortgage: 2,085 (115 second mortgage, 110 both second mortgage and home equity loan) Houses without a mortgage: 8
Median monthly owner costs for units with a mortgage: $2,363 Median monthly owner costs for units without a mortgage: $1,159
Residents with income below the poverty level in 2022:
This zip code:
16.3%
Whole state:
9.7%
Residents with income below 50% of the poverty level in 2022:
This zip code:
10.2%
Whole state:
5.2%
Median number of rooms in houses and condos:
Here:
6.7
State:
6.8
Median number of rooms in apartments:
Here:
4.3
State:
3.9
Notable locations in this zip code not listed on our city pages
Churches in zip code 07063 include: Church of Jesus Christ of Latter Day Saints (A), Greater Refuge Church of Christ (B), Kingdom Hall Jehovahs Witnesses (C), Metropolitian Seventh Day Adventist Church (D), Calvary Baptist Church (E), Calvary Full Gospel Church (F), God's Assembly In Christ Church (G). Display/hide their locations on the map
1,838 married couples with children.
1,401 single-parent households (587 men, 814 women).
50.3% of residents of 07063 zip code speak English at home.
46.6% of residents speak Spanish at home (31% very well, 16% well, 22% not well, 30% not at all).
2.9% of residents speak other Indo-European language at home (58% very well, 11% well, 26% not well, 5% not at all).
0.5% of residents speak Asian or Pacific Island language at home (61% very well, 25% not well, 14% not at all).
1.6% of residents speak other language at home (42% very well, 51% well, 7% not well).
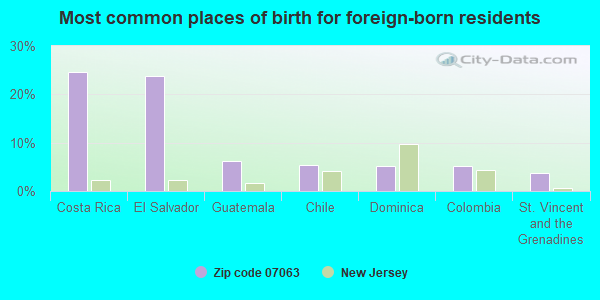
Foreign born population: 5,195 (34.9%) (30.8% of them are naturalized citizens)
This zip code:
34.9%
Whole state:
23.5%
25%Costa Rica
24%El Salvador
6%Guatemala
5%Chile
5%Dominica
5%Colombia
4%St. Vincent and the Grenadines
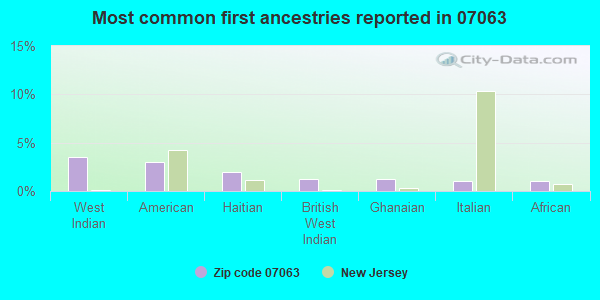
3%West Indian
3%American
2%Haitian
1%British West Indian
1%Ghanaian
1%Italian
1%African
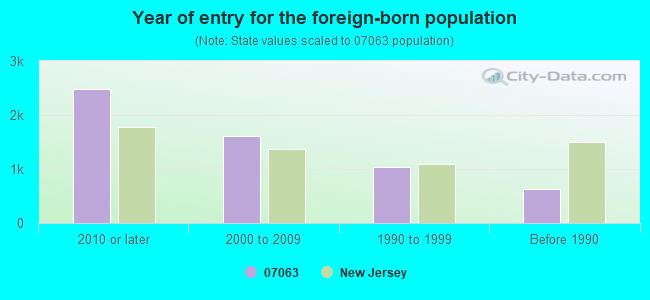
Year of entry for the foreign-born population
2,4732010 or later
1,6132000 to 2009
1,0361990 to 1999
638Before 1990
Facilities with environmental interests located in this zip code:
PLAINFIELD METAL RECYCLING (1300 SOUTH SECOND STREET in PLAINFIELD, NJ)
STATE MASTER (New Jersey environmental info) - NJEMS-00000004577, EPCRA, NJEMS-010115, STATE CLEANUP SITE, NJEMS-200295, REFUSE DISPOSAL, NJEMS-48938, National Pollutant Discharge Elimination System Permit, NJEMS-H4023, AIR PROGRAM National Pollutant Discharge Elimination System NON-MAJOR (Tracking pollutant discharge elimination systems) - permit (Resource Conservation and Recovery Act (tracking hazardous waste)) Business SIC classification: SCRAP AND WASTE MATERIALS; GASOLINE SERVICE STATIONS Organizations: PLAINFIELD IRON & METAL CO INC, PLAINFIELD IRON & METAL CORP, SECOND STREET METALS, PLAINFIELD METAL RECYCLING LLC (CONTACT/OPERATOR)
, 1300 S SECOND ST ASSOC LP (CONTACT/OWNER)
, 1300 S SECOND ST ASSOC C/O RICHARD GOLDBERG (CONTACT/OWNER)
Alternative names: HNSE SECOND STREET METALS, PLAINFIELD IRON&METAL CO INC, SECOND STREET METALS
ARGYLL ENVIRONMENTAL SERVICES (1630 SOUTH 2ND STREET in PLAINFIELD, NJ)
STATE MASTER (New Jersey environmental info) - NJEMS-200475, REFUSE DISPOSAL, NJEMS-NJR000039487, TRANSPORTER (Resource Conservation and Recovery Act (tracking hazardous waste)) Organizations: ARGYLL ENV SVS INC, AA DIMUZIO CONSTRUCTION INC Alternative names: LOIZEAUX-BREWER FUEL CO
1 HOUR MARTINIZING (621 CLINTON AVE in PLAINFIELD, NJ)
STATE MASTER (New Jersey environmental info) - NJEMS-00000028548, EPCRA, NJEMS-003955, STATE CLEANUP SITE, NJEMS-77434600000, EPCRA, NJEMS-L4034, AIR PROGRAM (Resource Conservation and Recovery Act (tracking hazardous waste)) Business SIC classification: DRYCLEANING PLANTS, EXCEPT RUG CLEANING Organizations: ONE HOUR MARTINIZING, FINK ALBERT (CONTACT/OWNER)
NJ AUTO ART BODY SHOP (1860 W FRONT ST in PLAINFIELD, NJ)
STATE MASTER (New Jersey environmental info) - NJEMS-024586, STATE CLEANUP SITE, NJEMS-72223700000, EPCRA, NJEMS-G4117, AIR PROGRAM (Resource Conservation and Recovery Act (tracking hazardous waste)) Business SIC classification: MANUFACTURING INDUSTRIES; TOP, BODY, AND UPHOLSTERY REPAIR SHOPS AND PAINT SHOPS Organizations: NJ ART INC, MILLER LINDA (CONTACT/OWNER)
Alternative names: NEW JERSEY AUTO ART
NJ HARDWOOD INC (1340 W FRONT ST in PLAINFIELD, NJ)
AIR MINOR (AIRS/AFS) STATE MASTER (New Jersey environmental info) - NJEMS-40521, AIR PROGRAM Business SIC classification: WOOD PRODUCTS
PROFESSIONAL DRY CLEANERS OF PLAINFIELD (1204 W FRONT ST in PLAINFIELD, NJ)
STATE MASTER (New Jersey environmental info) - NJEMS-00000000388, EPCRA, NJEMS-L9092, AIR PROGRAM (Resource Conservation and Recovery Act (tracking hazardous waste)) Business SIC classification: DRYCLEANING PLANTS, EXCEPT RUG CLEANING
FENDER MENDERS INC (1205 W FRONT ST in PLAINFIELD, NJ)
STATE MASTER (New Jersey environmental info) - NJEMS-71618400000, EPCRA, NJEMS-G8890, AIR PROGRAM (Resource Conservation and Recovery Act (tracking hazardous waste)) Business SIC classification: TOP, BODY, AND UPHOLSTERY REPAIR SHOPS AND PAINT SHOPS
AGMEN CONSTRUCTORS (950 S 2ND ST in PLAINFIELD, NJ)
STATE MASTER (New Jersey environmental info) - NJEMS-NJD986585503, HAZARDOUS WASTE PROGRAM Small Quantity Generators, between 100 kg and 1000 kg of hazardous waste/month (Resource Conservation and Recovery Act (tracking hazardous waste)) - notification Organizations: BELMOUNT CONSTRUCTERS (CONTACT/OWNER)
NATIONAL STARCH & CHEMICAL CO. (1700 W. FRONT ST. in PLAINFIELD, NJ)
COMPLIANCE ACTIVITY (Tracking inspections of insecticide, fungicide, and rodenticide, and toxic substances) HAZARDOUS WASTE BIENNIAL REPORTER (Resource Conservation and Recovery Act (tracking hazardous waste)) Large Quantity Generators, more that 1000 kg of hazardous waste/month (Resource Conservation and Recovery Act (tracking hazardous waste)) - notification TRI REPORTER (Tracking of toxic chemicals releasing facilities) Business SIC classification: ADHESIVES AND SEALANTS Organizations: NATIONAL STARCH AND CHEMICAL COMPANY (CONTACT/OPERATOR)
ARKO PAPER PRODUCTS COMPANY INCORPORATED (1426 WEST FRONT STREET in PLAINFIELD, NJ)
(Resource Conservation and Recovery Act (tracking hazardous waste))
GETTY PETROLEUM CORP (1810 WEST FRONT STREET in PLAINFIELD, NJ)
(Resource Conservation and Recovery Act (tracking hazardous waste))
Housing units lacking complete plumbing facilities: 1.1% Housing units lacking complete kitchen facilities: 1.5%
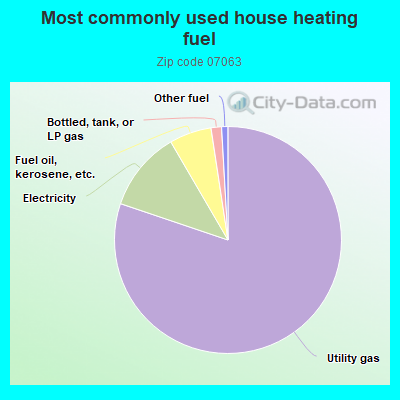
80.2%Utility gas
11.4%Electricity
6.0%Fuel oil, kerosene, etc.
1.5%Bottled, tank, or LP gas
0.9%Other fuel
Population in 1990: 14,285.
Place of birth for U.S.-born residents:
This state: 6,936
Northeast: 1,506
Midwest: 75
South: 737
West: 10
64% of the 07063 zip code residents lived in the same house 5 years ago. Out of people who lived in different houses, 54% lived in this county. Out of people who lived in different counties, 50% lived in New Jersey.
91% of the 07063 zip code residents lived in the same house 1 year ago. Out of people who lived in different houses, 44% moved from this county. Out of people who lived in different houses, 40% moved from different county within same state. Out of people who lived in different houses, 3% moved from different state. Out of people who lived in different houses, 10% moved from abroad.
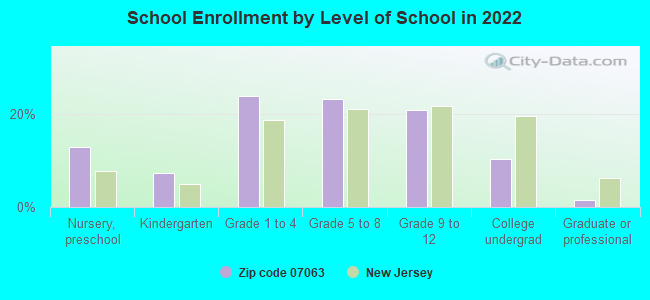
Private vs. public school enrollment:
Students in private schools in grades 1 to 8 (elementary and middle school): 59
Here:
3.2%
New Jersey:
12.3%
Students in private schools in grades 9 to 12 (high school): 56
Here:
6.9%
New Jersey:
13.1%
Students in private undergraduate colleges: 37
Here:
9.2%
New Jersey:
33.2%
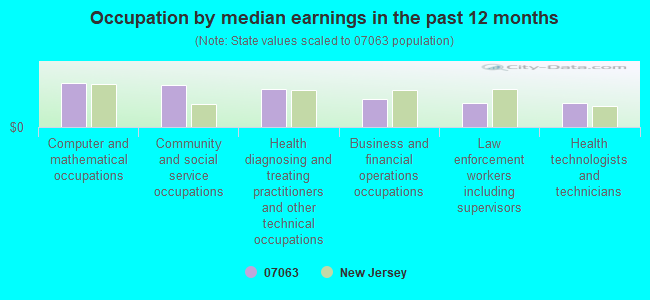
Occupation by median earnings in the past 12 months ($)
119,377Computer and mathematical occupations
113,314Community and social service occupations
102,131Health diagnosing and treating practitioners and other technical occupations
76,122Business and financial operations occupations
65,493Law enforcement workers including supervisors
63,814Health technologists and technicians
Companies with federal contracts located in this zip code:
JEDSTOCK, INC (1149 W FRONT ST in PLAINFIELD, NJ; small business)
$3,105 with Army for Plastics Fabricated Materials. Signed on 2002-06-25. Completion date: 2002-07-31.
Top industries in this zip code by the number of employees in 2005:
Utilities: Electric Power Distribution (100-249 employees: 1 establishment)
Health Care and Social Assistance: All Other Outpatient Care Centers (100-249: 1)
Health Care and Social Assistance: Child Day Care Services (20-49: 2, 1-4: 1)
Other Services (except Public Administration): Commercial and Industrial Machinery and Equipment (except Automotive and Electronic) Repair and Maintenance (20-49: 1, 10-19: 1)
Accommodation and Food Services: Full-Service Restaurants (20-49: 1, 1-4: 1)
Accommodation and Food Services: Limited-Service Restaurants (10-19: 2)
Administrative and Support and Waste Management and Remediation Services: Landscaping Services (10-19: 1, 1-4: 3)
People in group quarters in 2010:
12 people in other noninstitutional facilities
People in group quarters in 2000:
14 people in other noninstitutional group quarters
Fatal accident statistics in 2011:
Fatal accident count: 1
Vehicles involved in fatal accidents: 2
Fatal accidents caused by drunken drivers: 0
Fatalities: 1
Persons involved in fatal accidents: 3
Pedestrians involved in fatal accidents: 0
Home Mortgage Disclosure Act Aggregated Statistics For Year 2009 (Based on 2 full and 6 partial tracts)
A) FHA, FSA/RHS & VA Home Purchase Loans
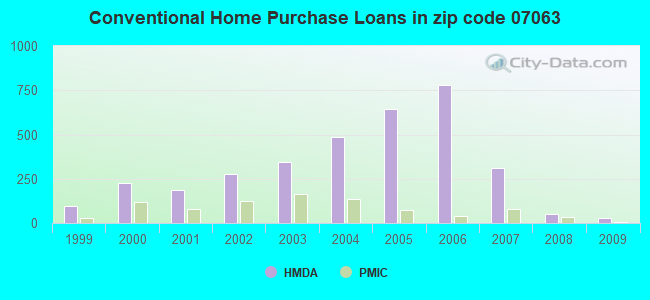
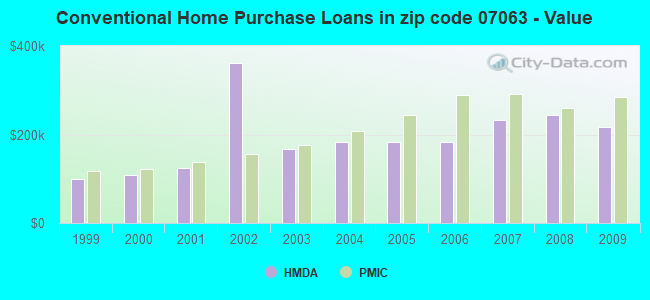
B) Conventional Home Purchase Loans
C) Refinancings
D) Home Improvement Loans
F) Non-occupant Loans on < 5 Family Dwellings (A B C & D)
Number
Average Value
Number
Average Value
Number
Average Value
Number
Average Value
Number
Average Value
LOANS ORIGINATED
115
$190,756
31
$216,591
230
$210,768
15
$74,964
15
$177,159
APPLICATIONS APPROVED, NOT ACCEPTED
9
$220,994
3
$63,547
35
$207,949
6
$10,488
2
$47,975
APPLICATIONS DENIED
42
$225,578
9
$120,030
209
$232,749
44
$36,624
19
$173,449
APPLICATIONS WITHDRAWN
26
$197,824
9
$157,432
179
$251,011
5
$161,748
8
$196,560
FILES CLOSED FOR INCOMPLETENESS
11
$222,257
0
$0
37
$248,316
1
$68,060
0
$0
Aggregated Statistics For Year 2008 (Based on 2 full and 6 partial tracts)
A) FHA, FSA/RHS & VA Home Purchase Loans
B) Conventional Home Purchase Loans
C) Refinancings
D) Home Improvement Loans
E) Loans on Dwellings For 5+ Families
F) Non-occupant Loans on < 5 Family Dwellings (A B C & D)
Number
Average Value
Number
Average Value
Number
Average Value
Number
Average Value
Number
Average Value
Number
Average Value
LOANS ORIGINATED
77
$239,095
53
$244,935
297
$236,109
64
$73,222
2
$795,335
21
$197,727
APPLICATIONS APPROVED, NOT ACCEPTED
7
$248,076
14
$273,029
79
$238,234
12
$72,844
0
$0
6
$274,467
APPLICATIONS DENIED
17
$249,945
66
$255,618
392
$239,537
107
$66,430
0
$0
48
$237,566
APPLICATIONS WITHDRAWN
17
$289,239
26
$250,768
152
$232,668
6
$131,167
0
$0
5
$292,262
FILES CLOSED FOR INCOMPLETENESS
11
$227,889
5
$274,288
37
$284,149
5
$46,798
0
$0
5
$258,758
Aggregated Statistics For Year 2007 (Based on 2 full and 6 partial tracts)
A) FHA, FSA/RHS & VA Home Purchase Loans
B) Conventional Home Purchase Loans
C) Refinancings
D) Home Improvement Loans
E) Loans on Dwellings For 5+ Families
F) Non-occupant Loans on < 5 Family Dwellings (A B C & D)
G) Loans On Manufactured Home Dwelling (A B C & D)
Number
Average Value
Number
Average Value
Number
Average Value
Number
Average Value
Number
Average Value
Number
Average Value
Number
Average Value
LOANS ORIGINATED
30
$290,241
313
$233,507
619
$222,871
111
$107,526
5
$2,189,562
82
$226,991
0
$0
APPLICATIONS APPROVED, NOT ACCEPTED
1
$247,570
82
$225,824
211
$223,817
33
$51,630
0
$0
40
$232,650
0
$0
APPLICATIONS DENIED
4
$322,568
193
$253,896
711
$232,519
190
$75,400
1
$5,580
89
$210,863
2
$37,100
APPLICATIONS WITHDRAWN
20
$301,100
76
$232,778
283
$233,420
30
$94,616
0
$0
22
$206,153
0
$0
FILES CLOSED FOR INCOMPLETENESS
1
$351,290
24
$263,954
96
$256,228
4
$99,060
0
$0
1
$381,400
0
$0
Aggregated Statistics For Year 2006 (Based on 2 full and 6 partial tracts)
A) FHA, FSA/RHS & VA Home Purchase Loans
B) Conventional Home Purchase Loans
C) Refinancings
D) Home Improvement Loans
E) Loans on Dwellings For 5+ Families
F) Non-occupant Loans on < 5 Family Dwellings (A B C & D)
G) Loans On Manufactured Home Dwelling (A B C & D)
Number
Average Value
Number
Average Value
Number
Average Value
Number
Average Value
Number
Average Value
Number
Average Value
Number
Average Value
LOANS ORIGINATED
40
$290,672
782
$182,928
931
$210,013
146
$90,577
9
$552,141
163
$186,588
1
$14,500
APPLICATIONS APPROVED, NOT ACCEPTED
5
$272,082
114
$179,832
190
$197,677
42
$49,615
0
$0
47
$197,903
1
$92,770
APPLICATIONS DENIED
4
$329,335
344
$187,004
763
$207,317
230
$68,593
2
$299,850
127
$205,240
2
$66,910
APPLICATIONS WITHDRAWN
15
$294,610
168
$187,075
376
$208,052
27
$97,725
2
$385,860
45
$212,546
1
$70,260
FILES CLOSED FOR INCOMPLETENESS
0
$0
63
$209,497
122
$224,807
7
$75,959
0
$0
14
$201,560
0
$0
Aggregated Statistics For Year 2005 (Based on 2 full and 6 partial tracts)
A) FHA, FSA/RHS & VA Home Purchase Loans
B) Conventional Home Purchase Loans
C) Refinancings
D) Home Improvement Loans
E) Loans on Dwellings For 5+ Families
F) Non-occupant Loans on < 5 Family Dwellings (A B C & D)
G) Loans On Manufactured Home Dwelling (A B C & D)
Number
Average Value
Number
Average Value
Number
Average Value
Number
Average Value
Number
Average Value
Number
Average Value
Number
Average Value
LOANS ORIGINATED
40
$258,954
643
$182,625
1,045
$192,705
168
$86,565
1
$418,200
207
$183,890
1
$63,780
APPLICATIONS APPROVED, NOT ACCEPTED
5
$244,308
125
$185,563
205
$171,463
36
$87,932
0
$0
38
$171,016
0
$0
APPLICATIONS DENIED
10
$238,936
246
$175,560
677
$177,666
215
$61,528
1
$350,350
96
$176,284
6
$131,268
APPLICATIONS WITHDRAWN
20
$278,506
180
$189,514
486
$183,369
54
$155,377
2
$24,990
51
$179,102
3
$199,477
FILES CLOSED FOR INCOMPLETENESS
4
$203,898
35
$191,951
216
$193,633
3
$104,640
0
$0
2
$128,935
0
$0
Aggregated Statistics For Year 2004 (Based on 2 full and 6 partial tracts)
A) FHA, FSA/RHS & VA Home Purchase Loans
B) Conventional Home Purchase Loans
C) Refinancings
D) Home Improvement Loans
E) Loans on Dwellings For 5+ Families
F) Non-occupant Loans on < 5 Family Dwellings (A B C & D)
G) Loans On Manufactured Home Dwelling (A B C & D)
Number
Average Value
Number
Average Value
Number
Average Value
Number
Average Value
Number
Average Value
Number
Average Value
Number
Average Value
LOANS ORIGINATED
96
$209,038
488
$182,815
788
$163,118
125
$68,358
7
$1,564,070
169
$153,891
1
$8,880
APPLICATIONS APPROVED, NOT ACCEPTED
10
$186,180
96
$174,521
207
$151,119
35
$28,527
0
$0
45
$142,716
1
$13,610
APPLICATIONS DENIED
15
$202,960
158
$170,882
551
$157,653
169
$42,416
1
$1,568,270
66
$166,021
0
$0
APPLICATIONS WITHDRAWN
19
$202,480
96
$180,744
326
$168,083
30
$84,147
0
$0
30
$214,933
0
$0
FILES CLOSED FOR INCOMPLETENESS
2
$329,835
16
$199,611
93
$179,901
3
$23,867
0
$0
10
$217,882
0
$0
Aggregated Statistics For Year 2003 (Based on 2 full and 6 partial tracts)
A) FHA, FSA/RHS & VA Home Purchase Loans
B) Conventional Home Purchase Loans
C) Refinancings
D) Home Improvement Loans
E) Loans on Dwellings For 5+ Families
F) Non-occupant Loans on < 5 Family Dwellings (A B C & D)
Number
Average Value
Number
Average Value
Number
Average Value
Number
Average Value
Number
Average Value
Number
Average Value
LOANS ORIGINATED
108
$177,170
342
$166,862
1,160
$145,647
65
$43,247
2
$546,450
128
$132,640
APPLICATIONS APPROVED, NOT ACCEPTED
10
$185,247
62
$163,035
253
$155,901
43
$46,108
0
$0
23
$155,120
APPLICATIONS DENIED
25
$161,124
95
$153,376
587
$131,266
138
$25,785
1
$29,590
45
$112,633
APPLICATIONS WITHDRAWN
13
$167,660
66
$165,220
463
$152,364
37
$42,052
0
$0
36
$119,630
FILES CLOSED FOR INCOMPLETENESS
7
$150,700
13
$173,138
62
$129,837
0
$0
0
$0
11
$112,469
Aggregated Statistics For Year 2002 (Based on 2 full and 6 partial tracts)
A) FHA, FSA/RHS & VA Home Purchase Loans
B) Conventional Home Purchase Loans
C) Refinancings
D) Home Improvement Loans
E) Loans on Dwellings For 5+ Families
F) Non-occupant Loans on < 5 Family Dwellings (A B C & D)
Number
Average Value
Number
Average Value
Number
Average Value
Number
Average Value
Number
Average Value
Number
Average Value
LOANS ORIGINATED
122
$154,139
278
$360,957
707
$127,808
84
$31,528
3
$897,787
97
$98,195
APPLICATIONS APPROVED, NOT ACCEPTED
21
$132,888
49
$140,256
171
$111,412
52
$34,907
0
$0
22
$122,742
APPLICATIONS DENIED
18
$156,730
82
$114,106
473
$110,436
148
$26,945
1
$129,360
46
$91,824
APPLICATIONS WITHDRAWN
33
$147,201
37
$132,585
284
$114,821
27
$27,299
0
$0
22
$107,734
FILES CLOSED FOR INCOMPLETENESS
2
$124,940
4
$159,410
76
$123,877
9
$33,757
0
$0
1
$95,910
Aggregated Statistics For Year 2001 (Based on 2 full and 6 partial tracts)
A) FHA, FSA/RHS & VA Home Purchase Loans
B) Conventional Home Purchase Loans
C) Refinancings
D) Home Improvement Loans
E) Loans on Dwellings For 5+ Families
F) Non-occupant Loans on < 5 Family Dwellings (A B C & D)
Number
Average Value
Number
Average Value
Number
Average Value
Number
Average Value
Number
Average Value
Number
Average Value
LOANS ORIGINATED
122
$139,245
184
$124,240
486
$117,606
91
$24,234
5
$938,152
59
$86,342
APPLICATIONS APPROVED, NOT ACCEPTED
14
$138,504
27
$130,805
126
$98,624
51
$23,807
0
$0
9
$95,074
APPLICATIONS DENIED
24
$127,157
76
$105,872
419
$90,119
164
$23,173
0
$0
43
$84,689
APPLICATIONS WITHDRAWN
24
$113,370
37
$129,201
216
$96,642
40
$32,178
0
$0
18
$89,013
FILES CLOSED FOR INCOMPLETENESS
8
$164,576
13
$129,512
81
$105,625
1
$20,710
0
$0
2
$66,460
Aggregated Statistics For Year 2000 (Based on 2 full and 6 partial tracts)
A) FHA, FSA/RHS & VA Home Purchase Loans
B) Conventional Home Purchase Loans
C) Refinancings
D) Home Improvement Loans
E) Loans on Dwellings For 5+ Families
F) Non-occupant Loans on < 5 Family Dwellings (A B C & D)
Number
Average Value
Number
Average Value
Number
Average Value
Number
Average Value
Number
Average Value
Number
Average Value
LOANS ORIGINATED
105
$131,263
228
$108,937
216
$88,815
91
$19,237
3
$1,383,227
69
$70,508
APPLICATIONS APPROVED, NOT ACCEPTED
21
$104,672
26
$85,901
102
$94,455
98
$19,874
0
$0
15
$69,955
APPLICATIONS DENIED
29
$127,627
81
$90,017
342
$80,626
150
$23,123
0
$0
43
$76,955
APPLICATIONS WITHDRAWN
16
$118,210
32
$106,120
193
$78,259
18
$22,124
0
$0
21
$83,598
FILES CLOSED FOR INCOMPLETENESS
2
$113,240
18
$77,249
95
$96,987
1
$56,530
0
$0
7
$52,064
Aggregated Statistics For Year 1999 (Based on 1 full and 3 partial tracts)
A) FHA, FSA/RHS & VA Home Purchase Loans
B) Conventional Home Purchase Loans
C) Refinancings
D) Home Improvement Loans
E) Loans on Dwellings For 5+ Families
F) Non-occupant Loans on < 5 Family Dwellings (A B C & D)


 Nearest zip codes: 07060, 08812, 07069, 07080, 07062, 08854.