Estimated zip code population in 2022: 1,809 Zip code population in 2010: 1,771 Zip code population in 2000: 1,420
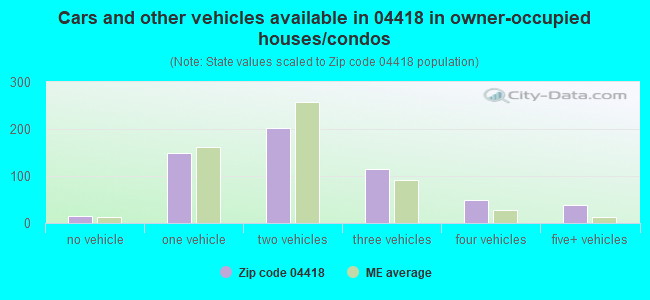
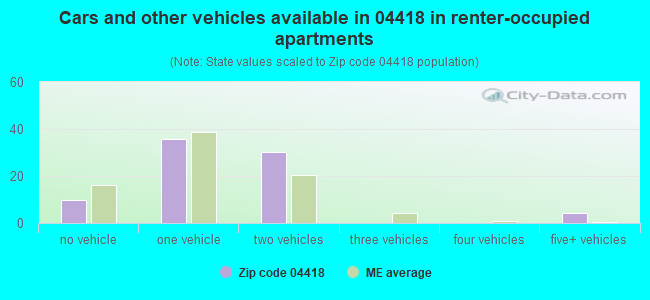
Houses and condos: 843 Renter-occupied apartments: 81
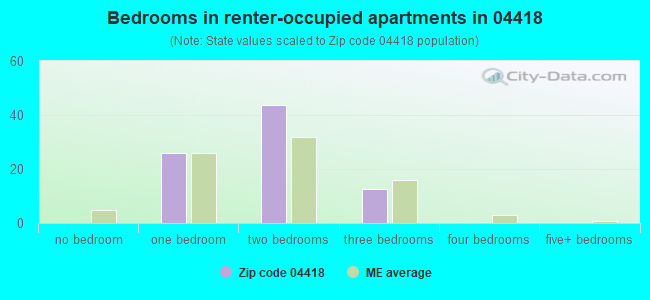
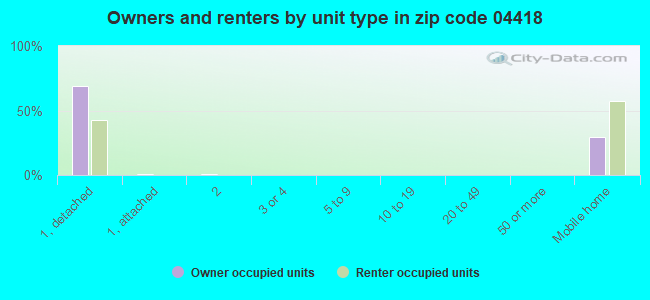
% of renters here:
12%
State:
26%
March 2022 cost of living index in zip code 04418: 84.8 (less than average, U.S. average is 100)
Land area: 147.4 sq. mi. Water area: 0.4 sq. mi.
Population density: 12 people per square mile
(very low).
OSM Map
Google Map
MSN Map
OSM Map
General Map
Google Map
MSN Map
OSM Map
Google Map
MSN Map
OSM Map
Google Map
MSN Map
Please wait while loading the map...
Real estate property taxes paid for housing units in 2022:
This zip code:
0.9% ($1,293)
Maine:
1.0% ($2,785)
Median real estate property taxes paid for housing units with mortgages in 2022: $1,561 (0.8%) Median real estate property taxes paid for housing units with no mortgage in 2022: $956 (1.1%)
Business Search- 14 Million verified businesses
Males: 924
(51.1%)
Females: 884
(48.9%)
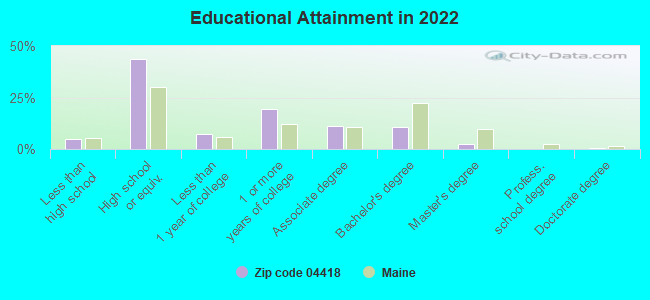
For population 25 years and over in 04418:
High school or higher: 93.0%
Bachelor's degree or higher: 13.3%
Graduate or professional degree: 3.0%
Unemployed: 8.1%
Mean travel time to work (commute): 32.7 minutes
For population 15 years and over in 04418:
Never married: 29.7%
Now married: 55.7%
Separated: 0.9%
Widowed: 3.4%
Divorced: 10.4%
Zip code 04418 compared to state average:
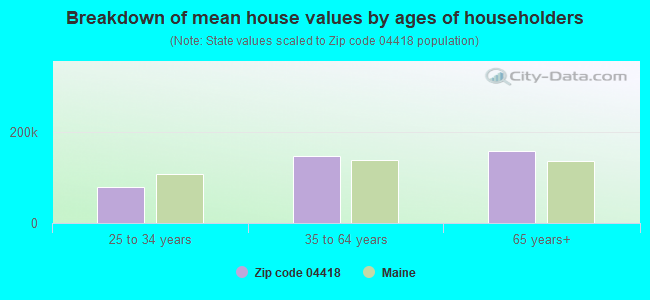
Median house value below state average.
Unemployed percentage above state average.
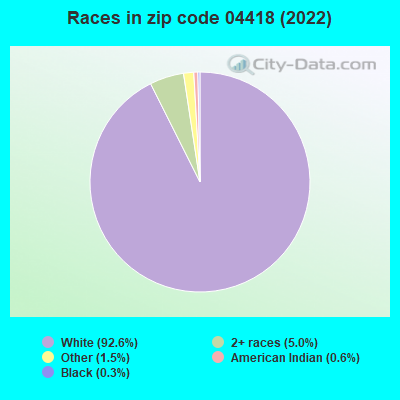
Black race population percentage significantly below state average.
Hispanic race population percentage significantly below state average.
Median age below state average.
Renting percentage below state average.
Length of stay since moving in significantly above state average.
House age below state average.
Number of college students below state average.
Percentage of population with a bachelor's degree or higher significantly below state average.
Averages for the 2020 tax year for zip code 04418, filed in 2021:
Average Adjusted Gross Income (AGI) in 2020: $43,315 (Individual Income Tax Returns)
Here:
$43,315
State:
$68,227
Salary/wage: $40,932 (reported on 86.1% of returns)
Here:
$40,932
State:
$55,127
(% of AGI for various income ranges: 1160.5% for AGIs below $25k, 3740.0% for AGIs $25k-50k, 6838.9% for AGIs $50k-75k, 10167.5% for AGIs $75k-100k, 19483.3% for AGIs $100k-200k)
Taxable interest for individuals: $293 (reported on 20.8% of returns)
This zip code:
$293
Maine:
$1,162
(% of AGI for various income ranges: 4.7% for AGIs below $25k, 4.2% for AGIs $25k-50k, 18.9% for AGIs $50k-75k, 33.3% for AGIs $100k-200k)
Ordinary dividends: $600 (reported on 5.6% of returns)
Here:
$600
State:
$7,695
(% of AGI for various income ranges: 26.7% for AGIs $50k-75k)
Net capital gain/loss in AGI: +$4,340 (reported on 6.9% of returns)
Here:
+$4,340
State:
+$22,201
(% of AGI for various income ranges: 241.1% for AGIs $50k-75k)
Profit/loss from business: +$3,867 (reported on 12.5% of returns)
Here:
+$3,867
State:
+$15,095
(% of AGI for various income ranges: 97.4% for AGIs below $25k, 195.6% for AGIs $50k-75k)
Taxable individual retirement arrangement distribution: $17,640 (reported on 6.9% of returns)
04418:
$17,640
Maine:
$18,314
(% of AGI for various income ranges: 136.3% for AGIs below $25k, 692.2% for AGIs $50k-75k)
Earned income credit: $2,214 (reported on 19.4% of returns)
Here:
$2,214
State:
$1,960
(% of AGI for various income ranges: 103.7% for AGIs below $25k, 59.5% for AGIs $25k-50k)
Percentage of individuals using paid preparers for their 2020 taxes: 94.4%
Here:
94%
State:
92%
(% for various income ranges: 92.0% for AGIs below $25k, 95.8% for AGIs $25k-50k, 92.3% for AGIs $50k-75k, 100.0% for AGIs $75k-100k, 100.0% for AGIs $100k-200k)
Averages for the 2012 tax year for zip code 04418, filed in 2013:
Average Adjusted Gross Income (AGI) in 2012: $36,910 (Individual Income Tax Returns)
Here:
$36,910
State:
$52,375
Salary/wage: $34,656 (reported on 88.7% of returns)
Here:
$34,656
State:
$43,415
(% of AGI for various income ranges: 80.3% for AGIs below $25k, 87.9% for AGIs $25k-50k, 86.2% for AGIs $50k-75k, 78.9% for AGIs $75k-100k, 76.6% for AGIs $100k-200k)
Taxable interest for individuals: $193 (reported on 19.7% of returns)
This zip code:
$193
Maine:
$1,221
(% of AGI for various income ranges: 0.1% for AGIs below $25k, 0.1% for AGIs $50k-75k, 0.2% for AGIs $75k-100k)
Ordinary dividends: $860 (reported on 7.0% of returns)
Here:
$860
State:
$5,812
Profit/loss from business: +$6,478 (reported on 12.7% of returns)
Here:
+$6,478
State:
+$12,144
(% of AGI for various income ranges: 5.0% for AGIs below $25k, 1.0% for AGIs $25k-50k, 4.5% for AGIs $50k-75k)
Taxable individual retirement arrangement distribution: $13,850 (reported on 5.6% of returns)
04418:
$13,850
Maine:
$13,385
Total itemized deductions: $15,980 (22% of AGI, reported on 14.1% of returns)
Here:
$15,980
State:
$21,859
Here:
21.6% of AGI
State:
20.9% of AGI
(% of AGI for various income ranges: 4.8% for AGIs $25k-50k, 11.9% for AGIs $50k-75k, 11.5% for AGIs $100k-200k)
Charity contributions: $3,083 (reported on 8.5% of returns)
Here:
$3,083
State:
$2,741
Taxes paid: $6,270 (reported on 14.1% of returns)
04418:
$6,270
State:
$9,996
(% of AGI for various income ranges: 1.2% for AGIs $25k-50k, 4.6% for AGIs $50k-75k, 6.2% for AGIs $100k-200k)
Earned income credit: $2,356 (reported on 22.5% of returns)
Here:
$2,356
State:
$1,959
(% of AGI for various income ranges: 7.2% for AGIs below $25k, 1.0% for AGIs $25k-50k)
Percentage of individuals using paid preparers for their 2012 taxes: 49.3%
Here:
49%
State:
48%
(% for various income ranges: 43.3% for AGIs below $25k, 50.0% for AGIs $25k-50k, 54.5% for AGIs $50k-75k, 60.0% for AGIs $75k-100k, 66.7% for AGIs $100k-200k)
Averages for the 2004 tax year for zip code 04418, filed in 2005:
Average Adjusted Gross Income (AGI) in 2004: $29,267 (Individual Income Tax Returns)
Here:
$29,267
State:
$42,606
Salary/wage: $28,478 (reported on 91.3% of returns)
Here:
$28,478
State:
$36,376
(% of AGI for various income ranges: 90.1% for AGIs below $10k, 82.9% for AGIs $10k-25k, 90.5% for AGIs $25k-50k, 88.1% for AGIs $50k-75k, 93.7% for AGIs $75k-100k)
Taxable interest for individuals: $368 (reported on 27.0% of returns)
This zip code:
$368
Maine:
$1,367
(% of AGI for various income ranges: 1.5% for AGIs below $10k, 0.2% for AGIs $10k-25k, 0.5% for AGIs $25k-50k, 0.2% for AGIs $50k-75k, 0.1% for AGIs $75k-100k)
Taxable dividends: $255 (reported on 8.5% of returns)
Here:
$255
State:
$3,533
Net capital gain/loss: +$121 (reported on 5.1% of returns)
Here:
+$121
State:
+$11,433
Profit/loss from business: +$6,419 (reported on 14.4% of returns)
Here:
+$6,419
State:
+$10,755
(% of AGI for various income ranges: 13.0% for AGIs below $10k, 9.3% for AGIs $10k-25k, 3.0% for AGIs $25k-50k, -0.2% for AGIs $50k-75k)
IRA payment deduction: $3,182 (reported on 1.7% of returns)
04418:
$3,182
Maine:
$3,014
Total itemized deductions: $13,416 (24% of AGI, reported on 13.8% of returns)
Here:
$13,416
State:
$18,231
Here:
23.9% of AGI
State:
21.7% of AGI
(% of AGI for various income ranges: 2.6% for AGIs $10k-25k, 4.7% for AGIs $25k-50k, 8.9% for AGIs $50k-75k, 13.1% for AGIs $75k-100k)
Charity contributions deductions: $2,149 (4% of AGI, reported on 10.4% of returns)
Here:
$2,149
State:
$2,466
Here:
3.7% of AGI
State:
2.8% of AGI
Total tax: $2,662 (reported on 73.9% of returns)
04418:
$2,662
State:
$6,047
(% of AGI for various income ranges: 2.5% for AGIs below $10k, 5.2% for AGIs $10k-25k, 6.2% for AGIs $25k-50k, 7.7% for AGIs $50k-75k, 9.5% for AGIs $75k-100k)
Earned income credit: $1,691 (reported on 19.1% of returns)
Here:
$1,691
State:
$1,520
Percentage of individuals using paid preparers for their 2004 taxes: 52.2%
Here:
52%
State:
53%
(% for various income ranges: 45.5% for AGIs below $10k, 44.9% for AGIs $10k-25k, 57.1% for AGIs $25k-50k, 64.0% for AGIs $50k-75k, 62.5% for AGIs $75k-100k)
Household received Food Stamps/SNAP in the past 12 months: 120 Household did not receive Food Stamps/SNAP in the past 12 months: 525
Women who had a birth in the past 12 months: 31 (31 now married, 0 unmarried) Women who did not have a birth in the past 12 months: 447 (184 now married, 262 unmarried)
Housing units in zip code 04418 with a mortgage: 282 (28 second mortgage, 28 both second mortgage and home equity loan) Houses without a mortgage: 11
Median monthly owner costs for units with a mortgage: $1,166 Median monthly owner costs for units without a mortgage: $404
Residents with income below the poverty level in 2022:
This zip code:
10.8%
Whole state:
10.8%
Residents with income below 50% of the poverty level in 2022:
This zip code:
8.3%
Whole state:
5.8%
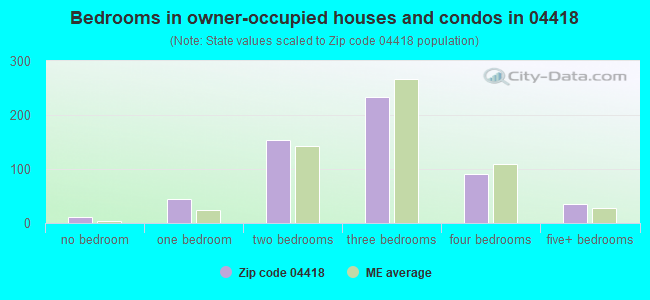
Median number of rooms in houses and condos:
Here:
5.4
State:
6.1
Median number of rooms in apartments:
Here:
3.7
State:
4.0
Notable locations in this zip code not listed on our city pages
Notable locations in zip code 04418: Scotts Corners (A), Greenbush Volunteer Fire Department Codville Station (B), Greenbush Volunteer Fire Department Oloman Station (C). Display/hide their locations on the map
Cemeteries: Welles Cemetery (1), Cardville Cemetery (2), Dennis Cemetery (3), Number Two Cemetery (4), Number One Cemetery (5). Display/hide their locations on the map
Size of family households: 221 2-persons, 68 3-persons, 96 4-persons, 55 5-persons, 3 6-persons, 18 7-or-more-persons
Size of nonfamily households: 105 1-person, 74 2-persons, 8 5-persons
303 married couples with children.
30 single-parent households (8 men, 22 women).
93.8% of residents of 04418 zip code speak English at home.
4.6% of residents speak other Indo-European language at home (65% very well, 35% well).
0.5% of residents speak Asian or Pacific Island language at home (100% not well).
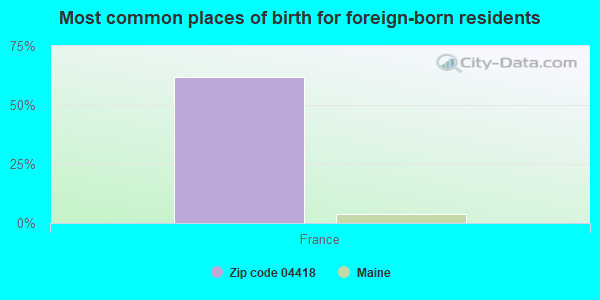
Foreign born population: 49 (2.7%) (6.7% of them are naturalized citizens)
This zip code:
2.7%
Whole state:
4.1%
62%France
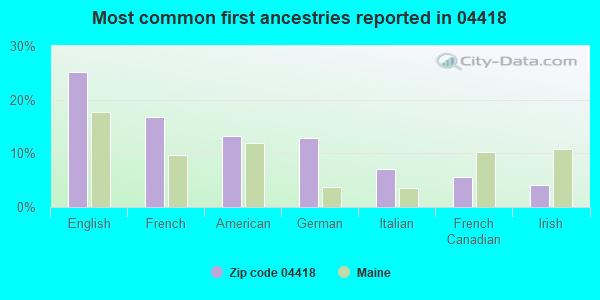
25%English
17%French
13%American
13%German
7%Italian
6%French Canadian
4%Irish
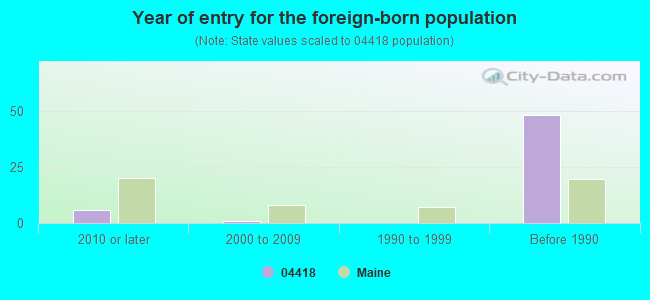
Year of entry for the foreign-born population
62010 or later
12000 to 2009
01990 to 1999
48Before 1990
Facilities with environmental interests located in this zip code:
HELEN S DUNN ELEMENTARY SCHOOL (129 MILITARY ROAD in GREENBUSH, ME)
(National Center for Education Statistics) - STATE ID-17701 Organizations: GREENBUSH SCHOOL DEPARTMENT (SCHOOL DISTRICT)
Housing units lacking complete plumbing facilities: 9.1% Housing units lacking complete kitchen facilities: 9.3%
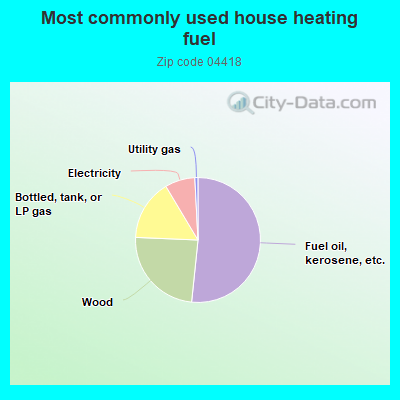
51.8%Fuel oil, kerosene, etc.
24.1%Wood
15.8%Bottled, tank, or LP gas
7.8%Electricity
0.8%Utility gas
Population in 1990: 1,309. Population change in the 1990s: +111 (+8.5%).
Place of birth for U.S.-born residents:
This state: 1,302
Northeast: 255
Midwest: 58
South: 46
West: 62
76% of the 04418 zip code residents lived in the same house 5 years ago. Out of people who lived in different houses, 74% lived in this county. Out of people who lived in different counties, 50% lived in Maine.
91% of the 04418 zip code residents lived in the same house 1 year ago. Out of people who lived in different houses, 29% moved from this county. Out of people who lived in different houses, 84% moved from different state.
Private vs. public school enrollment:
Students in private schools in grades 1 to 8 (elementary and middle school): 53
Here:
27.4%
Maine:
12.7%
Students in private schools in grades 9 to 12 (high school): 3
Here:
4.3%
Maine:
12.6%
Students in private undergraduate colleges: 11
Here:
32.4%
Maine:
34.5%
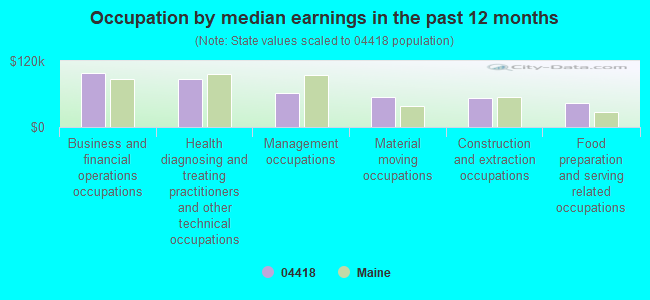
Occupation by median earnings in the past 12 months ($)
98,471Business and financial operations occupations
87,526Health diagnosing and treating practitioners and other technical occupations
61,611Management occupations
53,655Material moving occupations
52,622Construction and extraction occupations
43,884Food preparation and serving related occupations
Top industries in this zip code by the number of employees in 2005:
Other Services (except Public Administration): General Automotive Repair (10-19: 1)
Construction: Electrical Contractors (5-9: 1)
Other Services (except Public Administration): Commercial and Industrial Machinery and Equipment (except Automotive and Electronic) Repair and Maintenance (5-9: 1)
Information: Radio Networks (5-9: 1)
Fatal accident statistics in 2013:
Fatal accident count: 1
Vehicles involved in fatal accidents: 1
Fatal accidents caused by drunken drivers: 1
Fatalities: 1
Persons involved in fatal accidents: 1
Pedestrians involved in fatal accidents: 0
Fatal accident statistics in 2010:
Fatal accident count: 1
Vehicles involved in fatal accidents: 1
Fatal accidents caused by drunken drivers: 0
Fatalities: 1
Persons involved in fatal accidents: 2
Pedestrians involved in fatal accidents: 0
Home Mortgage Disclosure Act Aggregated Statistics For Year 2009 (Based on 4 partial tracts)
A) FHA, FSA/RHS & VA Home Purchase Loans
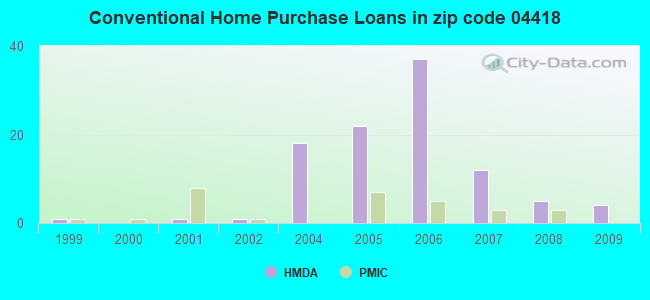
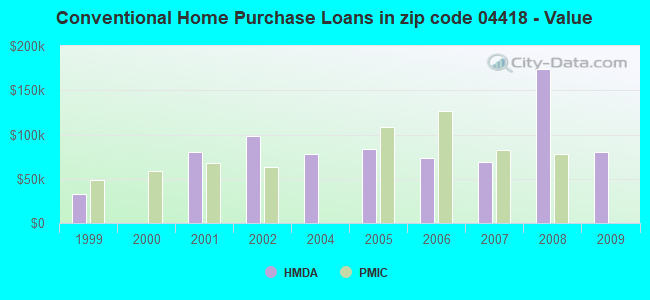
B) Conventional Home Purchase Loans
C) Refinancings
D) Home Improvement Loans
F) Non-occupant Loans on < 5 Family Dwellings (A B C & D)
G) Loans On Manufactured Home Dwelling (A B C & D)
Number
Average Value
Number
Average Value
Number
Average Value
Number
Average Value
Number
Average Value
Number
Average Value
LOANS ORIGINATED
10
$108,174
4
$80,350
23
$98,892
9
$36,228
1
$41,730
8
$57,548
APPLICATIONS APPROVED, NOT ACCEPTED
0
$0
1
$136,940
3
$107,380
0
$0
0
$0
0
$0
APPLICATIONS DENIED
1
$74,340
1
$71,730
14
$85,984
3
$23,200
1
$58,690
5
$79,034
APPLICATIONS WITHDRAWN
0
$0
0
$0
7
$61,297
0
$0
0
$0
1
$53,470
FILES CLOSED FOR INCOMPLETENESS
0
$0
1
$91,290
1
$186,500
0
$0
1
$91,290
0
$0
Aggregated Statistics For Year 2008 (Based on 4 partial tracts)
A) FHA, FSA/RHS & VA Home Purchase Loans
B) Conventional Home Purchase Loans
C) Refinancings
D) Home Improvement Loans
G) Loans On Manufactured Home Dwelling (A B C & D)
Number
Average Value
Number
Average Value
Number
Average Value
Number
Average Value
Number
Average Value
LOANS ORIGINATED
7
$81,420
5
$174,242
20
$66,887
13
$26,789
12
$53,472
APPLICATIONS APPROVED, NOT ACCEPTED
0
$0
3
$152,157
7
$91,900
0
$0
0
$0
APPLICATIONS DENIED
1
$116,070
1
$78,250
16
$86,566
13
$47,558
5
$80,078
APPLICATIONS WITHDRAWN
0
$0
0
$0
12
$103,575
3
$100,857
3
$67,383
FILES CLOSED FOR INCOMPLETENESS
0
$0
0
$0
4
$98,705
1
$261,170
0
$0
Aggregated Statistics For Year 2007 (Based on 4 partial tracts)
A) FHA, FSA/RHS & VA Home Purchase Loans
B) Conventional Home Purchase Loans
C) Refinancings
D) Home Improvement Loans
F) Non-occupant Loans on < 5 Family Dwellings (A B C & D)
G) Loans On Manufactured Home Dwelling (A B C & D)
Number
Average Value
Number
Average Value
Number
Average Value
Number
Average Value
Number
Average Value
Number
Average Value
LOANS ORIGINATED
4
$121,618
12
$68,362
34
$85,156
16
$16,547
0
$0
9
$46,807
APPLICATIONS APPROVED, NOT ACCEPTED
1
$151,290
3
$22,170
10
$90,317
0
$0
0
$0
0
$0
APPLICATIONS DENIED
1
$19,560
13
$32,003
29
$65,987
14
$44,901
1
$41,730
16
$53,309
APPLICATIONS WITHDRAWN
0
$0
1
$50,860
7
$79,556
1
$97,810
1
$50,860
3
$54,340
FILES CLOSED FOR INCOMPLETENESS
0
$0
0
$0
3
$102,383
0
$0
0
$0
0
$0
Aggregated Statistics For Year 2006 (Based on 4 partial tracts)
A) FHA, FSA/RHS & VA Home Purchase Loans
B) Conventional Home Purchase Loans
C) Refinancings
D) Home Improvement Loans
F) Non-occupant Loans on < 5 Family Dwellings (A B C & D)
G) Loans On Manufactured Home Dwelling (A B C & D)
Number
Average Value
Number
Average Value
Number
Average Value
Number
Average Value
Number
Average Value
Number
Average Value
LOANS ORIGINATED
1
$97,810
37
$73,412
34
$72,794
10
$28,301
4
$57,710
9
$53,633
APPLICATIONS APPROVED, NOT ACCEPTED
0
$0
8
$80,534
5
$100,050
3
$40,430
0
$0
1
$110,860
APPLICATIONS DENIED
0
$0
16
$45,402
50
$68,176
10
$24,389
1
$176,770
16
$49,315
APPLICATIONS WITHDRAWN
1
$131,720
7
$97,070
14
$103,767
4
$44,342
0
$0
3
$86,513
FILES CLOSED FOR INCOMPLETENESS
0
$0
0
$0
3
$90,423
1
$104,340
0
$0
0
$0
Aggregated Statistics For Year 2005 (Based on 4 partial tracts)
A) FHA, FSA/RHS & VA Home Purchase Loans
B) Conventional Home Purchase Loans
C) Refinancings
D) Home Improvement Loans
F) Non-occupant Loans on < 5 Family Dwellings (A B C & D)
G) Loans On Manufactured Home Dwelling (A B C & D)
Number
Average Value
Number
Average Value
Number
Average Value
Number
Average Value
Number
Average Value
Number
Average Value
LOANS ORIGINATED
4
$83,795
22
$83,460
40
$85,396
5
$21,434
5
$56,602
10
$48,346
APPLICATIONS APPROVED, NOT ACCEPTED
0
$0
1
$155,200
4
$75,642
1
$19,670
0
$0
0
$0
APPLICATIONS DENIED
0
$0
17
$68,202
30
$88,569
14
$10,528
0
$0
14
$59,061
APPLICATIONS WITHDRAWN
0
$0
0
$0
23
$79,373
7
$103,031
0
$0
0
$0
FILES CLOSED FOR INCOMPLETENESS
0
$0
0
$0
4
$139,875
0
$0
0
$0
0
$0
Aggregated Statistics For Year 2004 (Based on 4 partial tracts)
A) FHA, FSA/RHS & VA Home Purchase Loans
B) Conventional Home Purchase Loans
C) Refinancings
D) Home Improvement Loans
F) Non-occupant Loans on < 5 Family Dwellings (A B C & D)
G) Loans On Manufactured Home Dwelling (A B C & D)
Number
Average Value
Number
Average Value
Number
Average Value
Number
Average Value
Number
Average Value
Number
Average Value
LOANS ORIGINATED
3
$67,820
18
$77,774
50
$66,027
13
$13,556
3
$28,433
16
$45,484
APPLICATIONS APPROVED, NOT ACCEPTED
0
$0
0
$0
10
$98,617
1
$83,470
0
$0
0
$0
APPLICATIONS DENIED
0
$0
0
$0
31
$78,126
3
$9,173
1
$33,970
1
$33,910
APPLICATIONS WITHDRAWN
0
$0
3
$79,990
25
$78,722
1
$83,470
3
$65,643
0
$0
FILES CLOSED FOR INCOMPLETENESS
0
$0
0
$0
4
$77,600
0
$0
0
$0
0
$0
Aggregated Statistics For Year 2002 (Based on 4 partial tracts)
A) FHA, FSA/RHS & VA Home Purchase Loans
B) Conventional Home Purchase Loans
C) Refinancings
D) Home Improvement Loans
Number
Average Value
Number
Average Value
Number
Average Value
Number
Average Value
LOANS ORIGINATED
1
$71,730
1
$97,810
1
$111,560
1
$6,520
APPLICATIONS APPROVED, NOT ACCEPTED
0
$0
0
$0
1
$78,250
0
$0
APPLICATIONS DENIED
0
$0
0
$0
0
$0
0
$0
APPLICATIONS WITHDRAWN
0
$0
0
$0
0
$0
0
$0
FILES CLOSED FOR INCOMPLETENESS
0
$0
0
$0
0
$0
0
$0
Aggregated Statistics For Year 2001 (Based on 4 partial tracts)
B) Conventional Home Purchase Loans
C) Refinancings
Number
Average Value
Number
Average Value
LOANS ORIGINATED
1
$80,640
1
$41,120
APPLICATIONS APPROVED, NOT ACCEPTED
0
$0
1
$62,600
APPLICATIONS DENIED
0
$0
1
$80,240
APPLICATIONS WITHDRAWN
0
$0
0
$0
FILES CLOSED FOR INCOMPLETENESS
0
$0
0
$0
Aggregated Statistics For Year 2000 (Based on 4 partial tracts)
A) FHA, FSA/RHS & VA Home Purchase Loans
B) Conventional Home Purchase Loans
C) Refinancings
D) Home Improvement Loans
Number
Average Value
Number
Average Value
Number
Average Value
Number
Average Value
LOANS ORIGINATED
0
$0
0
$0
5
$28,954
0
$0
APPLICATIONS APPROVED, NOT ACCEPTED
0
$0
0
$0
0
$0
1
$18,260
APPLICATIONS DENIED
1
$67,820
1
$34,230
5
$22,954
0
$0
APPLICATIONS WITHDRAWN
0
$0
0
$0
0
$0
0
$0
FILES CLOSED FOR INCOMPLETENESS
0
$0
0
$0
0
$0
0
$0
Aggregated Statistics For Year 1999 (Based on 2 partial tracts)
Detailed PMIC statistics for the following Tracts:0080.02
, 0225.00
2004 - 2018 National Fire Incident Reporting System (NFIRS) incidents
According to the data from the years 2004 - 2018 the average number of fire incidents per year is 8. The highest number of reported fire incidents - 17 took place in 2009, and the least - 0 in 2013. The data has an increasing trend.
When looking into fire subcategories, the most reports belonged to: Structure Fires (55.6%), and Outside Fires (26.5%).
Fire incident types reported to NFIRS in Zip Code 04418


 Nearest zip codes: 04475, 04493, 04461, 04417, 04411, 04408.
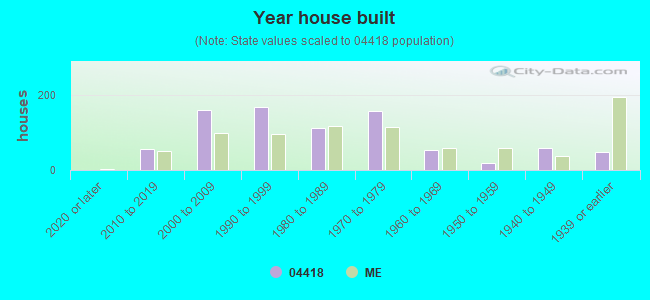


 According to the data from the years 2004 - 2018 the average number of fire incidents per year is 8. The highest number of reported fire incidents - 17 took place in 2009, and the least - 0 in 2013. The data has an increasing trend.
 When looking into fire subcategories, the most reports belonged to: Structure Fires (55.6%), and Outside Fires (26.5%).