Estimated zip code population in 2022: 870 Zip code population in 2010: 862 Zip code population in 2000: 925
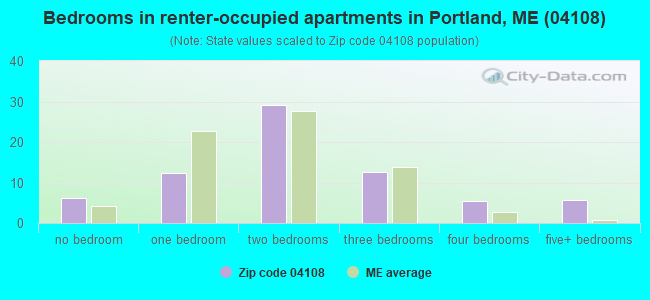
Houses and condos: 1,098 Renter-occupied apartments: 73
% of renters here:
15%
State:
26%
March 2022 cost of living index in zip code 04108: 91.4 (less than average, U.S. average is 100)
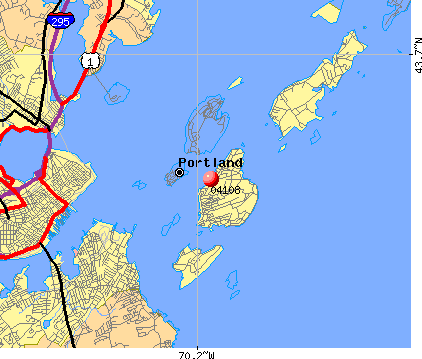
Land area: 1.2 sq. mi. Water area: 0.7 sq. mi.
Population density: 730 people per square mile
(low).
OSM Map
Google Map
MSN Map
OSM Map
General Map
Google Map
MSN Map
OSM Map
Google Map
MSN Map
OSM Map
Google Map
MSN Map
Please wait while loading the map...
Real estate property taxes paid for housing units in 2022:
This zip code:
1.3% ($6,408)
Maine:
1.0% ($2,785)
Median real estate property taxes paid for housing units with mortgages in 2022: $6,161 (1.2%) Median real estate property taxes paid for housing units with no mortgage in 2022: $6,812 (1.5%)
Business Search- 14 Million verified businesses
Males: 398
(45.7%)
Females: 472
(54.3%)
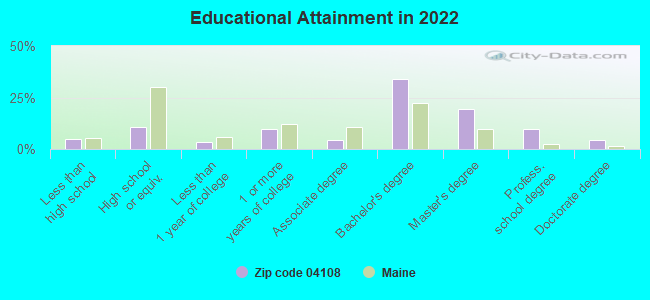
For population 25 years and over in 04108:
High school or higher: 98.0%
Bachelor's degree or higher: 69.4%
Graduate or professional degree: 34.6%
Unemployed: 1.7%
Mean travel time to work (commute): 29.4 minutes
For population 15 years and over in 04108:
Never married: 23.6%
Now married: 56.7%
Separated: 0.5%
Widowed: 6.9%
Divorced: 12.4%
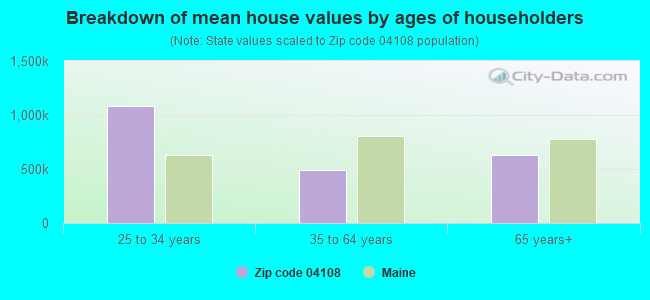
Zip code 04108 compared to state average:
Median house value above state average.
Unemployed percentage below state average.
Black race population percentage significantly below state average.
Median age significantly above state average.
Renting percentage below state average.
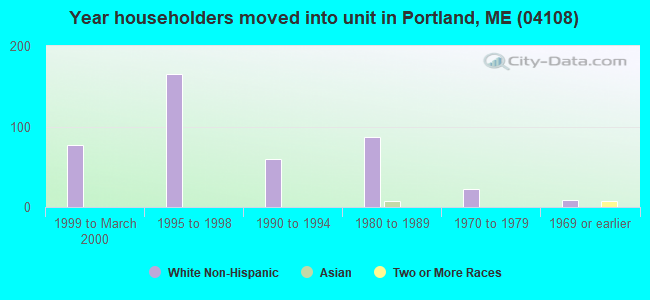
Length of stay since moving in significantly above state average.
House age above state average.
Number of college students significantly below state average.
Percentage of population with a bachelor's degree or higher significantly above state average.
Estimated median house/condo value in 2022: $496,204
04108:
$496,204
Maine:
$290,600
Median resident age:
This zip code:
59.7 years
Maine median age:
45.1 years
Average household size:
This zip code:
1.8 people
Maine:
2.2 people
Averages for the 2020 tax year for zip code 04108, filed in 2021:
Average Adjusted Gross Income (AGI) in 2020: $96,587 (Individual Income Tax Returns)
Here:
$96,587
State:
$68,227
Salary/wage: $73,592 (reported on 73.6% of returns)
Here:
$73,592
State:
$55,127
(% of AGI for various income ranges: 1224.3% for AGIs below $25k, 2951.4% for AGIs $25k-50k, 5247.5% for AGIs $50k-75k, 6366.7% for AGIs $75k-100k, 13496.7% for AGIs $100k-200k)
Taxable interest for individuals: $1,048 (reported on 62.3% of returns)
This zip code:
$1,048
Maine:
$1,162
(% of AGI for various income ranges: 38.6% for AGIs below $25k, 18.6% for AGIs $25k-50k, 50.0% for AGIs $50k-75k, 63.3% for AGIs $75k-100k, 145.0% for AGIs $100k-200k)
Ordinary dividends: $8,720 (reported on 37.7% of returns)
Here:
$8,720
State:
$7,695
(% of AGI for various income ranges: 88.6% for AGIs below $25k, 180.0% for AGIs $25k-50k, 585.0% for AGIs $50k-75k, 636.7% for AGIs $75k-100k, 1188.3% for AGIs $100k-200k)
Net capital gain/loss in AGI: +$18,153 (reported on 35.8% of returns)
Here:
+$18,153
State:
+$22,201
(% of AGI for various income ranges: 77.1% for AGIs below $25k, 125.7% for AGIs $25k-50k, 892.5% for AGIs $50k-75k, 953.3% for AGIs $75k-100k, 910.0% for AGIs $100k-200k)
Profit/loss from business: +$15,385 (reported on 24.5% of returns)
Here:
+$15,385
State:
+$15,095
(% of AGI for various income ranges: 304.3% for AGIs below $25k, 732.9% for AGIs $25k-50k, 1615.0% for AGIs $50k-75k, 1046.7% for AGIs $100k-200k)
Taxable individual retirement arrangement distribution: $23,430 (reported on 18.9% of returns)
04108:
$23,430
Maine:
$18,314
(% of AGI for various income ranges: 267.1% for AGIs below $25k, 1197.5% for AGIs $50k-75k, 2795.0% for AGIs $100k-200k)
Total itemized deductions: $31,444 (reported on 17.0% of returns)
Here:
$31,444
State:
$31,197
(% of AGI for various income ranges: 2040.0% for AGIs $50k-75k, 1861.7% for AGIs $100k-200k)
Charity contributions: $8,275 (reported on 15.1% of returns)
Here:
$8,275
State:
$9,863
(% of AGI for various income ranges: 104.3% for AGIs $25k-50k, 981.7% for AGIs $100k-200k)
Taxes paid: $9,733 (reported on 17.0% of returns)
04108:
$9,733
State:
$8,241
(% of AGI for various income ranges: 815.0% for AGIs $50k-75k, 525.0% for AGIs $100k-200k)
Earned income credit: $1,167 (reported on 5.7% of returns)
Here:
$1,167
State:
$1,960
(% of AGI for various income ranges: 50.0% for AGIs below $25k)
Percentage of individuals using paid preparers for their 2020 taxes: 88.7%
Here:
89%
State:
92%
(% for various income ranges: 85.7% for AGIs below $25k, 81.8% for AGIs $25k-50k, 85.7% for AGIs $50k-75k, 100.0% for AGIs $75k-100k, 90.9% for AGIs $100k-200k, 100.0% for AGIs over 200k)
Averages for the 2012 tax year for zip code 04108, filed in 2013:
Average Adjusted Gross Income (AGI) in 2012: $64,573 (Individual Income Tax Returns)
Here:
$64,573
State:
$52,375
Salary/wage: $48,951 (reported on 71.4% of returns)
Here:
$48,951
State:
$43,415
(% of AGI for various income ranges: 56.5% for AGIs below $25k, 51.4% for AGIs $25k-50k, 58.8% for AGIs $50k-75k, 67.0% for AGIs $75k-100k, 59.9% for AGIs $100k-200k, 43.0% for AGIs over 200k)
Taxable interest for individuals: $1,117 (reported on 46.9% of returns)
This zip code:
$1,117
Maine:
$1,221
(% of AGI for various income ranges: 1.7% for AGIs below $25k, 1.5% for AGIs $25k-50k, 0.5% for AGIs $50k-75k, 0.8% for AGIs $75k-100k, 0.2% for AGIs $100k-200k, 1.1% for AGIs over 200k)
Ordinary dividends: $7,200 (reported on 36.7% of returns)
Here:
$7,200
State:
$5,812
(% of AGI for various income ranges: 5.4% for AGIs below $25k, 3.2% for AGIs $25k-50k, 6.2% for AGIs $50k-75k, 9.4% for AGIs $100k-200k)
Net capital gain/loss in AGI: +$18,173 (reported on 30.6% of returns)
Here:
+$18,173
State:
+$11,897
(% of AGI for various income ranges: 1.4% for AGIs $25k-50k, 3.1% for AGIs $50k-75k, 29.3% for AGIs $100k-200k)
Profit/loss from business: +$20,860 (reported on 30.6% of returns)
Here:
+$20,860
State:
+$12,144
(% of AGI for various income ranges: 17.0% for AGIs below $25k, 12.6% for AGIs $25k-50k, 13.3% for AGIs $50k-75k, 20.3% for AGIs $100k-200k)
Taxable individual retirement arrangement distribution: $16,025 (reported on 16.3% of returns)
04108:
$16,025
Maine:
$13,385
(% of AGI for various income ranges: 8.3% for AGIs below $25k, 9.8% for AGIs $50k-75k, 8.1% for AGIs $100k-200k)
Total itemized deductions: $25,646 (24% of AGI, reported on 49.0% of returns)
Here:
$25,646
State:
$21,859
Here:
24.4% of AGI
State:
20.9% of AGI
(% of AGI for various income ranges: 21.7% for AGIs below $25k, 21.5% for AGIs $25k-50k, 20.2% for AGIs $50k-75k, 27.3% for AGIs $75k-100k, 18.6% for AGIs $100k-200k, 15.9% for AGIs over 200k)
Charity contributions: $2,784 (reported on 38.8% of returns)
Here:
$2,784
State:
$2,741
(% of AGI for various income ranges: 0.9% for AGIs below $25k, 0.8% for AGIs $25k-50k, 1.0% for AGIs $50k-75k, 1.7% for AGIs $75k-100k, 1.8% for AGIs $100k-200k, 2.3% for AGIs over 200k)
Taxes paid: $11,496 (reported on 49.0% of returns)
04108:
$11,496
State:
$9,996
(% of AGI for various income ranges: 6.9% for AGIs below $25k, 8.9% for AGIs $25k-50k, 9.1% for AGIs $50k-75k, 12.6% for AGIs $75k-100k, 9.5% for AGIs $100k-200k, 6.9% for AGIs over 200k)
Earned income credit: $1,667 (reported on 12.2% of returns)
Here:
$1,667
State:
$1,959
(% of AGI for various income ranges: 4.4% for AGIs below $25k)
Percentage of individuals using paid preparers for their 2012 taxes: 49.0%
Here:
49%
State:
48%
(% for various income ranges: 35.0% for AGIs below $25k, 50.0% for AGIs $25k-50k, 66.7% for AGIs $50k-75k, 50.0% for AGIs $75k-100k, 66.7% for AGIs $100k-200k, 66.7% for AGIs over 200k)
Averages for the 2004 tax year for zip code 04108, filed in 2005:
Average Adjusted Gross Income (AGI) in 2004: $62,701 (Individual Income Tax Returns)
Here:
$62,701
State:
$42,606
Salary/wage: $35,096 (reported on 75.6% of returns)
Here:
$35,096
State:
$36,376
(% of AGI for various income ranges: 99.5% for AGIs below $10k, 50.5% for AGIs $10k-25k, 66.2% for AGIs $25k-50k, 60.4% for AGIs $50k-75k, 66.7% for AGIs $75k-100k, 22.3% for AGIs over 100k)
Taxable interest for individuals: $1,604 (reported on 59.3% of returns)
This zip code:
$1,604
Maine:
$1,367
(% of AGI for various income ranges: 6.2% for AGIs below $10k, 4.4% for AGIs $10k-25k, 0.6% for AGIs $25k-50k, 1.3% for AGIs $50k-75k, 1.2% for AGIs $75k-100k, 1.5% for AGIs over 100k)
Taxable dividends: $4,590 (reported on 38.0% of returns)
Here:
$4,590
State:
$3,533
(% of AGI for various income ranges: 8.7% for AGIs below $10k, 6.4% for AGIs $10k-25k, 3.1% for AGIs $25k-50k, 6.1% for AGIs $50k-75k, 2.7% for AGIs $75k-100k, 1.5% for AGIs over 100k)
Net capital gain/loss: +$11,379 (reported on 27.3% of returns)
Here:
+$11,379
State:
+$11,433
(% of AGI for various income ranges: 2.2% for AGIs below $10k, 2.4% for AGIs $10k-25k, 0.5% for AGIs $25k-50k, 0.7% for AGIs $50k-75k, -0.0% for AGIs $75k-100k, 8.9% for AGIs over 100k)
Profit/loss from business: +$15,574 (reported on 29.9% of returns)
Here:
+$15,574
State:
+$10,755
(% of AGI for various income ranges: 5.1% for AGIs below $10k, 17.0% for AGIs $10k-25k, 11.0% for AGIs $25k-50k, 8.9% for AGIs $50k-75k, 10.0% for AGIs $75k-100k, 4.5% for AGIs over 100k)
IRA payment deduction: $3,857 (reported on 4.6% of returns)
04108:
$3,857
Maine:
$3,014
Total itemized deductions: $20,276 (19% of AGI, reported on 48.6% of returns)
Here:
$20,276
State:
$18,231
Here:
19.1% of AGI
State:
21.7% of AGI
(% of AGI for various income ranges: 26.0% for AGIs $10k-25k, 20.8% for AGIs $25k-50k, 22.4% for AGIs $50k-75k, 20.7% for AGIs $75k-100k, 10.7% for AGIs over 100k)
Charity contributions deductions: $1,904 (2% of AGI, reported on 43.5% of returns)
Here:
$1,904
State:
$2,466
Here:
1.9% of AGI
State:
2.8% of AGI
(% of AGI for various income ranges: 1.5% for AGIs $10k-25k, 2.1% for AGIs $25k-50k, 3.1% for AGIs $50k-75k, 2.1% for AGIs $75k-100k, 0.5% for AGIs over 100k)
Total tax: $10,626 (reported on 80.4% of returns)
04108:
$10,626
State:
$6,047
(% of AGI for various income ranges: 2.7% for AGIs below $10k, 6.6% for AGIs $10k-25k, 7.9% for AGIs $25k-50k, 8.4% for AGIs $50k-75k, 10.9% for AGIs $75k-100k, 18.1% for AGIs over 100k)
Earned income credit: $1,085 (reported on 10.3% of returns)
Here:
$1,085
State:
$1,520
Percentage of individuals using paid preparers for their 2004 taxes: 47.5%
Here:
47%
State:
53%
(% for various income ranges: 38.2% for AGIs below $10k, 47.8% for AGIs $10k-25k, 42.1% for AGIs $25k-50k, 48.1% for AGIs $50k-75k, 56.9% for AGIs $75k-100k, 69.6% for AGIs over 100k)
Notable locations in zip code 04108: Peaks Island Marina (A), Jones Landing Marina (B), Forrest City Landing (C), Engineers Wharf (D), Forest City Landing (E), Peaks Island Branch Portland Public Library (F). Display/hide their locations on the map
In group quarters: 9 (-1 institutionalized population)
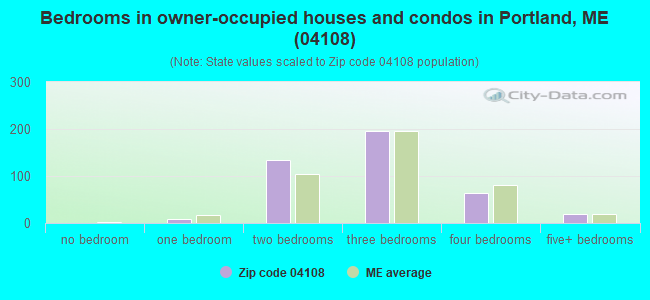
Size of family households: 227 2-persons, 24 3-persons, 9 4-persons, 7 5-persons, 3 7-or-more-persons
Size of nonfamily households: 172 1-person, 53 2-persons
29 married couples with children.
6 single-parent households (6 women).
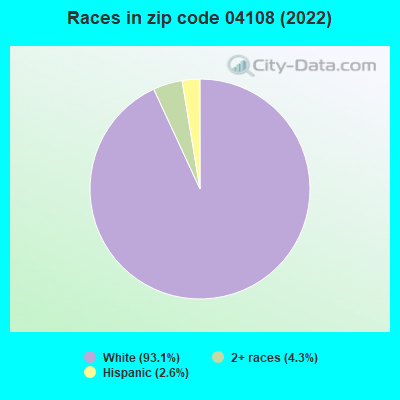
94.8% of residents of 04108 zip code speak English at home.
1.6% of residents speak Spanish at home (93% very well, 7% well).
3.3% of residents speak other Indo-European language at home (100% very well).
0.7% of residents speak other language at home (100% very well).
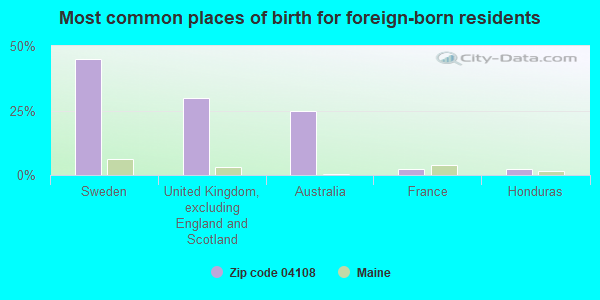
Foreign born population: 44 (5.1%) (100.0% of them are naturalized citizens)
This zip code:
5.1%
Whole state:
4.1%
45%Sweden
30%United Kingdom, excluding England and Scotland
25%Australia
2%France
2%Honduras
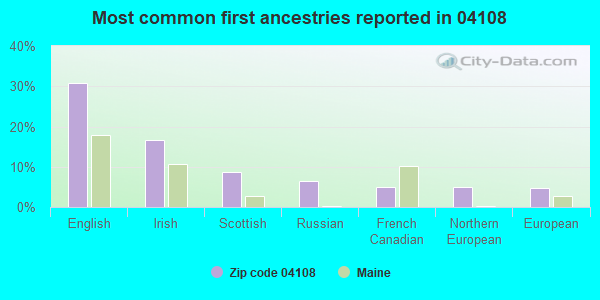
31%English
17%Irish
9%Scottish
6%Russian
5%French Canadian
5%Northern European
5%European
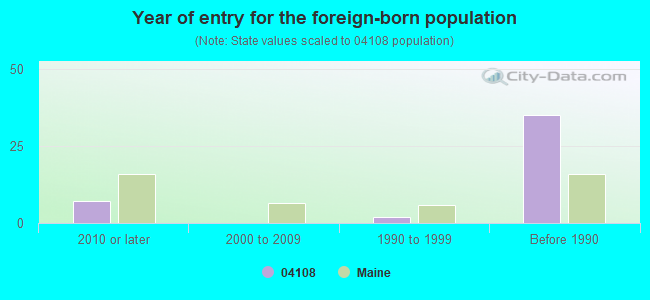
Year of entry for the foreign-born population
72010 or later
02000 to 2009
21990 to 1999
35Before 1990
Facilities with environmental interests located in this zip code:
PEAKS ISLAND SCHOOL (4 CHURCH STREET in PORTLAND, ME)
(Geographic Names Information System) (National Center for Education Statistics) - STATE ID-35318 Organizations: PORTLAND PUBLIC SCHOOLS (SCHOOL DISTRICT)
PEAKS ISLAND WASTEWATER TREATMENT FACILITY (ISLAND AVE. AT WELCH ST. in PORTLAND, ME)
National Pollutant Discharge Elimination System NON-MAJOR (Tracking pollutant discharge elimination systems) - permit Business SIC classification: SEWERAGE SYSTEMS Organizations: PORTLAND WATER DISTRICT (CONTACT/OPERATOR)
, PEAKS ISLAND WWTF (CONTACT/OWNER)
Alternative names: PORTLAND WATER DISTRICT, PORTLAND WATER PEAKS ISLAND
Housing units lacking complete plumbing facilities: 2.3% Housing units lacking complete kitchen facilities: 4.1%
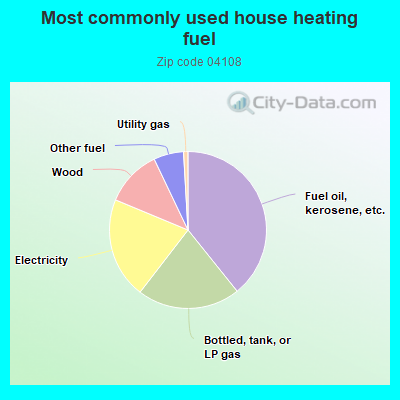
39.4%Fuel oil, kerosene, etc.
21.3%Bottled, tank, or LP gas
20.9%Electricity
11.7%Wood
6.2%Other fuel
0.9%Utility gas
Population in 1990: 775. Population change in the 1990s: +150 (+19.4%).
Place of birth for U.S.-born residents:
This state: 221
Northeast: 422
Midwest: 53
South: 120
West: 30
46% of the 04108 zip code residents lived in the same house 5 years ago. Out of people who lived in different houses, 69% lived in this county. Out of people who lived in different counties, 50% lived in Maine.
91% of the 04108 zip code residents lived in the same house 1 year ago. Out of people who lived in different houses, 25% moved from this county. Out of people who lived in different houses, 28% moved from different county within same state. Out of people who lived in different houses, 51% moved from different state.
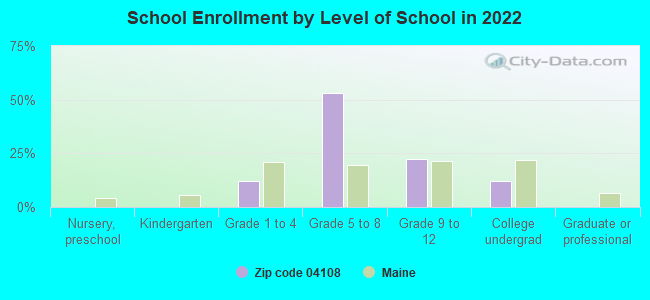
Private vs. public school enrollment:
Students in private schools in grades 1 to 8 (elementary and middle school):
Here:
0.0%
Maine:
12.7%
Students in private schools in grades 9 to 12 (high school):
Here:
0.0%
Maine:
12.6%
Students in private undergraduate colleges: 2
Here:
30.2%
Maine:
34.5%
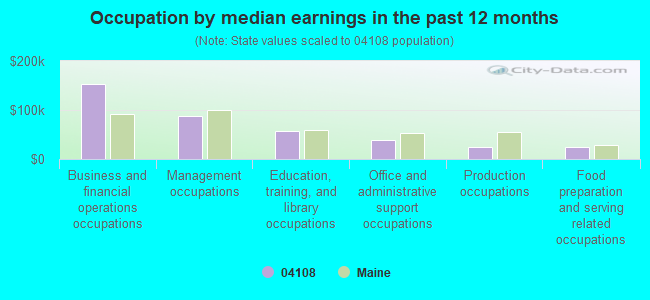
Occupation by median earnings in the past 12 months ($)
153,670Business and financial operations occupations
88,083Management occupations
57,966Education, training, and library occupations
38,646Office and administrative support occupations
24,497Production occupations
24,007Food preparation and serving related occupations
Top industries in this zip code by the number of employees in 2005:
Health Care and Social Assistance: Child Day Care Services (10-19 employees: 1 establishment)
Construction: New Single-Family Housing Construction (except Operative Builders) (10-19: 1)
Accommodation and Food Services: Full-Service Restaurants (5-9: 1, 1-4: 4)
Real Estate and Rental and Leasing: Other Activities Related to Real Estate (1-4: 1)
Arts, Entertainment, and Recreation: Fitness and Recreational Sports Centers (1-4: 1)
Information: Software Publishers (1-4: 1)
People in group quarters in 2010:
12 people in other noninstitutional facilities
People in group quarters in 2000:
2 people in religious group quarters
Home Mortgage Disclosure Act Aggregated Statistics For Year 2009 (Based on 4 full tracts)
A) FHA, FSA/RHS & VA Home Purchase Loans
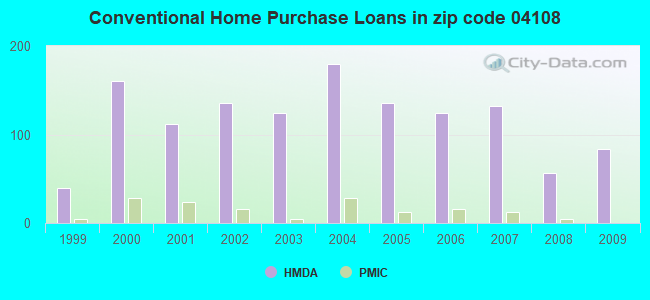
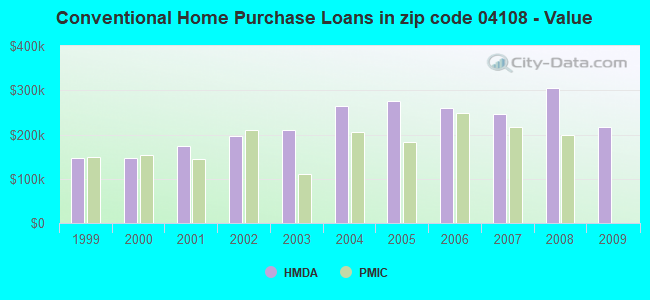
B) Conventional Home Purchase Loans
C) Refinancings
D) Home Improvement Loans
F) Non-occupant Loans on < 5 Family Dwellings (A B C & D)
G) Loans On Manufactured Home Dwelling (A B C & D)
Number
Average Value
Number
Average Value
Number
Average Value
Number
Average Value
Number
Average Value
Number
Average Value
LOANS ORIGINATED
12
$194,667
84
$217,619
356
$224,157
16
$197,500
260
$223,015
4
$93,000
APPLICATIONS APPROVED, NOT ACCEPTED
0
$0
0
$0
16
$237,500
4
$62,000
4
$203,000
0
$0
APPLICATIONS DENIED
0
$0
20
$171,000
104
$237,346
12
$41,000
64
$242,875
0
$0
APPLICATIONS WITHDRAWN
0
$0
4
$220,000
32
$162,500
4
$350,000
20
$143,800
0
$0
FILES CLOSED FOR INCOMPLETENESS
0
$0
0
$0
12
$240,333
0
$0
12
$240,333
0
$0
Aggregated Statistics For Year 2008 (Based on 4 full tracts)
B) Conventional Home Purchase Loans
C) Refinancings
D) Home Improvement Loans
F) Non-occupant Loans on < 5 Family Dwellings (A B C & D)
G) Loans On Manufactured Home Dwelling (A B C & D)
Number
Average Value
Number
Average Value
Number
Average Value
Number
Average Value
Number
Average Value
LOANS ORIGINATED
56
$304,714
152
$240,500
24
$65,833
104
$263,154
0
$0
APPLICATIONS APPROVED, NOT ACCEPTED
20
$259,400
32
$196,000
0
$0
40
$233,600
0
$0
APPLICATIONS DENIED
28
$230,143
64
$238,938
24
$111,000
52
$248,769
4
$35,000
APPLICATIONS WITHDRAWN
20
$236,200
36
$270,111
4
$165,000
36
$257,111
0
$0
FILES CLOSED FOR INCOMPLETENESS
8
$183,000
4
$225,000
0
$0
8
$183,000
0
$0
Aggregated Statistics For Year 2007 (Based on 4 full tracts)
B) Conventional Home Purchase Loans
C) Refinancings
D) Home Improvement Loans
F) Non-occupant Loans on < 5 Family Dwellings (A B C & D)
Number
Average Value
Number
Average Value
Number
Average Value
Number
Average Value
LOANS ORIGINATED
132
$245,515
132
$236,182
28
$71,143
164
$247,488
APPLICATIONS APPROVED, NOT ACCEPTED
36
$270,111
36
$257,889
8
$86,500
36
$186,111
APPLICATIONS DENIED
8
$207,500
72
$260,500
4
$20,000
44
$178,273
APPLICATIONS WITHDRAWN
4
$197,000
36
$357,889
0
$0
4
$212,000
FILES CLOSED FOR INCOMPLETENESS
0
$0
12
$466,667
4
$300,000
4
$300,000
Aggregated Statistics For Year 2006 (Based on 4 full tracts)
A) FHA, FSA/RHS & VA Home Purchase Loans
B) Conventional Home Purchase Loans
C) Refinancings
D) Home Improvement Loans
F) Non-occupant Loans on < 5 Family Dwellings (A B C & D)
Number
Average Value
Number
Average Value
Number
Average Value
Number
Average Value
Number
Average Value
LOANS ORIGINATED
4
$191,000
124
$260,032
204
$210,647
36
$89,333
136
$254,118
APPLICATIONS APPROVED, NOT ACCEPTED
0
$0
20
$169,400
36
$225,667
4
$25,000
4
$360,000
APPLICATIONS DENIED
0
$0
24
$217,167
60
$239,467
4
$355,000
4
$140,000
APPLICATIONS WITHDRAWN
0
$0
20
$211,000
36
$236,333
0
$0
8
$297,000
FILES CLOSED FOR INCOMPLETENESS
0
$0
4
$135,000
8
$177,500
0
$0
8
$232,500
Aggregated Statistics For Year 2005 (Based on 4 full tracts)
A) FHA, FSA/RHS & VA Home Purchase Loans
B) Conventional Home Purchase Loans
C) Refinancings
D) Home Improvement Loans
E) Loans on Dwellings For 5+ Families
F) Non-occupant Loans on < 5 Family Dwellings (A B C & D)
Number
Average Value
Number
Average Value
Number
Average Value
Number
Average Value
Number
Average Value
Number
Average Value
LOANS ORIGINATED
0
$0
136
$275,765
252
$181,698
60
$68,333
0
$0
196
$223,653
APPLICATIONS APPROVED, NOT ACCEPTED
0
$0
8
$236,500
12
$135,667
0
$0
0
$0
4
$295,000
APPLICATIONS DENIED
4
$225,000
20
$324,400
28
$135,429
12
$55,000
0
$0
20
$236,000
APPLICATIONS WITHDRAWN
0
$0
4
$183,000
88
$164,727
12
$120,000
4
$200,000
20
$178,000
FILES CLOSED FOR INCOMPLETENESS
0
$0
4
$158,000
20
$303,800
0
$0
0
$0
4
$158,000
Aggregated Statistics For Year 2004 (Based on 4 full tracts)
B) Conventional Home Purchase Loans
C) Refinancings
D) Home Improvement Loans
E) Loans on Dwellings For 5+ Families
F) Non-occupant Loans on < 5 Family Dwellings (A B C & D)
Number
Average Value
Number
Average Value
Number
Average Value
Number
Average Value
Number
Average Value
LOANS ORIGINATED
180
$265,156
300
$168,267
48
$142,167
4
$165,000
232
$242,241
APPLICATIONS APPROVED, NOT ACCEPTED
28
$244,714
28
$236,000
4
$125,000
0
$0
20
$187,000
APPLICATIONS DENIED
20
$244,000
36
$251,556
24
$53,500
0
$0
36
$135,222
APPLICATIONS WITHDRAWN
16
$261,750
84
$208,524
8
$71,500
0
$0
20
$369,000
FILES CLOSED FOR INCOMPLETENESS
0
$0
16
$235,000
0
$0
0
$0
0
$0
Aggregated Statistics For Year 2003 (Based on 4 full tracts)
B) Conventional Home Purchase Loans
C) Refinancings
D) Home Improvement Loans
E) Loans on Dwellings For 5+ Families
F) Non-occupant Loans on < 5 Family Dwellings (A B C & D)
Number
Average Value
Number
Average Value
Number
Average Value
Number
Average Value
Number
Average Value
LOANS ORIGINATED
124
$209,839
728
$163,143
32
$34,875
0
$0
340
$190,659
APPLICATIONS APPROVED, NOT ACCEPTED
24
$190,833
84
$190,000
4
$50,000
4
$100,000
12
$131,667
APPLICATIONS DENIED
4
$50,000
108
$183,852
12
$38,333
0
$0
32
$154,250
APPLICATIONS WITHDRAWN
20
$148,000
88
$113,182
0
$0
0
$0
12
$139,000
FILES CLOSED FOR INCOMPLETENESS
8
$237,500
12
$148,333
0
$0
0
$0
4
$323,000
Aggregated Statistics For Year 2002 (Based on 4 full tracts)
A) FHA, FSA/RHS & VA Home Purchase Loans
B) Conventional Home Purchase Loans
C) Refinancings
D) Home Improvement Loans
F) Non-occupant Loans on < 5 Family Dwellings (A B C & D)
Number
Average Value
Number
Average Value
Number
Average Value
Number
Average Value
Number
Average Value
LOANS ORIGINATED
4
$114,000
136
$196,882
516
$162,140
28
$27,857
260
$196,108
APPLICATIONS APPROVED, NOT ACCEPTED
0
$0
12
$194,333
28
$221,429
8
$94,500
8
$554,000
APPLICATIONS DENIED
0
$0
8
$233,000
88
$167,409
20
$96,600
32
$164,875
APPLICATIONS WITHDRAWN
0
$0
0
$0
72
$151,167
0
$0
16
$149,500
FILES CLOSED FOR INCOMPLETENESS
0
$0
4
$117,000
12
$70,667
0
$0
4
$117,000
Aggregated Statistics For Year 2001 (Based on 4 full tracts)
A) FHA, FSA/RHS & VA Home Purchase Loans
B) Conventional Home Purchase Loans
C) Refinancings
D) Home Improvement Loans
F) Non-occupant Loans on < 5 Family Dwellings (A B C & D)
Number
Average Value
Number
Average Value
Number
Average Value
Number
Average Value
Number
Average Value
LOANS ORIGINATED
4
$144,000
112
$174,679
396
$127,273
8
$100,000
200
$143,500
APPLICATIONS APPROVED, NOT ACCEPTED
0
$0
12
$204,667
20
$103,000
0
$0
20
$177,800
APPLICATIONS DENIED
0
$0
4
$265,000
72
$97,444
4
$15,000
12
$135,667
APPLICATIONS WITHDRAWN
0
$0
16
$207,000
64
$116,812
4
$15,000
20
$163,600
FILES CLOSED FOR INCOMPLETENESS
0
$0
4
$130,000
24
$140,500
4
$13,000
12
$114,333
Aggregated Statistics For Year 2000 (Based on 4 full tracts)
B) Conventional Home Purchase Loans
C) Refinancings
D) Home Improvement Loans
E) Loans on Dwellings For 5+ Families
F) Non-occupant Loans on < 5 Family Dwellings (A B C & D)
Number
Average Value
Number
Average Value
Number
Average Value
Number
Average Value
Number
Average Value
LOANS ORIGINATED
160
$146,625
80
$120,550
24
$65,167
4
$160,000
92
$133,826
APPLICATIONS APPROVED, NOT ACCEPTED
12
$100,000
16
$165,250
12
$9,667
0
$0
4
$400,000
APPLICATIONS DENIED
36
$102,556
20
$132,800
8
$37,500
0
$0
12
$121,000
APPLICATIONS WITHDRAWN
8
$315,000
8
$192,000
0
$0
0
$0
0
$0
FILES CLOSED FOR INCOMPLETENESS
4
$150,000
4
$298,000
0
$0
0
$0
0
$0
Aggregated Statistics For Year 1999 (Based on 2 partial tracts)
A) FHA, FSA/RHS & VA Home Purchase Loans
B) Conventional Home Purchase Loans
C) Refinancings
D) Home Improvement Loans
F) Non-occupant Loans on < 5 Family Dwellings (A B C & D)
Detailed PMIC statistics for the following Tracts:0024.00
2004 - 2018 National Fire Incident Reporting System (NFIRS) incidents
According to the data from the years 2004 - 2018 the average number of fire incidents per year is 7. The highest number of reported fire incidents - 13 took place in 2015, and the least - 0 in 2017. The data has a dropping trend.
When looking into fire subcategories, the most incidents belonged to: Outside Fires (48.5%), and Structure Fires (36.6%).
Fire incident types reported to NFIRS in Zip Code 04108


 Nearest zip codes: 04109, 04050, 04101, 04110, 04019, 04107.
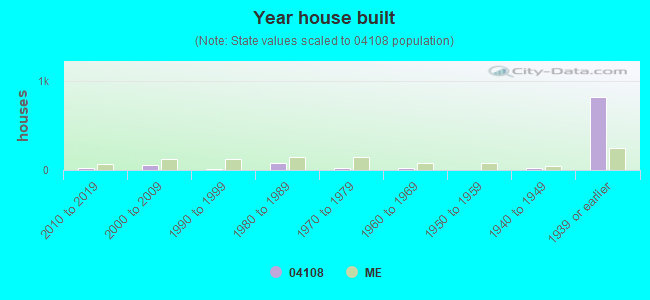


 According to the data from the years 2004 - 2018 the average number of fire incidents per year is 7. The highest number of reported fire incidents - 13 took place in 2015, and the least - 0 in 2017. The data has a dropping trend.
 When looking into fire subcategories, the most incidents belonged to: Outside Fires (48.5%), and Structure Fires (36.6%).