Estimated zip code population in 2022: 3,618 Zip code population in 2010: 3,123 Zip code population in 2000: 2,226
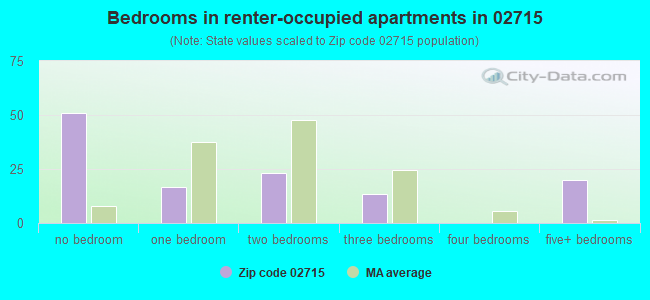
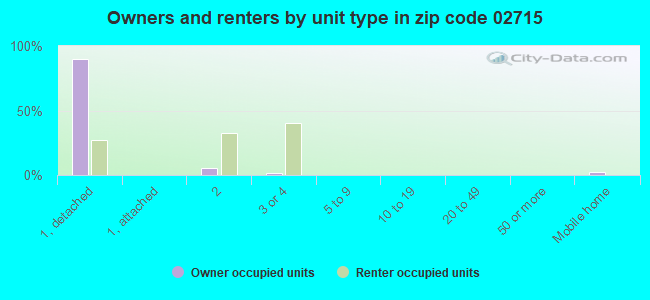
Houses and condos: 1,414 Renter-occupied apartments: 124
% of renters here:
9%
State:
38%
March 2022 cost of living index in zip code 02715: 113.6 (more than average, U.S. average is 100)
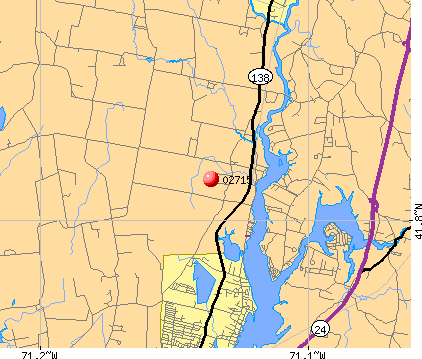
Land area: 11.5 sq. mi. Water area: 0.5 sq. mi.
Population density: 316 people per square mile
(very low).
OSM Map
Google Map
MSN Map
OSM Map
General Map
Google Map
MSN Map
OSM Map
Google Map
MSN Map
OSM Map
Google Map
MSN Map
Please wait while loading the map...
Real estate property taxes paid for housing units in 2022:
This zip code:
1.2% ($6,145)
Massachusetts:
1.0% ($5,536)
Median real estate property taxes paid for housing units with mortgages in 2022: $6,532 (1.1%) Median real estate property taxes paid for housing units with no mortgage in 2022: $5,290 (1.2%)
Business Search- 14 Million verified businesses
Males: 1,628
(45.0%)
Females: 1,990
(55.0%)
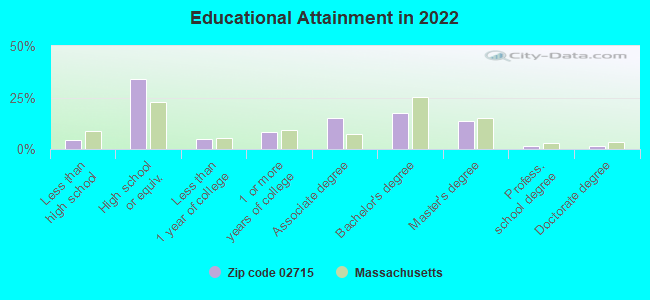
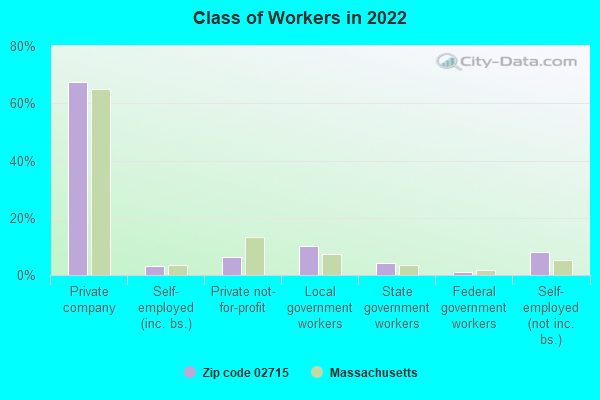
For population 25 years and over in 02715:
High school or higher: 95.3%
Bachelor's degree or higher: 33.7%
Graduate or professional degree: 16.4%
Unemployed: 3.8%
Mean travel time to work (commute): 28.9 minutes
For population 15 years and over in 02715:
Never married: 23.3%
Now married: 64.9%
Separated: 0.0%
Widowed: 3.6%
Divorced: 8.3%
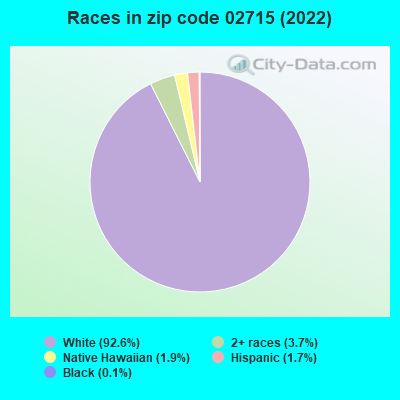
Zip code 02715 compared to state average:
Black race population percentage significantly below state average.
Hispanic race population percentage significantly below state average.
Median age significantly above state average.
Foreign-born population percentage significantly below state average.
Renting percentage significantly below state average.
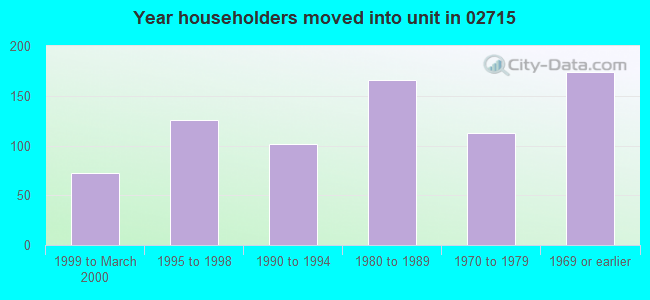
Length of stay since moving in significantly above state average.
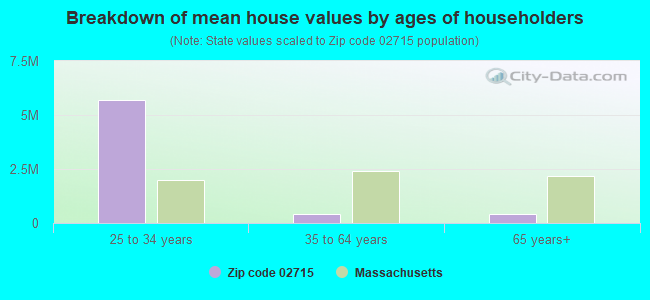
Estimated median house/condo value in 2022: $516,357
02715:
$516,357
Massachusetts:
$534,700
According to our research of Massachusetts and other state lists, there were 2 registered sex offenders living in 02715 zip code as of July 16, 2024. The ratio of all residents to sex offenders in zip code 02715 is 1,838 to 1. The ratio of registered sex offenders to all residents in this zip code is near the state average.
Median resident age:
This zip code:
50.3 years
Massachusetts median age:
40.3 years
Average household size:
This zip code:
2.6 people
Massachusetts:
2.4 people
Averages for the 2020 tax year for zip code 02715, filed in 2021:
Average Adjusted Gross Income (AGI) in 2020: $83,179 (Individual Income Tax Returns)
Here:
$83,179
State:
$105,130
Salary/wage: $74,776 (reported on 86.4% of returns)
Here:
$74,776
State:
$82,951
(% of AGI for various income ranges: 1255.0% for AGIs below $25k, 3296.3% for AGIs $25k-50k, 6242.9% for AGIs $50k-75k, 8670.7% for AGIs $75k-100k, 19351.9% for AGIs $100k-200k, 57206.0% for AGIs over 200k)
Taxable interest for individuals: $567 (reported on 41.7% of returns)
This zip code:
$567
Massachusetts:
$2,361
(% of AGI for various income ranges: 18.4% for AGIs below $25k, 20.0% for AGIs $25k-50k, 24.3% for AGIs $50k-75k, 25.3% for AGIs $75k-100k, 48.1% for AGIs $100k-200k, 228.0% for AGIs over 200k)
Ordinary dividends: $2,449 (reported on 20.6% of returns)
Here:
$2,449
State:
$10,365
(% of AGI for various income ranges: 28.7% for AGIs below $25k, 42.3% for AGIs $25k-50k, 21.0% for AGIs $50k-75k, 58.7% for AGIs $75k-100k, 108.7% for AGIs $100k-200k, 632.0% for AGIs over 200k)
Net capital gain/loss in AGI: +$8,222 (reported on 18.6% of returns)
Here:
+$8,222
State:
+$48,178
(% of AGI for various income ranges: 3.8% for AGIs below $25k, 36.7% for AGIs $25k-50k, 39.0% for AGIs $50k-75k, 26.0% for AGIs $75k-100k, 446.1% for AGIs $100k-200k, 2832.0% for AGIs over 200k)
Profit/loss from business: +$9,312 (reported on 16.6% of returns)
Here:
+$9,312
State:
+$20,792
(% of AGI for various income ranges: 124.7% for AGIs below $25k, 161.3% for AGIs $25k-50k, 216.7% for AGIs $50k-75k, 280.0% for AGIs $75k-100k, 325.8% for AGIs $100k-200k, 610.0% for AGIs over 200k)
Taxable individual retirement arrangement distribution: $16,476 (reported on 8.5% of returns)
02715:
$16,476
Massachusetts:
$22,790
(% of AGI for various income ranges: 54.1% for AGIs below $25k, 81.7% for AGIs $25k-50k, 135.2% for AGIs $50k-75k, 278.0% for AGIs $75k-100k, 542.6% for AGIs $100k-200k)
Total itemized deductions: $26,775 (reported on 14.1% of returns)
Here:
$26,775
State:
$36,722
(% of AGI for various income ranges: 364.7% for AGIs $25k-50k, 376.7% for AGIs $50k-75k, 701.3% for AGIs $75k-100k, 974.8% for AGIs $100k-200k, 3076.0% for AGIs over 200k)
Charity contributions: $3,095 (reported on 11.1% of returns)
Here:
$3,095
State:
$12,529
(% of AGI for various income ranges: 10.0% for AGIs below $25k, 29.5% for AGIs $50k-75k, 27.3% for AGIs $75k-100k, 99.0% for AGIs $100k-200k, 478.0% for AGIs over 200k)
Taxes paid: $8,879 (reported on 14.1% of returns)
02715:
$8,879
State:
$8,782
(% of AGI for various income ranges: 74.3% for AGIs $25k-50k, 151.0% for AGIs $50k-75k, 258.0% for AGIs $75k-100k, 358.4% for AGIs $100k-200k, 896.0% for AGIs over 200k)
Earned income credit: $1,906 (reported on 8.0% of returns)
Here:
$1,906
State:
$1,909
(% of AGI for various income ranges: 50.9% for AGIs below $25k, 47.3% for AGIs $25k-50k)
Percentage of individuals using paid preparers for their 2020 taxes: 92.5%
Here:
92%
State:
92%
(% for various income ranges: 89.8% for AGIs below $25k, 94.7% for AGIs $25k-50k, 92.9% for AGIs $50k-75k, 90.0% for AGIs $75k-100k, 94.1% for AGIs $100k-200k, 92.3% for AGIs over 200k)
Averages for the 2012 tax year for zip code 02715, filed in 2013:
Average Adjusted Gross Income (AGI) in 2012: $65,779 (Individual Income Tax Returns)
Here:
$65,779
State:
$81,425
Salary/wage: $58,192 (reported on 88.8% of returns)
Here:
$58,192
State:
$64,752
(% of AGI for various income ranges: 73.9% for AGIs below $25k, 77.9% for AGIs $25k-50k, 79.0% for AGIs $50k-75k, 83.9% for AGIs $75k-100k, 86.1% for AGIs $100k-200k, 56.7% for AGIs over 200k)
Taxable interest for individuals: $621 (reported on 40.8% of returns)
This zip code:
$621
Massachusetts:
$2,136
(% of AGI for various income ranges: 0.8% for AGIs below $25k, 0.4% for AGIs $25k-50k, 0.8% for AGIs $50k-75k, 0.2% for AGIs $75k-100k, 0.2% for AGIs $100k-200k, 0.5% for AGIs over 200k)
Ordinary dividends: $2,278 (reported on 21.1% of returns)
Here:
$2,278
State:
$9,473
(% of AGI for various income ranges: 1.3% for AGIs below $25k, 0.3% for AGIs $25k-50k, 0.8% for AGIs $50k-75k, 0.5% for AGIs $75k-100k, 0.5% for AGIs $100k-200k, 1.5% for AGIs over 200k)
Net capital gain/loss in AGI: +$1,315 (reported on 13.2% of returns)
Here:
+$1,315
State:
+$31,437
(% of AGI for various income ranges: 0.7% for AGIs $100k-200k, 0.4% for AGIs over 200k)
Profit/loss from business: +$13,826 (reported on 15.1% of returns)
Here:
+$13,826
State:
+$20,662
(% of AGI for various income ranges: 5.5% for AGIs below $25k, 6.1% for AGIs $25k-50k, 1.8% for AGIs $50k-75k, 2.2% for AGIs $75k-100k, 4.3% for AGIs $100k-200k)
Taxable individual retirement arrangement distribution: $12,592 (reported on 7.9% of returns)
02715:
$12,592
Massachusetts:
$18,892
(% of AGI for various income ranges: 3.7% for AGIs below $25k, 1.7% for AGIs $25k-50k, 3.7% for AGIs $50k-75k, 1.6% for AGIs $100k-200k)
Total itemized deductions: $22,684 (22% of AGI, reported on 48.7% of returns)
Here:
$22,684
State:
$28,907
Here:
22.1% of AGI
State:
18.2% of AGI
(% of AGI for various income ranges: 13.8% for AGIs below $25k, 13.8% for AGIs $25k-50k, 17.7% for AGIs $50k-75k, 18.7% for AGIs $75k-100k, 18.8% for AGIs $100k-200k, 12.5% for AGIs over 200k)
Charity contributions: $1,688 (reported on 39.5% of returns)
Here:
$1,688
State:
$4,208
(% of AGI for various income ranges: 0.9% for AGIs below $25k, 1.1% for AGIs $25k-50k, 1.1% for AGIs $50k-75k, 0.8% for AGIs $75k-100k, 1.0% for AGIs $100k-200k, 1.3% for AGIs over 200k)
Taxes paid: $10,931 (reported on 48.7% of returns)
02715:
$10,931
State:
$13,303
(% of AGI for various income ranges: 4.8% for AGIs below $25k, 4.6% for AGIs $25k-50k, 7.2% for AGIs $50k-75k, 7.6% for AGIs $75k-100k, 8.5% for AGIs $100k-200k, 12.0% for AGIs over 200k)
Earned income credit: $1,633 (reported on 9.9% of returns)
Here:
$1,633
State:
$1,971
(% of AGI for various income ranges: 3.0% for AGIs below $25k, 0.7% for AGIs $25k-50k)
Percentage of individuals using paid preparers for their 2012 taxes: 63.2%
Here:
63%
State:
56%
(% for various income ranges: 52.1% for AGIs below $25k, 63.3% for AGIs $25k-50k, 72.7% for AGIs $50k-75k, 73.7% for AGIs $75k-100k, 67.9% for AGIs $100k-200k, 60.0% for AGIs over 200k)
Averages for the 2004 tax year for zip code 02715, filed in 2005:
Average Adjusted Gross Income (AGI) in 2004: $51,554 (Individual Income Tax Returns)
Here:
$51,554
State:
$62,877
Salary/wage: $46,500 (reported on 87.5% of returns)
Here:
$46,500
State:
$52,969
(% of AGI for various income ranges: 120.2% for AGIs below $10k, 73.4% for AGIs $10k-25k, 76.0% for AGIs $25k-50k, 85.9% for AGIs $50k-75k, 88.7% for AGIs $75k-100k, 67.8% for AGIs over 100k)
Taxable interest for individuals: $1,063 (reported on 59.8% of returns)
This zip code:
$1,063
Massachusetts:
$1,945
(% of AGI for various income ranges: 5.5% for AGIs below $10k, 2.1% for AGIs $10k-25k, 1.5% for AGIs $25k-50k, 1.3% for AGIs $50k-75k, 0.7% for AGIs $75k-100k, 1.2% for AGIs over 100k)
Taxable dividends: $1,166 (reported on 23.6% of returns)
Here:
$1,166
State:
$5,323
(% of AGI for various income ranges: 2.2% for AGIs below $10k, 0.7% for AGIs $10k-25k, 1.1% for AGIs $25k-50k, 0.1% for AGIs $50k-75k, 0.3% for AGIs $75k-100k, 0.6% for AGIs over 100k)
Net capital gain/loss: +$10,869 (reported on 18.2% of returns)
Here:
+$10,869
State:
+$20,377
(% of AGI for various income ranges: -3.4% for AGIs below $10k, -0.5% for AGIs $10k-25k, 1.0% for AGIs $25k-50k, -0.1% for AGIs $50k-75k, 0.0% for AGIs $75k-100k, 12.0% for AGIs over 100k)
Profit/loss from business: +$12,585 (reported on 15.8% of returns)
Here:
+$12,585
State:
+$17,837
(% of AGI for various income ranges: 15.4% for AGIs below $10k, 4.3% for AGIs $10k-25k, 4.9% for AGIs $25k-50k, 3.1% for AGIs $50k-75k, 2.4% for AGIs $75k-100k, 4.4% for AGIs over 100k)
IRA payment deduction: $2,857 (reported on 2.7% of returns)
02715:
$2,857
Massachusetts:
$3,100
Total itemized deductions: $18,889 (24% of AGI, reported on 49.3% of returns)
Here:
$18,889
State:
$22,573
Here:
24.0% of AGI
State:
19.5% of AGI
(% of AGI for various income ranges: 11.1% for AGIs below $10k, 17.7% for AGIs $10k-25k, 16.9% for AGIs $25k-50k, 18.3% for AGIs $50k-75k, 21.3% for AGIs $75k-100k, 16.4% for AGIs over 100k)
Charity contributions deductions: $1,644 (2% of AGI, reported on 45.6% of returns)
Here:
$1,644
State:
$3,295
Here:
2.1% of AGI
State:
2.7% of AGI
(% of AGI for various income ranges: 1.0% for AGIs $10k-25k, 1.1% for AGIs $25k-50k, 1.5% for AGIs $50k-75k, 1.4% for AGIs $75k-100k, 1.8% for AGIs over 100k)
Total tax: $6,267 (reported on 84.5% of returns)
02715:
$6,267
State:
$11,494
(% of AGI for various income ranges: 4.6% for AGIs below $10k, 4.7% for AGIs $10k-25k, 7.6% for AGIs $25k-50k, 8.0% for AGIs $50k-75k, 8.7% for AGIs $75k-100k, 15.8% for AGIs over 100k)
Earned income credit: $1,250 (reported on 7.1% of returns)
Here:
$1,250
State:
$1,518
Percentage of individuals using paid preparers for their 2004 taxes: 62.3%
Here:
62%
State:
58%
(% for various income ranges: 43.9% for AGIs below $10k, 60.7% for AGIs $10k-25k, 66.3% for AGIs $25k-50k, 65.0% for AGIs $50k-75k, 67.0% for AGIs $75k-100k, 74.4% for AGIs over 100k)
Household received Food Stamps/SNAP in the past 12 months: 48 Household did not receive Food Stamps/SNAP in the past 12 months: 1,315
Women who had a birth in the past 12 months: 43 (20 now married, 21 unmarried) Women who did not have a birth in the past 12 months: 784 (342 now married, 438 unmarried)
Housing units in zip code 02715 with a mortgage: 854 (73 second mortgage, 74 both second mortgage and home equity loan) Median monthly owner costs for units with a mortgage: $2,618 Median monthly owner costs for units without a mortgage: $865
Residents with income below the poverty level in 2022:
This zip code:
4.7%
Whole state:
10.4%
Residents with income below 50% of the poverty level in 2022:
This zip code:
0.2%
Whole state:
5.1%
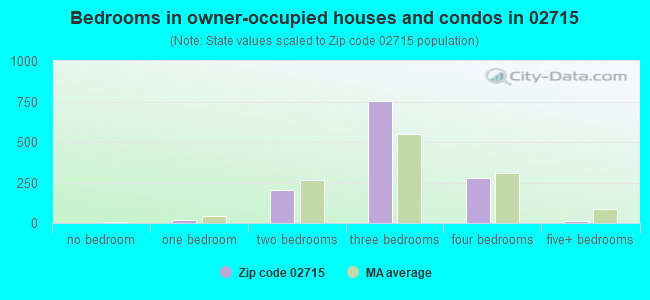
Median number of rooms in houses and condos:
Here:
6.6
State:
6.5
Median number of rooms in apartments:
Here:
4.2
State:
4.0
Notable locations in this zip code not listed on our city pages
Notable locations in zip code 02715: Camp Tattapanum (A), Somerset Pumping Station (B), Dighton Fire Department Station 1 Headquarters (C). Display/hide their locations on the map
In group quarters: 40 (-1 institutionalized population)
Size of family households: 528 2-persons, 210 3-persons, 305 4-persons, 48 5-persons, 10 6-persons
Size of nonfamily households: 200 1-person, 81 2-persons
541 married couples with children.
53 single-parent households (53 women).
89.7% of residents of 02715 zip code speak English at home.
3.3% of residents speak Spanish at home (53% very well, 47% well).
5.8% of residents speak other Indo-European language at home (78% very well, 16% well, 6% not well).
0.6% of residents speak other language at home (100% very well).
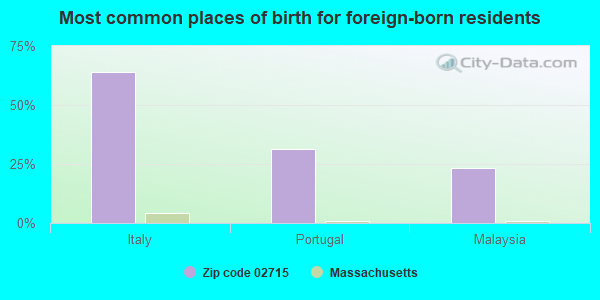
Foreign born population: 244 (6.8%) (100.0% of them are naturalized citizens)
This zip code:
6.8%
Whole state:
18.0%
64%Italy
31%Portugal
23%Malaysia
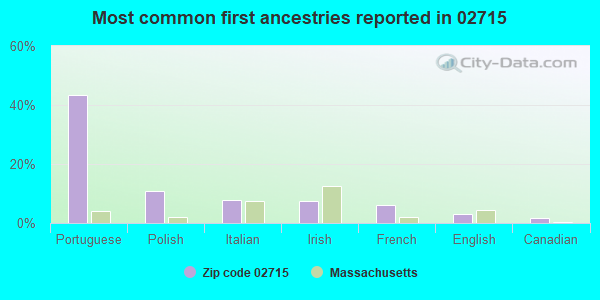
43%Portuguese
11%Polish
8%Italian
8%Irish
6%French
3%English
2%Canadian
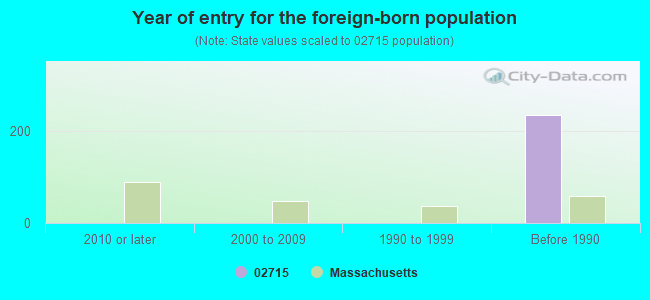
Year of entry for the foreign-born population
02010 or later
02000 to 2009
01990 to 1999
235Before 1990
Facilities with environmental interests located in this zip code:
ZENECA INC (333 MAIN STREET in DIGHTON, MA)
AIR MINOR (AIRS/AFS) HAZARDOUS WASTE BIENNIAL REPORTER (Resource Conservation and Recovery Act (tracking hazardous waste)) - ICIS-01-2004-5022, FORMAL ENFORCEMENT ACTION Large Quantity Generators, more that 1000 kg of hazardous waste/month (Resource Conservation and Recovery Act (tracking hazardous waste)) - ICIS-01-2004-5022, FORMAL ENFORCEMENT ACTION TSD (Resource Conservation and Recovery Act (tracking hazardous waste)) - ICIS-01-2004-5022, FORMAL ENFORCEMENT ACTION TRI REPORTER (Tracking of toxic chemicals releasing facilities) Business SIC classification: MEDICINAL CHEMICALS AND BOTANICAL PRODUCTS; SURFACE ACTIVE AGENTS, FINISHING AGENTS, SULFONATED OILS, AND ASSISTANTS; CYCLIC ORGANIC CRUDES AND INTERMEDIATES, AND ORGANIC DYES AND PIGMENTS Alternative names: ZENECA SPECIALTIES
DRAKA CABLETEQ USA (22 JOSEPH E WARNER BOULEVARD in DIGHTON, MA)
AIR MINOR (AIRS/AFS) CRITERIA AND HAZARDOUS AIR POLLUTANT INVENTORY (Inventory of air pollution sources) Small Quantity Generators, between 100 kg and 1000 kg of hazardous waste/month (Resource Conservation and Recovery Act (tracking hazardous waste)) TRI REPORTER (Tracking of toxic chemicals releasing facilities) Business SIC classification: MISCELLANEOUS FABRICATED WIRE PRODUCTS Organizations: BIW CABLE SYSTEMS (CONTACT/OPERATOR)
, BIW CABLE SYSTEMS, INC (CONTACT/OWNER)
Alternative names: B I W CABLE SYSTEMS INC, BIW CABLE SYS. INC.
BG DIGHTON POWER LLC (1450 SOMERSET AVENUE in DIGHTON, MA)
AIR MAJOR (AIRS/AFS) AIR PROGRAM (Clean Air Markets Division Business System) CRITERIA AND HAZARDOUS AIR POLLUTANT INVENTORY (Inventory of air pollution sources) AIR MAJOR ("Best Available" air pollution technologies tracking) TRI REPORTER (Tracking of toxic chemicals releasing facilities) Business SIC classification: ELECTRIC SERVICES Organizations: DIGHTON POWER ASSOCIATES, LP (OWNER/OPERATOR)
Alternative names: DIGHTON POWER ASSOCIATE, LP, DIGHTON POWER ASSOC, DIGHTON POWER ASSOCIATE, LP
BRISTOL COUNTY AGRICULTURAL SC (CENTER ST in DIGHTON, MA)
COMPLIANCE ACTIVITY (Tracking inspections of insecticide, fungicide, and rodenticide, and toxic substances) Conditionally Exempt Small Quantity Generators, less than 100 kg/month of hazardous waste (Resource Conservation and Recovery Act (tracking hazardous waste)) - notification Alternative names: BRISTOL COUNTY AGRICULTURAL HIGH SCHOOL, BRISTOL COUNTY AGRICULTURAL SCHOOL
Housing units lacking complete plumbing facilities: 2.0% Housing units lacking complete kitchen facilities: 2.0%
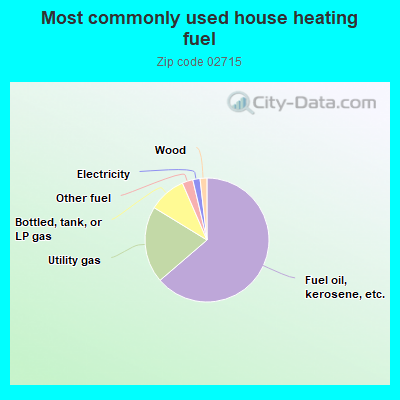
63.9%Fuel oil, kerosene, etc.
20.1%Utility gas
9.8%Bottled, tank, or LP gas
2.8%Other fuel
1.9%Electricity
1.8%Wood
Population in 1990: 1,828. Population change in the 1990s: +398 (+21.8%).
Place of birth for U.S.-born residents:
This state: 2,489
Northeast: 622
Midwest: 79
South: 125
West: 38
78% of the 02715 zip code residents lived in the same house 5 years ago. Out of people who lived in different houses, 75% lived in this county. Out of people who lived in different counties, 50% lived in Massachusetts.
97% of the 02715 zip code residents lived in the same house 1 year ago. Out of people who lived in different houses, 95% moved from this county.
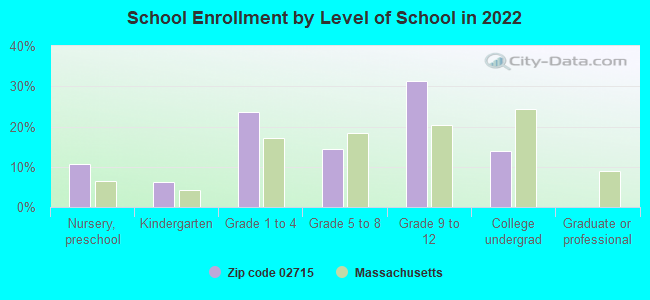
Private vs. public school enrollment:
Students in private schools in grades 1 to 8 (elementary and middle school): 15
Here:
5.6%
Massachusetts:
10.3%
Students in private schools in grades 9 to 12 (high school):
Here:
0.0%
Massachusetts:
12.3%
Students in private undergraduate colleges: 50
Here:
51.8%
Massachusetts:
51.2%
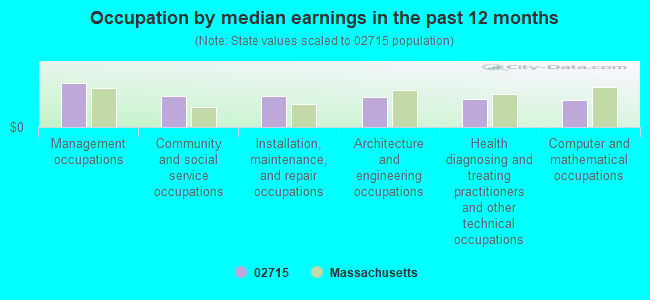
Occupation by median earnings in the past 12 months ($)
121,213Management occupations
86,318Community and social service occupations
84,717Installation, maintenance, and repair occupations
83,396Architecture and engineering occupations
78,437Health diagnosing and treating practitioners and other technical occupations
73,369Computer and mathematical occupations
Top industries in this zip code by the number of employees in 2005:
Construction: Other Building Finishing Contractors (20-49 employees: 1 establishment)
Health Care and Social Assistance: Residential Mental Retardation Facilities (20-49: 1)
Health Care and Social Assistance: Offices of Physicians (except Mental Health Specialists) (20-49: 1)
Accommodation and Food Services: Limited-Service Restaurants (10-19: 2, 1-4: 1)
Utilities: Fossil Fuel Electric Power Generation (10-19: 1)
Accommodation and Food Services: Full-Service Restaurants (5-9: 1, 1-4: 2)
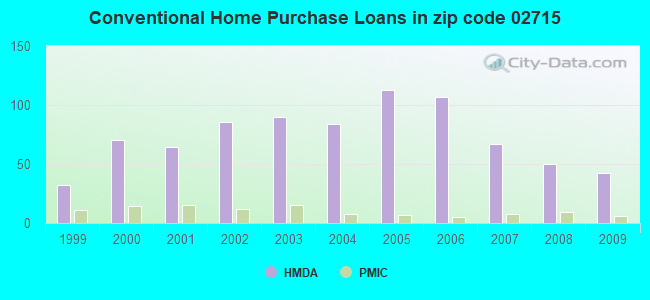
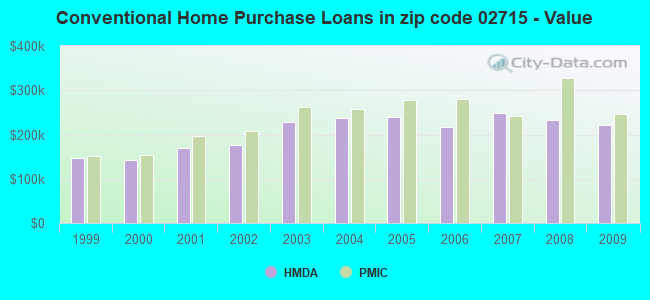
Detailed PMIC statistics for the following Tracts:6151.00
2002 - 2018 National Fire Incident Reporting System (NFIRS) incidents
According to the data from the years 2002 - 2018 the average number of fire incidents per year is 11. The highest number of reported fires - 20 took place in 2002, and the least - 3 in 2015. The data has a declining trend.
When looking into fire subcategories, the most reports belonged to: Outside Fires (47.7%), and Structure Fires (33.8%).
Fire incident types reported to NFIRS in Zip Code 02715


 Nearest zip codes: 02726, 02764, 02777, 02779, 02720, 02725.


 According to the data from the years 2002 - 2018 the average number of fire incidents per year is 11. The highest number of reported fires - 20 took place in 2002, and the least - 3 in 2015. The data has a declining trend.
 When looking into fire subcategories, the most reports belonged to: Outside Fires (47.7%), and Structure Fires (33.8%).