Estimated median house/condo value in 2022: $416,688
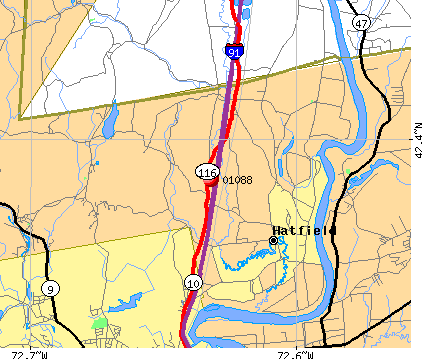
01088:
$416,688
Massachusetts:
$534,700
According to our research of Massachusetts and other state lists, there was 1 registered sex offender living in 01088 zip code as of July 03, 2024. The ratio of all residents to sex offenders in zip code 01088 is 439 to 1.
Median resident age:
This zip code:
31.8 years
Massachusetts median age:
40.3 years
Average household size:
This zip code:
1.8 people
Massachusetts:
2.4 people
Averages for the 2020 tax year for zip code 01088, filed in 2021:
Average Adjusted Gross Income (AGI) in 2020: $63,315 (Individual Income Tax Returns)
Here:
$63,315
State:
$105,130
Salary/wage: $52,288 (reported on 76.5% of returns)
Here:
$52,288
State:
$82,951
(% of AGI for various income ranges: 944.3% for AGIs below $25k, 2888.3% for AGIs $25k-50k, 6732.5% for AGIs $50k-75k, 8900.0% for AGIs $75k-100k, 22426.7% for AGIs $100k-200k)
Taxable interest for individuals: $662 (reported on 38.2% of returns)
This zip code:
$662
Massachusetts:
$2,361
(% of AGI for various income ranges: 27.1% for AGIs below $25k, 60.0% for AGIs $50k-75k, 143.3% for AGIs $100k-200k)
Ordinary dividends: $2,825 (reported on 23.5% of returns)
Here:
$2,825
State:
$10,365
(% of AGI for various income ranges: 85.0% for AGIs $25k-50k, 212.5% for AGIs $50k-75k, 300.0% for AGIs $100k-200k)
Net capital gain/loss in AGI: +$9,214 (reported on 20.6% of returns)
Here:
+$9,214
State:
+$48,178
(% of AGI for various income ranges: 225.0% for AGIs $25k-50k, 1700.0% for AGIs $100k-200k)
Profit/loss from business: +$8,317 (reported on 17.6% of returns)
Here:
+$8,317
State:
+$20,792
(% of AGI for various income ranges: 171.4% for AGIs below $25k, 947.5% for AGIs $50k-75k)
Taxable individual retirement arrangement distribution: $25,800 (reported on 8.8% of returns)
01088:
$25,800
Massachusetts:
$22,790
(% of AGI for various income ranges: 1935.0% for AGIs $50k-75k)
Total itemized deductions: $24,250 (reported on 5.9% of returns)
Here:
$24,250
State:
$36,722
(% of AGI for various income ranges: 1212.5% for AGIs $50k-75k)
Taxes paid: $8,600 (reported on 5.9% of returns)
01088:
$8,600
State:
$8,782
(% of AGI for various income ranges: 430.0% for AGIs $50k-75k)
Earned income credit: $1,433 (reported on 8.8% of returns)
Here:
$1,433
State:
$1,909
(% of AGI for various income ranges: 61.4% for AGIs below $25k)
Percentage of individuals using paid preparers for their 2020 taxes: 94.1%
Here:
94%
State:
92%
(% for various income ranges: 90.9% for AGIs below $25k, 100.0% for AGIs $25k-50k, 100.0% for AGIs $50k-75k, 100.0% for AGIs $75k-100k, 85.7% for AGIs $100k-200k)
Averages for the 2012 tax year for zip code 01088, filed in 2013:
Average Adjusted Gross Income (AGI) in 2012: $51,025 (Individual Income Tax Returns)
Here:
$51,025
State:
$81,425
Salary/wage: $44,371 (reported on 75.0% of returns)
Here:
$44,371
State:
$64,752
(% of AGI for various income ranges: 63.5% for AGIs below $25k, 69.0% for AGIs $25k-50k, 73.5% for AGIs $50k-75k, 80.0% for AGIs $75k-100k, 53.4% for AGIs $100k-200k)
Taxable interest for individuals: $721 (reported on 43.8% of returns)
This zip code:
$721
Massachusetts:
$2,136
(% of AGI for various income ranges: 0.4% for AGIs below $25k, 0.5% for AGIs $25k-50k, 1.0% for AGIs $50k-75k, 0.7% for AGIs $100k-200k)
Ordinary dividends: $3,850 (reported on 25.0% of returns)
Here:
$3,850
State:
$9,473
(% of AGI for various income ranges: 2.2% for AGIs below $25k, 0.9% for AGIs $50k-75k, 4.0% for AGIs $100k-200k)
Profit/loss from business: +$13,980 (reported on 15.6% of returns)
Here:
+$13,980
State:
+$20,662
Taxable individual retirement arrangement distribution: $3,400 (reported on 6.2% of returns)
01088:
$3,400
Massachusetts:
$18,892
Total itemized deductions: $19,678 (19% of AGI, reported on 28.1% of returns)
Here:
$19,678
State:
$28,907
Here:
19.5% of AGI
State:
18.2% of AGI
Charity contributions: $1,475 (reported on 25.0% of returns)
Here:
$1,475
State:
$4,208
Taxes paid: $8,767 (reported on 28.1% of returns)
01088:
$8,767
State:
$13,303
Earned income credit: $1,500 (reported on 9.4% of returns)
Here:
$1,500
State:
$1,971
(% of AGI for various income ranges: 3.2% for AGIs below $25k)
Percentage of individuals using paid preparers for their 2012 taxes: 50.0%
Here:
50%
State:
56%
(% for various income ranges: 45.5% for AGIs below $25k, 37.5% for AGIs $25k-50k, 83.3% for AGIs $50k-75k, 75.0% for AGIs $100k-200k)
Averages for the 2004 tax year for zip code 01088, filed in 2005:
Average Adjusted Gross Income (AGI) in 2004: $46,045 (Individual Income Tax Returns)
Here:
$46,045
State:
$62,877
Salary/wage: $39,597 (reported on 83.1% of returns)
Here:
$39,597
State:
$52,969
(% of AGI for various income ranges: 71.0% for AGIs below $10k, 66.6% for AGIs $10k-25k, 78.3% for AGIs $25k-50k, 75.5% for AGIs $50k-75k, 78.0% for AGIs $75k-100k, 64.6% for AGIs over 100k)
Taxable interest for individuals: $1,163 (reported on 57.5% of returns)
This zip code:
$1,163
Massachusetts:
$1,945
(% of AGI for various income ranges: 2.4% for AGIs below $10k, 3.7% for AGIs $10k-25k, 1.3% for AGIs $25k-50k, 0.5% for AGIs $50k-75k, 1.3% for AGIs $75k-100k, 1.6% for AGIs over 100k)
Taxable dividends: $1,647 (reported on 32.0% of returns)
Here:
$1,647
State:
$5,323
(% of AGI for various income ranges: 1.6% for AGIs below $10k, 1.5% for AGIs $10k-25k, 0.4% for AGIs $25k-50k, 1.0% for AGIs $50k-75k, 1.8% for AGIs over 100k)
Net capital gain/loss: +$5,714 (reported on 18.4% of returns)
Here:
+$5,714
State:
+$20,377
(% of AGI for various income ranges: 1.2% for AGIs $10k-25k, 0.5% for AGIs $50k-75k, 5.6% for AGIs over 100k)
Profit/loss from business: +$10,960 (reported on 18.8% of returns)
Here:
+$10,960
State:
+$17,837
(% of AGI for various income ranges: 44.8% for AGIs below $10k, 8.3% for AGIs $25k-50k, 1.8% for AGIs $50k-75k, 4.2% for AGIs over 100k)
IRA payment deduction: $2,273 (reported on 4.1% of returns)
01088:
$2,273
Massachusetts:
$3,100
Total itemized deductions: $18,769 (22% of AGI, reported on 34.2% of returns)
Here:
$18,769
State:
$22,573
Here:
22.0% of AGI
State:
19.5% of AGI
(% of AGI for various income ranges: 13.9% for AGIs $25k-50k, 12.4% for AGIs $50k-75k, 17.1% for AGIs $75k-100k, 18.0% for AGIs over 100k)
Charity contributions deductions: $2,061 (2% of AGI, reported on 30.8% of returns)
Here:
$2,061
State:
$3,295
Here:
2.3% of AGI
State:
2.7% of AGI
Total tax: $6,443 (reported on 83.1% of returns)
01088:
$6,443
State:
$11,494
(% of AGI for various income ranges: 4.0% for AGIs below $10k, 5.2% for AGIs $10k-25k, 9.1% for AGIs $25k-50k, 9.9% for AGIs $50k-75k, 10.3% for AGIs $75k-100k, 16.2% for AGIs over 100k)
Earned income credit: $650 (reported on 7.5% of returns)
Here:
$650
State:
$1,518
Percentage of individuals using paid preparers for their 2004 taxes: 57.5%
Here:
58%
State:
58%
(% for various income ranges: 55.8% for AGIs below $10k, 43.3% for AGIs $10k-25k, 53.0% for AGIs $25k-50k, 71.1% for AGIs $50k-75k, 73.3% for AGIs $75k-100k, 71.4% for AGIs over 100k)
Likely homosexual households (counted as self-reported same-sex unmarried-partner households)
Lesbian couples: 3.4% of all households
Gay men: 0.0% of all households
Household received Food Stamps/SNAP in the past 12 months: 65 Household did not receive Food Stamps/SNAP in the past 12 months: 333
Women who had a birth in the past 12 months: 36 (37 now married, 0 unmarried) Women who did not have a birth in the past 12 months: 208 (65 now married, 144 unmarried)
Housing units in zip code 01088 with a mortgage: 87 (12 second mortgage, 12 both second mortgage and home equity loan) Houses without a mortgage: 25
Median monthly owner costs for units with a mortgage: $2,411 Median monthly owner costs for units without a mortgage: $490
Residents with income below the poverty level in 2022:
This zip code:
12.5%
Whole state:
10.4%
Residents with income below 50% of the poverty level in 2022:
This zip code:
2.2%
Whole state:
5.1%
Median number of rooms in houses and condos:
Here:
6.7
State:
6.5
Median number of rooms in apartments:
Here:
2.3
State:
4.0
Notable locations in this zip code not listed on our city pages
Size of family households: 148 2-persons, 10 3-persons, 41 6-persons
Size of nonfamily households: 166 1-person, 34 2-persons
53 married couples with children.
86 single-parent households (86 women).
92.2% of residents of 01088 zip code speak English at home.
1.0% of residents speak Spanish at home (100% very well).
0.5% of residents speak other Indo-European language at home (100% very well).
5.5% of residents speak Asian or Pacific Island language at home (100% very well).
Foreign born population: 86 (11.9%) (52.9% of them are naturalized citizens)
This zip code:
11.9%
Whole state:
18.0%
31%Sweden
30%Malaysia
7%Guyana
57%Italian
9%British
5%Irish
4%French
4%Polish
3%American
3%Australian
Year of entry for the foreign-born population
02010 or later
292000 to 2009
01990 to 1999
50Before 1990
41.3%Electricity
25.8%Utility gas
11.9%Fuel oil, kerosene, etc.
10.6%Wood
9.0%Bottled, tank, or LP gas
2.1%Other fuel
Place of birth for U.S.-born residents:
This state: 334
Northeast: 255
South: 50
69% of the 01088 zip code residents lived in the same house 5 years ago. Out of people who lived in different houses, 53% lived in this county. Out of people who lived in different counties, 50% lived in Massachusetts.
79% of the 01088 zip code residents lived in the same house 1 year ago. Out of people who lived in different houses, 90% moved from this county.
Private vs. public school enrollment:
Students in private schools in grades 1 to 8 (elementary and middle school):
Here:
0.0%
Massachusetts:
10.3%
Students in private schools in grades 9 to 12 (high school):
Here:
0.0%
Massachusetts:
12.3%
Students in private undergraduate colleges: 20
Here:
40.3%
Massachusetts:
51.2%
Occupation by median earnings in the past 12 months ($)
76,735Education, training, and library occupations
43,197Office and administrative support occupations
23,257Management occupations
Top industries in this zip code by the number of employees in 2005:
Other Services (except Public Administration): Commercial and Industrial Machinery and Equipment (except Automotive and Electronic) Repair and Maintenance (20-49 employees: 1 establishment)
Administrative and Support and Waste Management and Remediation Services: Other Nonhazardous Waste Treatment and Disposal (10-19: 1)
Professional, Scientific, and Technical Services: Research and Development in the Physical, Engineering, and Life Sciences (5-9: 1, 1-4: 1)
Administrative and Support and Waste Management and Remediation Services: Other Services to Buildings and Dwellings (5-9: 1)
Finance and Insurance: Commercial Banking (5-9: 1)
Home Mortgage Disclosure Act Aggregated Statistics For Year 2009 (Based on 2 partial tracts)
A) FHA, FSA/RHS & VA Home Purchase Loans
B) Conventional Home Purchase Loans
C) Refinancings
D) Home Improvement Loans
E) Loans on Dwellings For 5+ Families
F) Non-occupant Loans on < 5 Family Dwellings (A B C & D)
Number
Average Value
Number
Average Value
Number
Average Value
Number
Average Value
Number
Average Value
Number
Average Value
LOANS ORIGINATED
5
$235,790
12
$201,468
53
$208,013
8
$165,384
1
$311,620
5
$161,520
APPLICATIONS APPROVED, NOT ACCEPTED
0
$0
1
$272,010
5
$182,684
0
$0
0
$0
1
$145,420
APPLICATIONS DENIED
1
$111,660
1
$38,950
8
$228,519
3
$50,203
0
$0
0
$0
APPLICATIONS WITHDRAWN
0
$0
1
$97,380
10
$220,014
0
$0
0
$0
1
$182,430
FILES CLOSED FOR INCOMPLETENESS
0
$0
1
$371,340
2
$139,580
0
$0
0
$0
0
$0
Aggregated Statistics For Year 2008 (Based on 2 partial tracts)
A) FHA, FSA/RHS & VA Home Purchase Loans
B) Conventional Home Purchase Loans
C) Refinancings
D) Home Improvement Loans
E) Loans on Dwellings For 5+ Families
F) Non-occupant Loans on < 5 Family Dwellings (A B C & D)
G) Loans On Manufactured Home Dwelling (A B C & D)
Number
Average Value
Number
Average Value
Number
Average Value
Number
Average Value
Number
Average Value
Number
Average Value
Number
Average Value
LOANS ORIGINATED
1
$346,020
19
$218,678
24
$186,726
8
$70,195
1
$298,630
6
$156,998
1
$62,970
APPLICATIONS APPROVED, NOT ACCEPTED
0
$0
3
$149,750
1
$149,320
0
$0
0
$0
0
$0
1
$58,430
APPLICATIONS DENIED
0
$0
1
$165,550
8
$368,584
4
$22,072
0
$0
1
$1,300
0
$0
APPLICATIONS WITHDRAWN
0
$0
2
$269,745
3
$164,897
0
$0
0
$0
0
$0
0
$0
FILES CLOSED FOR INCOMPLETENESS
0
$0
1
$192,160
0
$0
0
$0
0
$0
0
$0
0
$0
Aggregated Statistics For Year 2007 (Based on 2 partial tracts)
A) FHA, FSA/RHS & VA Home Purchase Loans
B) Conventional Home Purchase Loans
C) Refinancings
D) Home Improvement Loans
F) Non-occupant Loans on < 5 Family Dwellings (A B C & D)
Number
Average Value
Number
Average Value
Number
Average Value
Number
Average Value
Number
Average Value
LOANS ORIGINATED
1
$266,820
23
$215,478
21
$175,593
16
$84,477
3
$147,370
APPLICATIONS APPROVED, NOT ACCEPTED
0
$0
2
$199,630
5
$165,546
2
$42,200
1
$38,950
APPLICATIONS DENIED
1
$149,320
7
$143,659
12
$173,932
6
$66,652
1
$38,950
APPLICATIONS WITHDRAWN
1
$139,580
5
$196,188
6
$205,688
1
$190,220
1
$311,620
FILES CLOSED FOR INCOMPLETENESS
0
$0
0
$0
1
$551,820
1
$44,150
0
$0
Aggregated Statistics For Year 2006 (Based on 2 partial tracts)
A) FHA, FSA/RHS & VA Home Purchase Loans
B) Conventional Home Purchase Loans
C) Refinancings
D) Home Improvement Loans
F) Non-occupant Loans on < 5 Family Dwellings (A B C & D)
Number
Average Value
Number
Average Value
Number
Average Value
Number
Average Value
Number
Average Value
LOANS ORIGINATED
1
$115,560
21
$209,166
38
$153,314
15
$114,822
1
$136,330
APPLICATIONS APPROVED, NOT ACCEPTED
0
$0
3
$150,830
3
$154,510
1
$74,010
0
$0
APPLICATIONS DENIED
0
$0
8
$241,746
18
$222,531
8
$66,868
1
$6,490
APPLICATIONS WITHDRAWN
0
$0
5
$197,356
12
$205,039
1
$64,920
0
$0
FILES CLOSED FOR INCOMPLETENESS
0
$0
2
$136,655
3
$214,670
1
$9,740
0
$0
Aggregated Statistics For Year 2005 (Based on 2 partial tracts)
A) FHA, FSA/RHS & VA Home Purchase Loans
B) Conventional Home Purchase Loans
C) Refinancings
D) Home Improvement Loans
E) Loans on Dwellings For 5+ Families
F) Non-occupant Loans on < 5 Family Dwellings (A B C & D)
G) Loans On Manufactured Home Dwelling (A B C & D)
Number
Average Value
Number
Average Value
Number
Average Value
Number
Average Value
Number
Average Value
Number
Average Value
Number
Average Value
LOANS ORIGINATED
1
$111,010
30
$208,263
35
$165,194
14
$85,555
1
$38,950
6
$159,378
1
$12,980
APPLICATIONS APPROVED, NOT ACCEPTED
0
$0
2
$153,210
4
$179,828
2
$29,865
0
$0
1
$91,540
0
$0
APPLICATIONS DENIED
0
$0
1
$84,400
10
$206,316
2
$61,675
0
$0
1
$3,250
0
$0
APPLICATIONS WITHDRAWN
0
$0
8
$173,499
14
$203,524
2
$417,760
0
$0
2
$273,960
0
$0
FILES CLOSED FOR INCOMPLETENESS
0
$0
4
$164,735
2
$207,745
1
$38,950
0
$0
1
$227,220
0
$0
Aggregated Statistics For Year 2004 (Based on 2 partial tracts)
B) Conventional Home Purchase Loans
C) Refinancings
D) Home Improvement Loans
E) Loans on Dwellings For 5+ Families
F) Non-occupant Loans on < 5 Family Dwellings (A B C & D)
G) Loans On Manufactured Home Dwelling (A B C & D)
Number
Average Value
Number
Average Value
Number
Average Value
Number
Average Value
Number
Average Value
Number
Average Value
LOANS ORIGINATED
19
$214,099
53
$152,305
14
$81,243
1
$255,780
4
$144,935
0
$0
APPLICATIONS APPROVED, NOT ACCEPTED
1
$116,860
5
$145,550
1
$103,870
0
$0
1
$199,950
1
$19,480
APPLICATIONS DENIED
2
$222,025
10
$183,594
3
$38,520
0
$0
1
$650
0
$0
APPLICATIONS WITHDRAWN
3
$186,103
18
$154,798
1
$64,920
0
$0
1
$201,250
0
$0
FILES CLOSED FOR INCOMPLETENESS
0
$0
3
$396,013
0
$0
0
$0
0
$0
0
$0
Aggregated Statistics For Year 2003 (Based on 2 partial tracts)
A) FHA, FSA/RHS & VA Home Purchase Loans
B) Conventional Home Purchase Loans
C) Refinancings
D) Home Improvement Loans
E) Loans on Dwellings For 5+ Families
F) Non-occupant Loans on < 5 Family Dwellings (A B C & D)
Number
Average Value
Number
Average Value
Number
Average Value
Number
Average Value
Number
Average Value
Number
Average Value
LOANS ORIGINATED
1
$94,780
27
$173,745
124
$145,913
3
$37,003
1
$566,750
6
$130,490
APPLICATIONS APPROVED, NOT ACCEPTED
1
$108,420
3
$178,530
9
$167,710
1
$3,250
0
$0
1
$98,680
APPLICATIONS DENIED
0
$0
4
$165,382
12
$166,249
1
$94,130
1
$249,940
0
$0
APPLICATIONS WITHDRAWN
0
$0
3
$109,283
19
$152,118
1
$19,480
0
$0
1
$90,890
FILES CLOSED FOR INCOMPLETENESS
0
$0
0
$0
1
$52,590
0
$0
0
$0
0
$0
Aggregated Statistics For Year 2002 (Based on 2 partial tracts)
A) FHA, FSA/RHS & VA Home Purchase Loans
B) Conventional Home Purchase Loans
C) Refinancings
D) Home Improvement Loans
F) Non-occupant Loans on < 5 Family Dwellings (A B C & D)
Number
Average Value
Number
Average Value
Number
Average Value
Number
Average Value
Number
Average Value
LOANS ORIGINATED
3
$107,767
28
$152,145
65
$134,734
6
$53,450
3
$86,993
APPLICATIONS APPROVED, NOT ACCEPTED
0
$0
3
$136,763
5
$113,870
1
$35,710
1
$103,870
APPLICATIONS DENIED
0
$0
1
$75,310
5
$259,940
2
$65,895
0
$0
APPLICATIONS WITHDRAWN
1
$170,090
5
$165,416
14
$152,701
0
$0
1
$120,100
FILES CLOSED FOR INCOMPLETENESS
0
$0
1
$105,170
1
$144,770
1
$64,920
1
$70,110
Aggregated Statistics For Year 2001 (Based on 2 partial tracts)
A) FHA, FSA/RHS & VA Home Purchase Loans
B) Conventional Home Purchase Loans
C) Refinancings
D) Home Improvement Loans
E) Loans on Dwellings For 5+ Families
F) Non-occupant Loans on < 5 Family Dwellings (A B C & D)
Number
Average Value
Number
Average Value
Number
Average Value
Number
Average Value
Number
Average Value
Number
Average Value
LOANS ORIGINATED
1
$81,800
25
$166,221
52
$123,086
3
$20,127
1
$194,760
3
$77,040
APPLICATIONS APPROVED, NOT ACCEPTED
0
$0
1
$143,470
3
$180,910
0
$0
0
$0
0
$0
APPLICATIONS DENIED
0
$0
2
$192,490
5
$93,096
1
$28,560
0
$0
0
$0
APPLICATIONS WITHDRAWN
0
$0
2
$159,055
5
$148,666
1
$16,230
0
$0
0
$0
FILES CLOSED FOR INCOMPLETENESS
0
$0
0
$0
1
$153,210
0
$0
0
$0
0
$0
Aggregated Statistics For Year 2000 (Based on 2 partial tracts)
A) FHA, FSA/RHS & VA Home Purchase Loans
B) Conventional Home Purchase Loans
C) Refinancings
D) Home Improvement Loans
E) Loans on Dwellings For 5+ Families
F) Non-occupant Loans on < 5 Family Dwellings (A B C & D)
Number
Average Value
Number
Average Value
Number
Average Value
Number
Average Value
Number
Average Value
Number
Average Value
LOANS ORIGINATED
3
$154,510
26
$139,328
15
$88,075
3
$9,090
1
$103,870
2
$140,875
APPLICATIONS APPROVED, NOT ACCEPTED
0
$0
2
$209,040
2
$67,840
0
$0
0
$0
0
$0
APPLICATIONS DENIED
0
$0
1
$98,680
6
$88,615
0
$0
0
$0
0
$0
APPLICATIONS WITHDRAWN
0
$0
4
$177,718
5
$99,588
0
$0
0
$0
0
$0
FILES CLOSED FOR INCOMPLETENESS
0
$0
0
$0
1
$153,860
0
$0
0
$0
0
$0
Aggregated Statistics For Year 1999 (Based on 1 partial tract)
A) FHA, FSA/RHS & VA Home Purchase Loans
B) Conventional Home Purchase Loans
C) Refinancings
D) Home Improvement Loans
E) Loans on Dwellings For 5+ Families
F) Non-occupant Loans on < 5 Family Dwellings (A B C & D)


 Nearest zip codes: 01066, 01038, 01093, 01039, 01060, 01063.


