Work and Jobs in Smith Valley, Nevada (NV) Detailed Stats
Occupations, Industries, Unemployment, Workers, Commute
Settings
X


Recent posts about work in Smith Valley, Nevada on our local forum with over 2,400,000 registered users:
 | Move To Carson City? (95 replies) |
| Nevada here we come! (46 replies) |
| Quietest Places in NV...Least Man-Made Noise? (22 replies) |
| looking for small town tell me about winnemucca (26 replies) |
| want info about rural areas north, south and east of reno (14 replies) |
| Where to Retire in Northern Nevada? (5 replies) |
The most common industries in Smith Valley are: Agriculture, forestry, fishing & hunting (31.7% of civilian employees), Construction (9.0% of civilian employees), Educational services (8.7% of civilian employees). 86.1% of workers work in Lyon County and 25.5% of all workers work at home. 52.5% of workers are employees of private companies, which is 41.5% less than the rate of 74.4% across the entire state of Nevada.
Whole page based on the data from 2000 / 2022 when the population of Smith Valley, Nevada was 1,425 / 1,685
Whole page based on the data from 2000 / 2022 when the population of Smith Valley, Nevada was 1,425 / 1,685
Most common industries


Most common industries | |||
|---|---|---|---|
Industry | All | Males | Females |
| Agriculture, forestry, fishing and hunting | 31.7% (254) | 43.6% (211) | 13.5% (43) |
| Construction | 9.0% (72) | 13.8% (67) | 1.6% (5) |
| Educational services | 8.7% (70) | 3.7% (18) | 16.4% (52) |
| Health care | 5.5% (44) | 1.0% (5) | 12.3% (39) |
| Food and beverage stores | 4.6% (37) | 4.3% (21) | 5.0% (16) |
| Public administration | 4.5% (36) | 6.2% (30) | 1.9% (6) |
| Professional, scientific, and technical services | 4.1% (33) | 2.1% (10) | 7.2% (23) |
| Accommodation and food services | 3.7% (30) | 1.2% (6) | 7.5% (24) |
| Arts, entertainment, and recreation | 2.9% (23) | 2.9% (14) | 2.8% (9) |
| Building material and garden equipment and supplies dealers | 2.5% (20) | 1.2% (6) | 4.4% (14) |
| Social assistance | 2.5% (20) | 4.1% (20) | 0.0% (0) |
| Personal and laundry services | 2.2% (18) | 0.0% (0) | 5.7% (18) |
| Real estate and rental and leasing | 2.1% (17) | 1.2% (6) | 3.5% (11) |
| Finance and insurance | 2.0% (16) | 0.0% (0) | 5.0% (16) |
| Machinery, equipment, and supplies merchant wholesalers | 1.7% (14) | 2.9% (14) | 0.0% (0) |
| Mining, quarrying, and oil and gas extraction | 1.5% (12) | 2.5% (12) | 0.0% (0) |
| Gasoline stations | 1.5% (12) | 0.0% (0) | 3.8% (12) |
| Other transportation, and support activities, and couriers | 1.4% (11) | 2.3% (11) | 0.0% (0) |
| Farm supplies merchant wholesalers | 1.1% (9) | 0.0% (0) | 2.8% (9) |
| Used merchandise, gift, novelty, and souvenir, and other miscellaneous stores | 1.1% (9) | 0.0% (0) | 2.8% (9) |
| Broadcasting and telecommunications | 1.0% (8) | 1.7% (8) | 0.0% (0) |
| Religious, grantmaking, civic, professional, and similar organizations | 1.0% (8) | 1.7% (8) | 0.0% (0) |
| Repair and maintenance | 0.9% (7) | 1.4% (7) | 0.0% (0) |
| Private households | 0.9% (7) | 0.0% (0) | 2.2% (7) |
| Truck transportation | 0.6% (5) | 1.0% (5) | 0.0% (0) |
| Utilities | 0.6% (5) | 1.0% (5) | 0.0% (0) |
| Publishing, and motion picture and sound recording industries | 0.6% (5) | 0.0% (0) | 1.6% (5) |
Unemployment in Smith Valley
- Unemployment by race in 2022
- Unemployment rate for White non-Hispanic residents
- 2.0%Males
- Unemployment by race in 2000
- Unemployment rate for White non-Hispanic residents
- 2.9%Males
- 2.9%Females
Time leaving home to go to work

5:30 a.m. to 5:59 a.m.:
| Smith Valley: | 31.2% (132) |
| Nevada: | 5.2% (68,969) |
6:00 a.m. to 6:29 a.m.:
| Smith Valley: | 16.1% (68) |
| Nevada: | 9.2% (121,574) |
6:30 a.m. to 6:59 a.m.:
| Smith Valley: | 3.8% (16) |
| Nevada: | 8.2% (109,074) |
7:00 a.m. to 7:29 a.m.:
| Smith Valley: | 12.8% (54) |
| Nevada: | 11.7% (154,960) |
7:30 a.m. to 7:59 a.m.:
| Smith Valley: | 18.4% (78) |
| Nevada: | 8.9% (118,057) |
10:00 a.m. to 10:59 a.m.:
| Smith Valley: | 17.0% (72) |
| Nevada: | 3.9% (51,627) |
4:00 p.m. to 11:59 p.m.:
| Smith Valley: | 3.6% (15) |
| Nevada: | 9.5% (125,734) |

<5am:
| Smith Valley: | 1.8% (14) |
| Nevada: | 5.4% (49,950) |
5:30am:
| Smith Valley: | 2.8% (22) |
| Nevada: | 3.9% (35,924) |
6am:
| Smith Valley: | 2.9% (23) |
| Nevada: | 5.1% (47,324) |
6:30am:
| Smith Valley: | 15.3% (121) |
| Nevada: | 8.6% (79,614) |
7am:
| Smith Valley: | 11.5% (91) |
| Nevada: | 9.1% (84,251) |
7:30am:
| Smith Valley: | 23.6% (187) |
| Nevada: | 12.7% (117,088) |
8am:
| Smith Valley: | 11.9% (94) |
| Nevada: | 12.3% (113,773) |
8:30am:
| Smith Valley: | 5.7% (45) |
| Nevada: | 8.2% (75,666) |
9am:
| Smith Valley: | 1.8% (14) |
| Nevada: | 4.2% (38,916) |
10am:
| Smith Valley: | 0.4% (3) |
| Nevada: | 5.3% (48,591) |
11am:
| Smith Valley: | 1.4% (11) |
| Nevada: | 2.6% (23,932) |
4pm:
| Smith Valley: | 3.8% (30) |
| Nevada: | 9.0% (83,088) |
>4pm:
| Smith Valley: | 7.2% (57) |
| Nevada: | 9.3% (86,164) |

5:30 a.m. to 5:59 a.m. - Males:
| Smith Valley: | 24.1% (57) |
| Nevada: | 6.4% (46,554) |
6:00 a.m. to 6:29 a.m. - Males:
| Smith Valley: | 28.6% (67) |
| Nevada: | 10.0% (72,955) |
7:00 a.m. to 7:29 a.m. - Males:
| Smith Valley: | 13.5% (32) |
| Nevada: | 10.8% (78,787) |
7:30 a.m. to 7:59 a.m. - Males:
| Smith Valley: | 34.3% (81) |
| Nevada: | 7.5% (54,841) |

5:30 a.m. to 5:59 a.m. - Females:
| Smith Valley: | 40.8% (77) |
| Nevada: | 3.8% (22,415) |
6:30 a.m. to 6:59 a.m. - Females:
| Smith Valley: | 9.0% (17) |
| Nevada: | 8.8% (51,996) |
7:00 a.m. to 7:29 a.m. - Females:
| Smith Valley: | 12.0% (22) |
| Nevada: | 12.8% (76,173) |
10:00 a.m. to 10:59 a.m. - Females:
| Smith Valley: | 42.2% (79) |
| Nevada: | 5.1% (30,036) |
4:00 p.m. to 11:59 p.m. - Females:
| Smith Valley: | 7.4% (14) |
| Nevada: | 8.3% (49,070) |
Travel time to work
Percentage of workers working in this county: 86.1%
Number of people working at home: 150 (25.5% of all workers)
Number of people working at home: 150 (25.5% of all workers)


Less than 5 minutes:
| Smith Valley: | 10.4% (82) |
| Nevada: | 2.7% (24,637) |
5 to 9 minutes:
| Smith Valley: | 16.6% (131) |
| Nevada: | 9.6% (88,626) |
10 to 14 minutes:
| Smith Valley: | 7.0% (55) |
| Nevada: | 14.9% (137,121) |
15 to 19 minutes:
| Smith Valley: | 6.8% (54) |
| Nevada: | 17.9% (165,652) |
20 to 24 minutes:
| Smith Valley: | 3.5% (28) |
| Nevada: | 18.3% (169,033) |
25 to 29 minutes:
| Smith Valley: | 0.9% (7) |
| Nevada: | 6.7% (62,292) |
30 to 34 minutes:
| Smith Valley: | 13.3% (105) |
| Nevada: | 14.0% (129,026) |
35 to 39 minutes:
| Smith Valley: | 1.5% (12) |
| Nevada: | 1.8% (17,061) |
40 to 44 minutes:
| Smith Valley: | 7.0% (55) |
| Nevada: | 2.1% (19,732) |
45 to 59 minutes:
| Smith Valley: | 10.4% (82) |
| Nevada: | 4.0% (37,254) |
60 to 89 minutes:
| Smith Valley: | 8.7% (69) |
| Nevada: | 3.1% (28,357) |
90 or more minutes:
| Smith Valley: | 4.0% (32) |
| Nevada: | 2.2% (20,487) |
Means of transportation to work

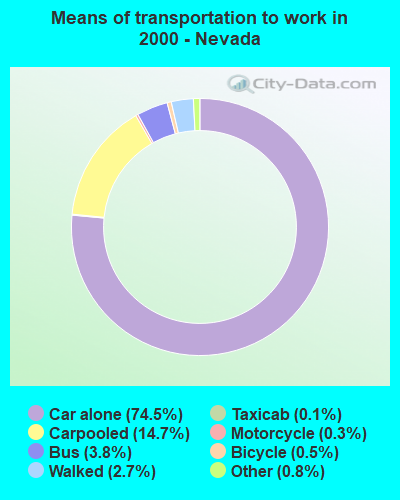
Drove car alone:
| Smith Valley: | 60.8% (481) |
| Nevada: | 74.5% (687,368) |
Carpooled:
| Smith Valley: | 19.8% (157) |
| Nevada: | 14.7% (135,874) |
Ferryboat:
| Smith Valley: | 1.0% (8) |
| Nevada: | 0.0% (42) |
Walked:
| Smith Valley: | 8.3% (66) |
| Nevada: | 2.7% (24,875) |
Private vehicle occupancy

Drove alone:
| Smith Valley: | 96.3% (406) |
| Nevada: | 86.2% (1,053,747) |
In 2 person carpool:
| Smith Valley: | 2.5% (10) |
| Nevada: | 9.8% (119,603) |

Drove alone:
| Smith Valley: | 75.4% (481) |
| Nevada: | 83.5% (687,368) |
In 2 person carpool:
| Smith Valley: | 11.4% (73) |
| Nevada: | 13.1% (108,073) |
In 3 person carpool:
| Smith Valley: | 12.1% (77) |
| Nevada: | 2.1% (17,292) |
In 4 person carpool:
| Smith Valley: | 1.1% (7) |
| Nevada: | 0.8% (6,404) |
Class of workers

Employee of private company:
| Smith Valley: | 52.5% (313) |
| Nevada: | 74.4% (1,134,089) |
Self-employed in own incorporated business:
| Smith Valley: | 17.9% (107) |
| Nevada: | 3.9% (58,842) |
Local government workers:
| Smith Valley: | 12.0% (71) |
| Nevada: | 6.6% (100,544) |
State government workers:
| Smith Valley: | 5.4% (32) |
| Nevada: | 3.0% (45,694) |
Federal government workers:
| Smith Valley: | 1.6% (9) |
| Nevada: | 2.2% (33,013) |
Self-employed workers in own not incorporated business:
| Smith Valley: | 10.5% (63) |
| Nevada: | 5.4% (82,796) |

Employee of private company:
| Smith Valley: | 57.2% (459) |
| Nevada: | 76.8% (716,774) |
Self-employed in own incorporated business:
| Smith Valley: | 6.1% (49) |
| Nevada: | 2.8% (26,180) |
Private not-for-profit wage and salary workers:
| Smith Valley: | 5.9% (47) |
| Nevada: | 2.8% (26,101) |
Local government workers:
| Smith Valley: | 12.5% (100) |
| Nevada: | 7.0% (65,211) |
State government workers:
| Smith Valley: | 1.6% (13) |
| Nevada: | 3.2% (30,014) |
Federal government workers:
| Smith Valley: | 0.7% (6) |
| Nevada: | 2.3% (21,071) |
Self-employed workers in own not incorporated business:
| Smith Valley: | 14.0% (112) |
| Nevada: | 4.9% (45,578) |
Unpaid family workers:
| Smith Valley: | 2.0% (16) |
| Nevada: | 0.3% (2,351) |

Employee of private company - Males:
| Smith Valley: | 54.8% (144) |
| Nevada: | 76.7% (628,875) |
Self-employed in own incorporated business - Males:
| Smith Valley: | 40.5% (107) |
| Nevada: | 4.6% (37,601) |
Self-employed workers in own not incorporated business - Males:
| Smith Valley: | 4.8% (13) |
| Nevada: | 5.5% (45,353) |

Employee of private company - Females:
| Smith Valley: | 50.8% (169) |
| Nevada: | 71.7% (505,214) |
Local government workers - Females:
| Smith Valley: | 21.5% (71) |
| Nevada: | 8.2% (57,773) |
State government workers - Females:
| Smith Valley: | 9.8% (32) |
| Nevada: | 3.5% (24,505) |
Federal government workers - Females:
| Smith Valley: | 2.8% (9) |
| Nevada: | 2.1% (15,092) |
Self-employed workers in own not incorporated business - Females:
| Smith Valley: | 15.1% (50) |
| Nevada: | 5.3% (37,443) |