Work and Jobs in San Juan, Texas (TX) Detailed Stats
Occupations, Industries, Unemployment, Workers, Commute
Settings
X


Recent posts about work in San Juan, Texas on our local forum with over 2,400,000 registered users:

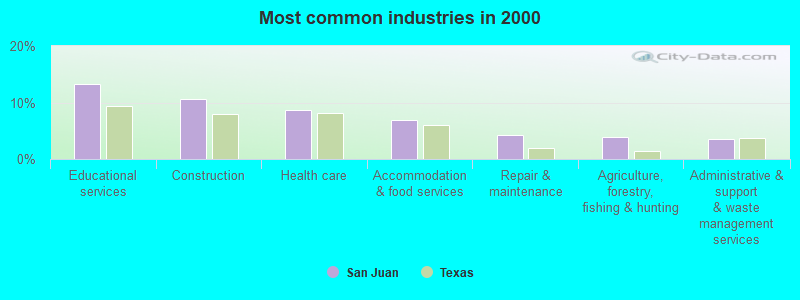
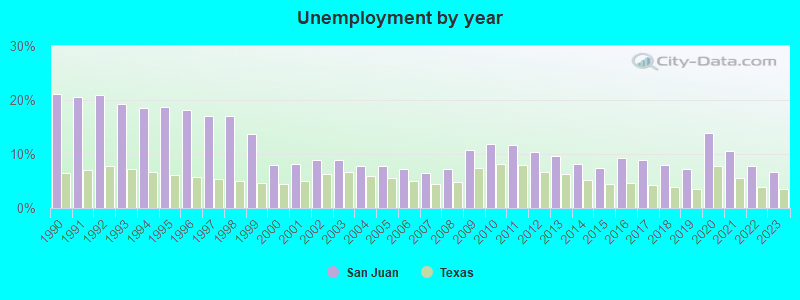
The unemployment rate in 2023 in San Juan, TX was 6.6%, which was 47.0% greater than the unemployment rate of 3.5% across the entire state of Texas. Compared to the unemployment rate of 9.7% in 2013, this represents a decrease of 47.0%. The most common industries in San Juan are: Educational services (13.3% of civilian employees), Construction (10.5% of civilian employees), Health care (8.6% of civilian employees). 90.8% of workers work in Hidalgo County and 5.0% of all workers work at home. 70.1% of workers are employees of private companies, which is about the same as the rate of 69.6% across the entire state of Texas.
Whole page based on the data from 2000 / 2022 when the population of San Juan, Texas was 26,229 / 36,080
Whole page based on the data from 2000 / 2022 when the population of San Juan, Texas was 26,229 / 36,080
Most common industries
Most common industries | |||
|---|---|---|---|
Industry | All | Males | Females |
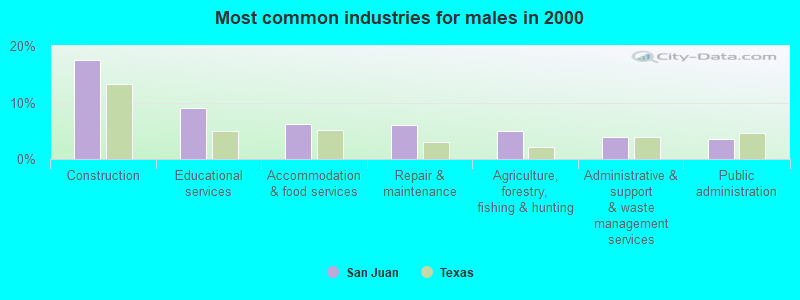
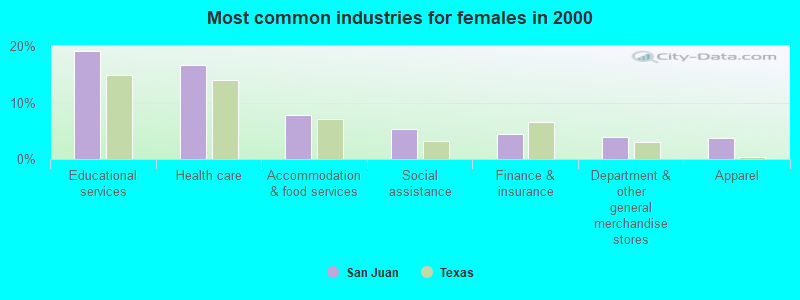
| Educational services | 13.3% (1,071) | 9.0% (418) | 19.2% (653) |
| Construction | 10.5% (847) | 17.6% (813) | 1.0% (34) |
| Health care | 8.6% (692) | 2.7% (126) | 16.6% (566) |
| Accommodation and food services | 6.8% (550) | 6.1% (284) | 7.8% (266) |
| Repair and maintenance | 4.3% (342) | 5.9% (275) | 2.0% (67) |
| Agriculture, forestry, fishing and hunting | 3.8% (306) | 5.0% (231) | 2.2% (75) |
| Administrative and support and waste management services | 3.6% (286) | 4.0% (183) | 3.0% (103) |
| Public administration | 3.1% (251) | 3.5% (163) | 2.6% (88) |
| Department and other general merchandise stores | 3.1% (247) | 2.5% (117) | 3.8% (130) |
| Finance and insurance | 2.9% (232) | 1.7% (80) | 4.5% (152) |
| Food and beverage stores | 2.7% (218) | 2.7% (125) | 2.7% (93) |
| Social assistance | 2.5% (198) | 0.4% (17) | 5.3% (181) |
| Other transportation, and support activities, and couriers | 1.8% (144) | 2.3% (105) | 1.1% (39) |
| Truck transportation | 1.8% (143) | 2.9% (135) | 0.2% (8) |
| Groceries and related products merchant wholesalers | 1.7% (139) | 1.6% (74) | 1.9% (65) |
| Professional, scientific, and technical services | 1.6% (131) | 1.2% (55) | 2.2% (76) |
| Motor vehicle and parts dealers | 1.6% (128) | 2.4% (109) | 0.6% (19) |
| Apparel | 1.6% (126) | 0.0% (0) | 3.7% (126) |
| Arts, entertainment, and recreation | 1.1% (92) | 1.4% (65) | 0.8% (27) |
| Mining, quarrying, and oil and gas extraction | 1.1% (87) | 1.9% (87) | 0.0% (0) |
| Miscellaneous nondurable goods merchant wholesalers | 1.1% (85) | 1.2% (54) | 0.9% (31) |
| Furniture and home furnishings, and household appliance stores | 1.0% (80) | 1.5% (71) | 0.3% (9) |
| Real estate and rental and leasing | 0.9% (70) | 0.6% (30) | 1.2% (40) |
| Used merchandise, gift, novelty, and souvenir, and other miscellaneous stores | 0.9% (70) | 1.3% (61) | 0.3% (9) |
| U. S. Postal service | 0.8% (65) | 0.8% (39) | 0.8% (26) |
| Furniture and related product manufacturing | 0.8% (64) | 1.4% (64) | 0.0% (0) |
| Religious, grantmaking, civic, professional, and similar organizations | 0.8% (63) | 0.5% (21) | 1.2% (42) |
| Utilities | 0.8% (62) | 1.3% (62) | 0.0% (0) |
| Building material and garden equipment and supplies dealers | 0.8% (61) | 1.1% (50) | 0.3% (11) |
| Private households | 0.7% (56) | 0.0% (0) | 1.6% (56) |
| Machinery | 0.7% (55) | 0.9% (43) | 0.4% (12) |
| Broadcasting and telecommunications | 0.6% (49) | 0.4% (18) | 0.9% (31) |
| Clothing and accessories, including shoe, stores | 0.6% (49) | 0.8% (37) | 0.4% (12) |
| Metal and metal products | 0.6% (48) | 0.8% (37) | 0.3% (11) |
| Warehousing and storage | 0.6% (48) | 0.8% (35) | 0.4% (13) |
| Professional and commercial equipment and supplies merchant wholesalers | 0.6% (47) | 1.0% (47) | 0.0% (0) |
| Radio, TV, and computer stores | 0.6% (45) | 0.7% (31) | 0.4% (14) |
| Miscellaneous manufacturing | 0.5% (44) | 0.5% (22) | 0.6% (22) |
| Personal and laundry services | 0.5% (41) | 0.9% (41) | 0.0% (0) |
| Plastics and rubber products | 0.5% (39) | 0.3% (14) | 0.7% (25) |
| Machinery, equipment, and supplies merchant wholesalers | 0.5% (37) | 0.6% (27) | 0.3% (10) |
| Publishing, and motion picture and sound recording industries | 0.5% (37) | 0.5% (25) | 0.4% (12) |
| Food | 0.4% (36) | 0.5% (23) | 0.4% (13) |
| Printing and related support activities | 0.4% (35) | 0.5% (24) | 0.3% (11) |
| Data processing, libraries, and other information services | 0.4% (35) | 0.0% (0) | 1.0% (35) |
| Computer and electronic products | 0.4% (34) | 0.4% (18) | 0.5% (16) |
| Wood products | 0.4% (31) | 0.7% (31) | 0.0% (0) |
| Paper | 0.4% (30) | 0.4% (20) | 0.3% (10) |
| Retail florists | 0.3% (28) | 0.1% (5) | 0.7% (23) |
| Nonmetallic mineral products | 0.3% (26) | 0.6% (26) | 0.0% (0) |
| Beverage and tobacco products | 0.3% (23) | 0.5% (23) | 0.0% (0) |
| Textile mills and textile products | 0.3% (23) | 0.0% (0) | 0.7% (23) |
| Health and personal care, except drug, stores | 0.3% (23) | 0.0% (0) | 0.7% (23) |
| Pharmacies and drug stores | 0.3% (21) | 0.2% (9) | 0.4% (12) |
| Transportation equipment | 0.2% (20) | 0.2% (9) | 0.3% (11) |
| Lumber and other construction materials merchant wholesalers | 0.2% (19) | 0.4% (19) | 0.0% (0) |
| Recyclable material merchant wholesalers | 0.2% (18) | 0.2% (8) | 0.3% (10) |
| Other direct selling establishments | 0.2% (18) | 0.2% (9) | 0.3% (9) |
| Jewelry, luggage, and leather goods stores | 0.2% (16) | 0.2% (9) | 0.2% (7) |
| Apparel, fabrics, and notions merchant wholesalers | 0.2% (16) | 0.2% (7) | 0.3% (9) |
| Farm supplies merchant wholesalers | 0.2% (15) | 0.0% (0) | 0.4% (15) |
| Electronic shopping and mail-order houses | 0.2% (13) | 0.3% (13) | 0.0% (0) |
| Sporting goods, camera, and hobby and toy stores | 0.1% (12) | 0.3% (12) | 0.0% (0) |
| Miscellaneous durable goods merchant wholesalers | 0.1% (12) | 0.3% (12) | 0.0% (0) |
| Hardware, plumbing and heating equipment, and supplies merchant wholesalers | 0.1% (12) | 0.3% (12) | 0.0% (0) |
| Motor vehicles, parts and supplies merchant wholesalers | 0.1% (11) | 0.2% (11) | 0.0% (0) |
| Office supplies and stationery stores | 0.1% (10) | 0.0% (0) | 0.3% (10) |
| Air transportation | 0.1% (10) | 0.0% (0) | 0.3% (10) |
| Gasoline stations | 0.1% (10) | 0.2% (10) | 0.0% (0) |
| Chemicals | 0.1% (10) | 0.2% (10) | 0.0% (0) |
| Electrical equipment, appliances, and components | 0.1% (9) | 0.2% (9) | 0.0% (0) |
| Electrical and electronic goods merchant wholesalers | 0.1% (7) | 0.2% (7) | 0.0% (0) |
Unemployment in San Juan
- Unemployment by race in 2022
- Unemployment rate for White non-Hispanic residents
- 42.2%Females
- Unemployment rate for other race residents
- 24.4%Males
- 3.0%Females
- Unemployment rate for two or more race residents
- 3.9%Males
- 3.8%Females
- Unemployment rate for Hispanic or Latino residents
- 7.8%Males
- 4.0%Females
- Unemployment by race in 2000
- Unemployment rate for White non-Hispanic residents
- 20.7%Males
- 12.7%Females
- Unemployment rate for other race residents
- 14.1%Males
- 11.5%Females
- Unemployment rate for two or more race residents
- 25.5%Females
- Unemployment rate for Hispanic or Latino residents
- 8.8%Males
- 11.3%Females
Unemployment in 2023:
| San Juan: | 6.6% |
| Texas: | 3.5% |
Unemployment in 2022:
| San Juan: | 7.7% |
| Texas: | 3.9% |
Unemployment in 2021:
| San Juan: | 10.6% |
| Texas: | 5.6% |
Unemployment in 2020:
| San Juan: | 13.8% |
| Texas: | 7.7% |
Unemployment in 2019:
| San Juan: | 7.3% |
| Texas: | 3.5% |
Unemployment in 2018:
| San Juan: | 7.9% |
| Texas: | 3.9% |
Unemployment in 2017:
| San Juan: | 8.8% |
| Texas: | 4.3% |
Unemployment in 2016:
| San Juan: | 9.2% |
| Texas: | 4.6% |
Unemployment in 2015:
| San Juan: | 7.4% |
| Texas: | 4.5% |
Unemployment in 2014:
| San Juan: | 8.1% |
| Texas: | 5.2% |
Unemployment in 2013:
| San Juan: | 9.7% |
| Texas: | 6.3% |
Unemployment in 2012:
| San Juan: | 10.4% |
| Texas: | 6.7% |
Unemployment in 2011:
| San Juan: | 11.6% |
| Texas: | 8.0% |
Unemployment in 2010:
| San Juan: | 11.9% |
| Texas: | 8.2% |
Unemployment in 2009:
| San Juan: | 10.8% |
| Texas: | 7.5% |
Unemployment in 2008:
| San Juan: | 7.3% |
| Texas: | 4.9% |
Unemployment in 2007:
| San Juan: | 6.4% |
| Texas: | 4.4% |
Unemployment in 2006:
| San Juan: | 7.2% |
| Texas: | 5.0% |
Unemployment in 2005:
| San Juan: | 7.7% |
| Texas: | 5.5% |
Unemployment in 2004:
| San Juan: | 7.7% |
| Texas: | 6.0% |
Unemployment in 2003:
| San Juan: | 8.9% |
| Texas: | 6.7% |
Unemployment in 2002:
| San Juan: | 8.9% |
| Texas: | 6.3% |
Unemployment in 2001:
| San Juan: | 8.2% |
| Texas: | 5.0% |
Unemployment in 2000:
| San Juan: | 7.9% |
| Texas: | 4.4% |
Unemployment in 1999:
| San Juan: | 13.7% |
| Texas: | 4.7% |
Unemployment in 1998:
| San Juan: | 17.0% |
| Texas: | 5.0% |
Unemployment in 1997:
| San Juan: | 17.0% |
| Texas: | 5.4% |
Unemployment in 1996:
| San Juan: | 18.1% |
| Texas: | 5.8% |
Unemployment in 1995:
| San Juan: | 18.7% |
| Texas: | 6.1% |
Unemployment in 1994:
| San Juan: | 18.6% |
| Texas: | 6.6% |
Unemployment in 1993:
| San Juan: | 19.3% |
| Texas: | 7.2% |
Unemployment in 1992:
| San Juan: | 21.0% |
| Texas: | 7.7% |
Unemployment in 1991:
| San Juan: | 20.5% |
| Texas: | 7.0% |
Unemployment in 1990:
| San Juan: | 21.1% |
| Texas: | 6.4% |
Time leaving home to go to work

12:00 a.m. to 4:59 a.m.:
| San Juan: | 5.7% (803) |
| Texas: | 5.5% (678,264) |
5:00 a.m. to 5:29 a.m.:
| San Juan: | 0.9% (124) |
| Texas: | 4.3% (525,841) |
5:30 a.m. to 5:59 a.m.:
| San Juan: | 3.8% (529) |
| Texas: | 4.9% (603,953) |
6:00 a.m. to 6:29 a.m.:
| San Juan: | 5.3% (745) |
| Texas: | 9.4% (1,155,020) |
6:30 a.m. to 6:59 a.m.:
| San Juan: | 4.2% (595) |
| Texas: | 9.3% (1,152,822) |
7:00 a.m. to 7:29 a.m.:
| San Juan: | 17.2% (2,405) |
| Texas: | 15.3% (1,885,477) |
7:30 a.m. to 7:59 a.m.:
| San Juan: | 15.1% (2,115) |
| Texas: | 11.9% (1,469,628) |
8:00 a.m. to 8:29 a.m.:
| San Juan: | 17.4% (2,435) |
| Texas: | 11.3% (1,400,175) |
8:30 a.m. to 8:59 a.m.:
| San Juan: | 4.2% (587) |
| Texas: | 4.9% (599,574) |
9:00 a.m. to 9:59 a.m.:
| San Juan: | 6.4% (892) |
| Texas: | 6.7% (829,367) |
10:00 a.m. to 10:59 a.m.:
| San Juan: | 2.8% (389) |
| Texas: | 3.2% (390,354) |
11:00 a.m. to 11:59 a.m.:
| San Juan: | 1.2% (167) |
| Texas: | 1.3% (162,330) |
12:00 p.m. to 3:59 p.m.:
| San Juan: | 6.9% (971) |
| Texas: | 5.8% (720,594) |
4:00 p.m. to 11:59 p.m.:
| San Juan: | 8.7% (1,221) |
| Texas: | 6.3% (777,072) |

<5am:
| San Juan: | 3.4% (261) |
| Texas: | 3.1% (281,361) |
5:30am:
| San Juan: | 2.5% (192) |
| Texas: | 2.9% (262,060) |
6am:
| San Juan: | 2.5% (196) |
| Texas: | 4.4% (403,423) |
6:30am:
| San Juan: | 7.7% (594) |
| Texas: | 8.8% (808,876) |
7am:
| San Juan: | 8.8% (683) |
| Texas: | 10.7% (976,557) |
7:30am:
| San Juan: | 15.6% (1,206) |
| Texas: | 16.4% (1,500,904) |
8am:
| San Juan: | 17.8% (1,377) |
| Texas: | 16.8% (1,536,308) |
8:30am:
| San Juan: | 14.1% (1,088) |
| Texas: | 10.0% (913,601) |
9am:
| San Juan: | 4.3% (331) |
| Texas: | 4.4% (398,656) |
10am:
| San Juan: | 6.8% (528) |
| Texas: | 5.2% (472,592) |
11am:
| San Juan: | 2.1% (166) |
| Texas: | 2.2% (197,844) |
12pm:
| San Juan: | 0.4% (34) |
| Texas: | 0.9% (86,997) |
4pm:
| San Juan: | 4.9% (378) |
| Texas: | 5.5% (503,565) |
>4pm:
| San Juan: | 7.4% (571) |
| Texas: | 6.1% (563,107) |

12:00 a.m. to 4:59 a.m. - Males:
| San Juan: | 6.1% (486) |
| Texas: | 7.0% (477,284) |
5:00 a.m. to 5:29 a.m. - Males:
| San Juan: | 1.4% (113) |
| Texas: | 5.8% (394,876) |
5:30 a.m. to 5:59 a.m. - Males:
| San Juan: | 4.9% (391) |
| Texas: | 5.9% (402,788) |
6:00 a.m. to 6:29 a.m. - Males:
| San Juan: | 6.3% (503) |
| Texas: | 10.9% (751,118) |
6:30 a.m. to 6:59 a.m. - Males:
| San Juan: | 6.4% (509) |
| Texas: | 9.5% (652,306) |
7:00 a.m. to 7:29 a.m. - Males:
| San Juan: | 17.7% (1,419) |
| Texas: | 14.1% (970,598) |
7:30 a.m. to 7:59 a.m. - Males:
| San Juan: | 12.2% (980) |
| Texas: | 10.2% (696,429) |
8:00 a.m. to 8:29 a.m. - Males:
| San Juan: | 14.6% (1,172) |
| Texas: | 10.6% (729,041) |
8:30 a.m. to 8:59 a.m. - Males:
| San Juan: | 2.5% (200) |
| Texas: | 4.1% (281,762) |
9:00 a.m. to 9:59 a.m. - Males:
| San Juan: | 6.2% (498) |
| Texas: | 5.8% (401,071) |
10:00 a.m. to 10:59 a.m. - Males:
| San Juan: | 2.6% (205) |
| Texas: | 2.7% (186,469) |
11:00 a.m. to 11:59 a.m. - Males:
| San Juan: | 1.8% (145) |
| Texas: | 1.2% (82,242) |
12:00 p.m. to 3:59 p.m. - Males:
| San Juan: | 6.6% (530) |
| Texas: | 5.8% (397,795) |
4:00 p.m. to 11:59 p.m. - Males:
| San Juan: | 9.0% (717) |
| Texas: | 6.4% (435,950) |

12:00 a.m. to 4:59 a.m. - Females:
| San Juan: | 5.3% (318) |
| Texas: | 3.7% (200,980) |
5:00 a.m. to 5:29 a.m. - Females:
| San Juan: | 0.2% (13) |
| Texas: | 2.4% (130,965) |
5:30 a.m. to 5:59 a.m. - Females:
| San Juan: | 2.3% (138) |
| Texas: | 3.7% (201,165) |
6:00 a.m. to 6:29 a.m. - Females:
| San Juan: | 3.9% (233) |
| Texas: | 7.4% (403,902) |
6:30 a.m. to 6:59 a.m. - Females:
| San Juan: | 2.0% (118) |
| Texas: | 9.1% (500,516) |
7:00 a.m. to 7:29 a.m. - Females:
| San Juan: | 16.0% (957) |
| Texas: | 16.7% (914,879) |
7:30 a.m. to 7:59 a.m. - Females:
| San Juan: | 19.0% (1,138) |
| Texas: | 14.1% (773,199) |
8:00 a.m. to 8:29 a.m. - Females:
| San Juan: | 21.4% (1,282) |
| Texas: | 12.2% (671,134) |
8:30 a.m. to 8:59 a.m. - Females:
| San Juan: | 6.6% (395) |
| Texas: | 5.8% (317,812) |
9:00 a.m. to 9:59 a.m. - Females:
| San Juan: | 6.4% (381) |
| Texas: | 7.8% (428,296) |
10:00 a.m. to 10:59 a.m. - Females:
| San Juan: | 3.1% (183) |
| Texas: | 3.7% (203,885) |
11:00 a.m. to 11:59 a.m. - Females:
| San Juan: | 0.5% (28) |
| Texas: | 1.5% (80,088) |
12:00 p.m. to 3:59 p.m. - Females:
| San Juan: | 7.4% (441) |
| Texas: | 5.9% (322,799) |
4:00 p.m. to 11:59 p.m. - Females:
| San Juan: | 8.4% (505) |
| Texas: | 6.2% (341,122) |
Travel time to work
Percentage of workers working in this county: 90.8%
Number of people working at home: 739 (5.0% of all workers)
Daytime population change due to commuting: -4,017 (-15.3%)
Workers who live and work in this city: 1,240 (16.0%)
Number of people working at home: 739 (5.0% of all workers)
Daytime population change due to commuting: -4,017 (-15.3%)
Workers who live and work in this city: 1,240 (16.0%)

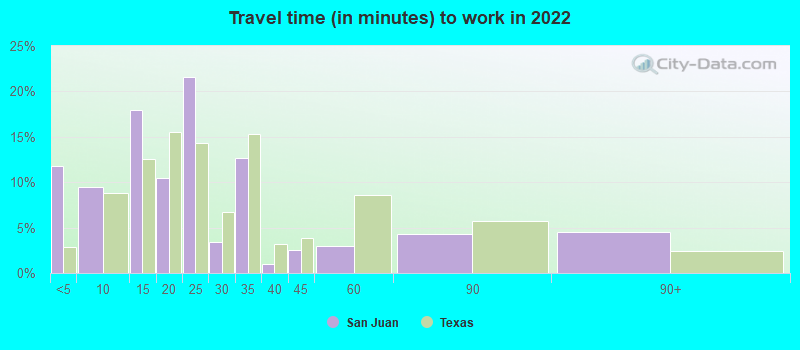

Less than 5 minutes:
| San Juan: | 11.8% (792) |
| Texas: | 2.8% (350,462) |
5 to 9 minutes:
| San Juan: | 9.5% (638) |
| Texas: | 8.8% (1,087,762) |
10 to 14 minutes:
| San Juan: | 18.0% (1,209) |
| Texas: | 12.6% (1,550,271) |
15 to 19 minutes:
| San Juan: | 10.5% (707) |
| Texas: | 15.6% (1,918,353) |
20 to 24 minutes:
| San Juan: | 21.6% (1,457) |
| Texas: | 14.4% (1,772,079) |
25 to 29 minutes:
| San Juan: | 3.4% (228) |
| Texas: | 6.7% (827,833) |
30 to 34 minutes:
| San Juan: | 12.7% (857) |
| Texas: | 15.3% (1,887,878) |
35 to 39 minutes:
| San Juan: | 1.0% (67) |
| Texas: | 3.2% (394,170) |
40 to 44 minutes:
| San Juan: | 2.5% (172) |
| Texas: | 3.9% (476,118) |
45 to 59 minutes:
| San Juan: | 3.0% (200) |
| Texas: | 8.6% (1,058,376) |
60 to 89 minutes:
| San Juan: | 4.3% (290) |
| Texas: | 5.7% (706,002) |
90 or more minutes:
| San Juan: | 4.5% (303) |
| Texas: | 2.4% (299,884) |


Less than 5 minutes:
| San Juan: | 2.5% (192) |
| Texas: | 3.0% (277,642) |
5 to 9 minutes:
| San Juan: | 12.6% (974) |
| Texas: | 10.3% (942,891) |
10 to 14 minutes:
| San Juan: | 18.5% (1,431) |
| Texas: | 14.4% (1,317,555) |
15 to 19 minutes:
| San Juan: | 24.1% (1,862) |
| Texas: | 16.0% (1,467,945) |
20 to 24 minutes:
| San Juan: | 15.7% (1,215) |
| Texas: | 13.9% (1,276,781) |
25 to 29 minutes:
| San Juan: | 4.6% (359) |
| Texas: | 5.3% (482,838) |
30 to 34 minutes:
| San Juan: | 12.5% (968) |
| Texas: | 14.3% (1,309,699) |
35 to 39 minutes:
| San Juan: | 0.7% (55) |
| Texas: | 2.4% (219,873) |
40 to 44 minutes:
| San Juan: | 1.6% (121) |
| Texas: | 3.1% (280,916) |
45 to 59 minutes:
| San Juan: | 1.8% (136) |
| Texas: | 7.6% (692,006) |
60 to 89 minutes:
| San Juan: | 2.0% (153) |
| Texas: | 4.6% (418,905) |
90 or more minutes:
| San Juan: | 1.8% (139) |
| Texas: | 2.4% (218,800) |

Less than 5 minutes - Males:
| San Juan: | 5.4% (197) |
| Texas: | 2.7% (181,937) |
5 to 9 minutes - Males:
| San Juan: | 6.7% (243) |
| Texas: | 7.6% (522,166) |
10 to 14 minutes - Males:
| San Juan: | 13.4% (491) |
| Texas: | 11.5% (785,572) |
15 to 19 minutes - Males:
| San Juan: | 11.3% (415) |
| Texas: | 14.6% (1,001,179) |
20 to 24 minutes - Males:
| San Juan: | 21.0% (767) |
| Texas: | 13.9% (950,043) |
25 to 29 minutes - Males:
| San Juan: | 2.3% (83) |
| Texas: | 6.7% (457,259) |
30 to 34 minutes - Males:
| San Juan: | 19.5% (713) |
| Texas: | 16.2% (1,110,357) |
35 to 39 minutes - Males:
| San Juan: | 1.8% (67) |
| Texas: | 3.3% (223,512) |
40 to 44 minutes - Males:
| San Juan: | 3.7% (134) |
| Texas: | 4.2% (289,434) |
45 to 59 minutes - Males:
| San Juan: | 2.6% (96) |
| Texas: | 9.3% (639,122) |
60 to 89 minutes - Males:
| San Juan: | 6.2% (226) |
| Texas: | 6.8% (467,154) |
90 or more minutes - Males:
| San Juan: | 6.6% (242) |
| Texas: | 3.1% (211,313) |

Less than 5 minutes - Females:
| San Juan: | 19.3% (591) |
| Texas: | 3.1% (168,525) |
5 to 9 minutes - Females:
| San Juan: | 12.5% (384) |
| Texas: | 10.3% (565,596) |
10 to 14 minutes - Females:
| San Juan: | 23.2% (711) |
| Texas: | 13.9% (764,699) |
15 to 19 minutes - Females:
| San Juan: | 9.4% (288) |
| Texas: | 16.7% (917,174) |
20 to 24 minutes - Females:
| San Juan: | 22.5% (690) |
| Texas: | 15.0% (822,036) |
25 to 29 minutes - Females:
| San Juan: | 4.4% (136) |
| Texas: | 6.7% (370,574) |
30 to 34 minutes - Females:
| San Juan: | 4.3% (132) |
| Texas: | 14.2% (777,521) |
35 to 39 minutes - Females:
| San Juan: | 0.1% (5) |
| Texas: | 3.1% (170,658) |
40 to 44 minutes - Females:
| San Juan: | 1.0% (31) |
| Texas: | 3.4% (186,684) |
45 to 59 minutes - Females:
| San Juan: | 3.6% (110) |
| Texas: | 7.6% (419,254) |
60 to 89 minutes - Females:
| San Juan: | 1.3% (39) |
| Texas: | 4.4% (238,848) |
Means of transportation to work
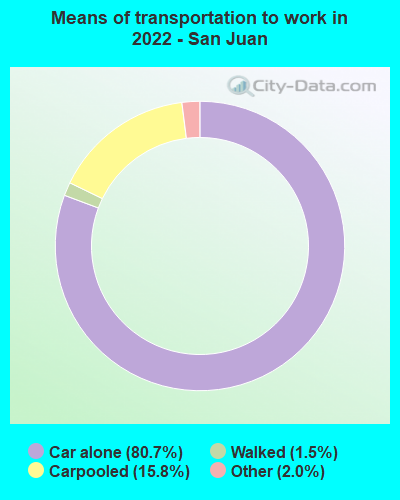

Drove car alone:
| San Juan: | 80.7% (5,515) |
| Texas: | 83.3% (4,557,023) |
Carpooled:
| San Juan: | 15.8% (1,079) |
| Texas: | 11.7% (674,818) |
Walked:
| San Juan: | 1.5% (102) |
| Texas: | 1.7% (99,911) |
Other means:
| San Juan: | 2.0% (134) |
| Texas: | 2.0% (95,481) |


Drove car alone:
| San Juan: | 72.2% (5,581) |
| Texas: | 77.7% (7,115,590) |
Carpooled:
| San Juan: | 20.5% (1,582) |
| Texas: | 14.5% (1,326,012) |
Bus or trolley bus:
| San Juan: | 0.2% (13) |
| Texas: | 1.7% (157,014) |
Streetcar or trolley car:
| San Juan: | 0.4% (31) |
| Texas: | 0.0% (1,669) |
Taxicab:
| San Juan: | 0.2% (17) |
| Texas: | 0.1% (6,102) |
Walked:
| San Juan: | 1.5% (117) |
| Texas: | 1.9% (173,670) |
Other means:
| San Juan: | 3.4% (264) |
| Texas: | 0.9% (86,692) |


Drove car alone - Males:
| San Juan: | 85.1% (3,182) |
| Texas: | 83.6% (4,557,023) |
Carpooled - Males:
| San Juan: | 12.2% (455) |
| Texas: | 11.2% (674,818) |
Walked - Males:
| San Juan: | 1.0% (36) |
| Texas: | 1.7% (99,911) |
Other means - Males:
| San Juan: | 1.7% (64) |
| Texas: | 2.2% (95,481) |


Drove car alone - Females:
| San Juan: | 75.1% (2,319) |
| Texas: | 83.0% (4,557,023) |
Carpooled - Females:
| San Juan: | 20.4% (629) |
| Texas: | 12.3% (674,818) |
Walked - Females:
| San Juan: | 2.2% (67) |
| Texas: | 1.8% (99,911) |
Other means - Females:
| San Juan: | 2.3% (70) |
| Texas: | 1.7% (95,481) |
Private vehicle occupancy

Drove alone:
| San Juan: | 89.3% (12,048) |
| Texas: | 87.6% (10,283,021) |
In 2 person carpool:
| San Juan: | 6.8% (916) |
| Texas: | 9.0% (1,052,595) |
In 3 person carpool:
| San Juan: | 1.9% (260) |
| Texas: | 2.1% (244,139) |
In 4 person carpool:
| San Juan: | 1.4% (191) |
| Texas: | 0.8% (92,732) |
In 7+ person carpool:
| San Juan: | 0.2% (30) |
| Texas: | 0.1% (16,725) |

Drove alone:
| San Juan: | 77.9% (5,581) |
| Texas: | 84.3% (7,115,590) |
In 2 person carpool:
| San Juan: | 14.4% (1,035) |
| Texas: | 11.6% (982,994) |
In 3 person carpool:
| San Juan: | 4.6% (332) |
| Texas: | 2.4% (201,602) |
In 4 person carpool:
| San Juan: | 2.0% (146) |
| Texas: | 1.0% (83,518) |
In 5-6 person carpool:
| San Juan: | 1.0% (69) |
| Texas: | 0.5% (40,662) |
Class of workers

Employee of private company:
| San Juan: | 70.1% (10,535) |
| Texas: | 69.6% (10,139,666) |
Self-employed in own incorporated business:
| San Juan: | 2.7% (412) |
| Texas: | 3.5% (516,446) |
Private not-for-profit wage and salary workers:
| San Juan: | 2.6% (386) |
| Texas: | 6.0% (870,454) |
Local government workers:
| San Juan: | 10.3% (1,542) |
| Texas: | 7.6% (1,109,799) |
State government workers:
| San Juan: | 4.7% (706) |
| Texas: | 3.8% (558,618) |
Federal government workers:
| San Juan: | 2.2% (333) |
| Texas: | 2.5% (357,298) |
Self-employed workers in own not incorporated business:
| San Juan: | 7.4% (1,117) |
| Texas: | 6.8% (998,270) |

Employee of private company:
| San Juan: | 66.2% (5,317) |
| Texas: | 69.6% (6,425,274) |
Self-employed in own incorporated business:
| San Juan: | 2.2% (179) |
| Texas: | 2.7% (250,864) |
Private not-for-profit wage and salary workers:
| San Juan: | 4.4% (354) |
| Texas: | 5.7% (526,631) |
Local government workers:
| San Juan: | 7.1% (572) |
| Texas: | 6.6% (608,479) |
State government workers:
| San Juan: | 6.4% (516) |
| Texas: | 5.4% (501,082) |
Federal government workers:
| San Juan: | 2.4% (196) |
| Texas: | 2.6% (237,177) |
Self-employed workers in own not incorporated business:
| San Juan: | 10.9% (876) |
| Texas: | 7.1% (653,527) |
Unpaid family workers:
| San Juan: | 0.3% (25) |
| Texas: | 0.3% (31,338) |

Employee of private company - Males:
| San Juan: | 71.6% (6,164) |
| Texas: | 73.1% (5,788,450) |
Self-employed in own incorporated business - Males:
| San Juan: | 3.3% (281) |
| Texas: | 4.2% (332,655) |
Private not-for-profit wage and salary workers - Males:
| San Juan: | 2.8% (237) |
| Texas: | 4.1% (323,476) |
Local government workers - Males:
| San Juan: | 7.4% (637) |
| Texas: | 5.1% (405,467) |
State government workers - Males:
| San Juan: | 3.5% (302) |
| Texas: | 3.0% (236,706) |
Federal government workers - Males:
| San Juan: | 1.9% (167) |
| Texas: | 2.7% (211,629) |
Self-employed workers in own not incorporated business - Males:
| San Juan: | 9.6% (827) |
| Texas: | 7.7% (609,246) |

Employee of private company - Females:
| San Juan: | 68.1% (4,371) |
| Texas: | 65.4% (4,351,216) |
Self-employed in own incorporated business - Females:
| San Juan: | 2.0% (131) |
| Texas: | 2.8% (183,791) |
Private not-for-profit wage and salary workers - Females:
| San Juan: | 2.3% (149) |
| Texas: | 8.2% (546,978) |
Local government workers - Females:
| San Juan: | 14.1% (905) |
| Texas: | 10.6% (704,332) |
State government workers - Females:
| San Juan: | 6.3% (404) |
| Texas: | 4.8% (321,912) |
Federal government workers - Females:
| San Juan: | 2.6% (166) |
| Texas: | 2.2% (145,669) |
Self-employed workers in own not incorporated business - Females:
| San Juan: | 4.5% (290) |
| Texas: | 5.8% (389,024) |