Work and Jobs in Rio Lucio, New Mexico (NM) Detailed Stats
Data:
Unemployment (%)
Unemployment (% change since 2000)
Unemployment (%) - White
Unemployment (% change since 2000) - White
Unemployment (%) - Black or African American
Unemployment (% change since 2000) - Black or African American
Unemployment (%) - Asian
Unemployment (% change since 2000) - Asian
Unemployment (%) - Hispanic or Latino
Unemployment (% change since 2000) - Hispanic or Latino
Unemployment (%) - American Indian and Alaska Native
Unemployment (% change since 2000) - American Indian and Alaska Native
Unemployment (%) - Multirace
Unemployment (% change since 2000) - Multirace
Unemployment (%) - Other Race
Unemployment (% change since 2000) - Other Race
Industry diversity
Most Common Industries - Agriculture, forestry, fishing and hunting, and mining (%)
Most Common Industries - Agriculture, forestry, fishing and hunting (%)
Most Common Industries - Mining, quarrying, and oil and gas extraction (%)
Most Common Industries - Construction (%)
Most Common Industries - Manufacturing (%)
Most Common Industries - Wholesale trade (%)
Most Common Industries - Retail trade (%)
Most Common Industries - Transportation and warehousing, and utilities (%)
Most Common Industries - Transportation and warehousing (%)
Most Common Industries - Utilities (%)
Most Common Industries - Information (%)
Most Common Industries - Finance and insurance, and real estate and rental and leasing (%)
Most Common Industries - Finance and insurance (%)
Most Common Industries - Real estate and rental and leasing (%)
Most Common Industries - Professional, scientific, and management, and administrative and waste management services (%)
Most Common Industries - Professional, scientific, and technical services (%)
Most Common Industries - Management of companies and enterprises (%)
Most Common Industries - Administrative and support and waste management services (%)
Most Common Industries - Educational services, and health care and social assistance (%)
Most Common Industries - Educational services (%)
Most Common Industries - Health care and social assistance (%)
Most Common Industries - Arts, entertainment, and recreation, and accommodation and food services (%)
Most Common Industries - Arts, entertainment, and recreation (%)
Most Common Industries - Accommodation and food services (%)
Most Common Industries - Other services, except public administration (%)
Most Common Industries - Public administration (%)
Occupation diversity
Most Common Occupations - Management, business, science, and arts occupations (%)
Most Common Occupations - Management, business, and financial occupations (%)
Most Common Occupations - Management occupations (%)
Most Common Occupations - Business and financial operations occupations (%)
Most Common Occupations - Computer, engineering, and science occupations (%)
Most Common Occupations - Computer and mathematical occupations (%)
Most Common Occupations - Architecture and engineering occupations (%)
Most Common Occupations - Life, physical, and social science occupations (%)
Most Common Occupations - Education, legal, community service, arts, and media occupations (%)
Most Common Occupations - Community and social service occupations (%)
Most Common Occupations - Legal occupations (%)
Most Common Occupations - Education, training, and library occupations (%)
Most Common Occupations - Arts, design, entertainment, sports, and media occupations (%)
Most Common Occupations - Healthcare practitioners and technical occupations (%)
Most Common Occupations - Health diagnosing and treating practitioners and other technical occupations (%)
Most Common Occupations - Health technologists and technicians (%)
Most Common Occupations - Service occupations (%)
Most Common Occupations - Healthcare support occupations (%)
Most Common Occupations - Protective service occupations (%)
Most Common Occupations - Fire fighting and prevention, and other protective service workers including supervisors (%)
Most Common Occupations - Law enforcement workers including supervisors (%)
Most Common Occupations - Food preparation and serving related occupations (%)
Most Common Occupations - Building and grounds cleaning and maintenance occupations (%)
Most Common Occupations - Personal care and service occupations (%)
Most Common Occupations - Sales and office occupations (%)
Most Common Occupations - Sales and related occupations (%)
Most Common Occupations - Office and administrative support occupations (%)
Most Common Occupations - Natural resources, construction, and maintenance occupations (%)
Most Common Occupations - Farming, fishing, and forestry occupations (%)
Most Common Occupations - Construction and extraction occupations (%)
Most Common Occupations - Installation, maintenance, and repair occupations (%)
Most Common Occupations - Production, transportation, and material moving occupations (%)
Most Common Occupations - Production occupations (%)
Most Common Occupations - Transportation occupations (%)
Most Common Occupations - Material moving occupations (%)
Private vehicle occupancy - Drove alone (% change since 2000)
Private vehicle occupancy - Carpooled (%)
Private vehicle occupancy - Carpooled (% change since 2000)
Private vehicle occupancy - In 2-person carpool (%)
Private vehicle occupancy - In 2-person carpool (% change since 2000)
Private vehicle occupancy - In 3-person carpool (%)
Private vehicle occupancy - In 3-person carpool (% change since 2000)
Private vehicle occupancy - In 4-person carpool (%)
Private vehicle occupancy - In 4-person carpool (% change since 2000)
Private vehicle occupancy - In 5- or 6-person carpool (%)
Private vehicle occupancy - In 5- or 6-person carpool (% change since 2000)
Private vehicle occupancy - In 7-or-more-person carpool (%)
Private vehicle occupancy - In 7-or-more-person carpool (% change since 2000)
Time Leaving Home To Go To Work - 12:00 a.m. to 4:59 a.m. (%)
Time Leaving Home To Go To Work - 12:00 a.m. to 4:59 a.m. (% change since 2000)
Time Leaving Home To Go To Work - 5:00 a.m. to 5:59 a.m. (%)
Time Leaving Home To Go To Work - 5:00 a.m. to 5:59 a.m. (% change since 2000)
Time Leaving Home To Go To Work - 6:00 a.m. to 6:59 a.m. (%)
Time Leaving Home To Go To Work - 6:00 a.m. to 6:59 a.m. (% change since 2000)
Time Leaving Home To Go To Work - 7:00 a.m. to 7:59 a.m. (%)
Time Leaving Home To Go To Work - 7:00 a.m. to 7:59 a.m. (% change since 2000)
Time Leaving Home To Go To Work - 8:00 a.m. to 8:59 a.m. (%)
Time Leaving Home To Go To Work - 8:00 a.m. to 8:59 a.m. (% change since 2000)
Time Leaving Home To Go To Work - 9:00 a.m. to 9:59 a.m. (%)
Time Leaving Home To Go To Work - 9:00 a.m. to 9:59 a.m. (% change since 2000)
Time Leaving Home To Go To Work - 10:00 a.m. to 10:59 a.m. (%)
Time Leaving Home To Go To Work - 10:00 a.m. to 10:59 a.m. (% change since 2000)
Time Leaving Home To Go To Work - 11:00 a.m. to 11:59 a.m. (%)
Time Leaving Home To Go To Work - 11:00 a.m. to 11:59 a.m. (% change since 2000)
Time Leaving Home To Go To Work - 12:00 p.m. to 3:59 p.m. (%)
Time Leaving Home To Go To Work - 12:00 p.m. to 3:59 p.m. (% change since 2000)
Time Leaving Home To Go To Work - 4:00 p.m. to 11:59 p.m. (%)
Time Leaving Home To Go To Work - 4:00 p.m. to 11:59 p.m. (% change since 2000)
Class of Workers - Employee of private company (%)
Class of Workers - Employee of private company (% change since 2000)
Class of Workers - Self-employed in own incorporated business (%)
Class of Workers - Self-employed in own incorporated business (% change since 2000)
Class of Workers - Private not-for-profit wage and salary workers (%)
Class of Workers - Private not-for-profit wage and salary workers (% change since 2000)
Class of Workers - Local government workers (%)
Class of Workers - Local government workers (% change since 2000)
Class of Workers - State government workers (%)
Class of Workers - State government workers (% change since 2000)
Class of Workers - Federal government workers (%)
Class of Workers - Federal government workers (% change since 2000)
Class of Workers - Self-employed workers in own not incorporated business and Unpaid family workers (%)
Class of Workers - Self-employed workers in own not incorporated business and Unpaid family workers (% change since 2000)
Means of transportation to work - Drove car alone (%)
Means of transportation to work - Drove car alone (% change since 2000)
Means of transportation to work - Carpooled (%)
Means of transportation to work - Carpooled (% change since 2000)
Means of transportation to work - Public transportation (%)
Means of transportation to work - Public transportation (% change since 2000)
Means of transportation to work - Bus or trolley bus (%)
Means of transportation to work - Bus or trolley bus (% change since 2000)
Means of transportation to work - Streetcar or trolley car (%)
Means of transportation to work - Streetcar or trolley car (% change since 2000)
Means of transportation to work - Subway or elevated (%)
Means of transportation to work - Subway or elevated (% change since 2000)
Means of transportation to work - Railroad (%)
Means of transportation to work - Railroad (% change since 2000)
Means of transportation to work - Ferryboat (%)
Means of transportation to work - Ferryboat (% change since 2000)
Means of transportation to work - Taxicab (%)
Means of transportation to work - Taxicab (% change since 2000)
Means of transportation to work - Motorcycle (%)
Means of transportation to work - Motorcycle (% change since 2000)
Means of transportation to work - Bicycle (%)
Means of transportation to work - Bicycle (% change since 2000)
Means of transportation to work - Walked (%)
Means of transportation to work - Walked (% change since 2000)
Means of transportation to work - Other means (%)
Means of transportation to work - Other means (% change since 2000)
Working at home (%)
Working at home (% change since 2000)
Travel time to work - Less than 5 minutes (%)
Travel time to work - Less than 5 minutes (% change since 2000)
Travel time to work - 5 to 9 minutes (%)
Travel time to work - 5 to 9 minutes (% change since 2000)
Travel time to work - 10 to 19 minutes (%)
Travel time to work - 10 to 19 minutes (% change since 2000)
Travel time to work - 20 to 29 minutes (%)
Travel time to work - 20 to 29 minutes (% change since 2000)
Travel time to work - 30 to 39 minutes (%)
Travel time to work - 30 to 39 minutes (% change since 2000)
Travel time to work - 40 to 59 minutes (%)
Travel time to work - 40 to 59 minutes (% change since 2000)
Travel time to work - 60 to 89 minutes (%)
Travel time to work - 60 to 89 minutes (% change since 2000)
Travel time to work - 90 or more minutes (%)
Travel time to work - 90 or more minutes (% change since 2000)
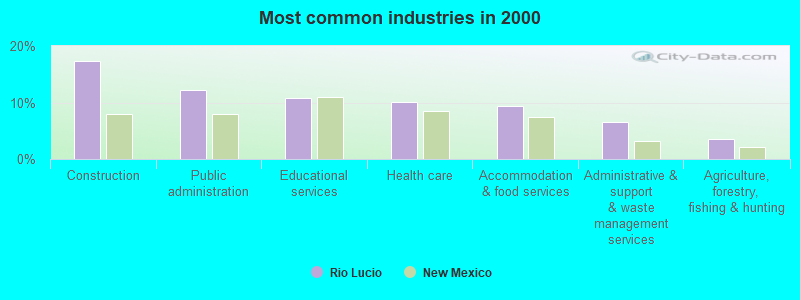
The most common industries in Rio Lucio are: Construction (17.3% of civilian employees), Public administration (12.2% of civilian employees), Educational services (10.8% of civilian employees). 60.8% of workers work in Taos County and 12.7% of all workers work at home. 51.4% of workers are employees of private companies, which is 11.1% less than the rate of 57.1% across the entire state of New Mexico.
Whole page based on the data from 2000 / 2022 when the population of Rio Lucio, New Mexico was 379 / 621
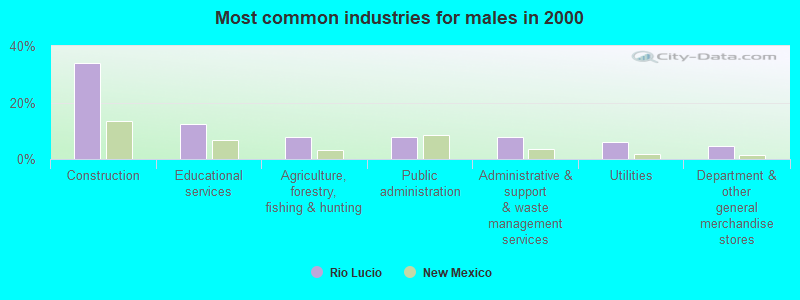
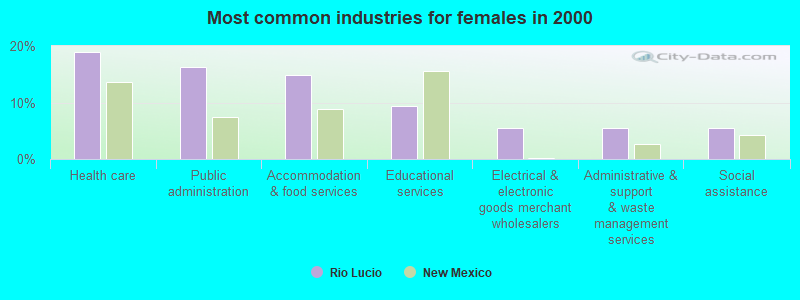
Most common industries
Most common industries Industry All Males Females
Construction 17.3% 33.8% 2.7% Public administration 12.2% 7.7% 16.2% Educational services 10.8% 12.3% 9.5% Health care 10.1% 0.0% 18.9% Accommodation and food services 9.4% 3.1% 14.9% Administrative and support and waste management services 6.5% 7.7% 5.4% Agriculture, forestry, fishing and hunting 3.6% 7.7% 0.0% Professional, scientific, and technical services 3.6% 3.1% 4.1% Electrical and electronic goods merchant wholesalers 2.9% 0.0% 5.4% Utilities 2.9% 6.2% 0.0% Social assistance 2.9% 0.0% 5.4% Personal and laundry services 2.9% 3.1% 2.7% Department and other general merchandise stores 2.2% 4.6% 0.0% Arts, entertainment, and recreation 2.2% 4.6% 0.0% Miscellaneous nondurable goods merchant wholesalers 1.4% 0.0% 2.7% Food 1.4% 0.0% 2.7% Groceries and related products merchant wholesalers 1.4% 3.1% 0.0% Metals and minerals, except petroleum, merchant wholesalers 1.4% 3.1% 0.0% Food and beverage stores 1.4% 0.0% 2.7% Gasoline stations 1.4% 0.0% 2.7% Finance and insurance 1.4% 0.0% 2.7% Broadcasting and telecommunications 0.7% 0.0% 1.4%
Unemployment in Rio Lucio Unemployment by race in 2022
Unemployment rate for other race residents 21.1% MalesUnemployment rate for two or more race residents 11.4% MalesUnemployment rate for Hispanic or Latino residents 9.0% MalesUnemployment by race in 2000
Unemployment rate for other race residents 6.5% FemalesUnemployment rate for Hispanic or Latino residents 3.0% Females
Time leaving home to go to work 12:00 a.m. to 4:59 a.m.: Rio Lucio:
4.8% (9)New Mexico:
4.6% (38,210)
5:00 a.m. to 5:29 a.m.: Rio Lucio:
7.1% (13)New Mexico:
3.6% (30,094)
5:30 a.m. to 5:59 a.m.: Rio Lucio:
12.6% (24)New Mexico:
5.1% (41,811)
6:00 a.m. to 6:29 a.m.: Rio Lucio:
11.7% (22)New Mexico:
9.1% (74,992)
6:30 a.m. to 6:59 a.m.: Rio Lucio:
12.6% (24)New Mexico:
9.9% (81,934)
7:00 a.m. to 7:29 a.m.: Rio Lucio:
16.5% (31)New Mexico:
15.6% (129,058)
7:30 a.m. to 7:59 a.m.: Rio Lucio:
15.3% (29)New Mexico:
14.8% (121,786)
8:00 a.m. to 8:29 a.m.: Rio Lucio:
10.2% (19)New Mexico:
10.8% (89,083)
8:30 a.m. to 8:59 a.m.: Rio Lucio:
1.8% (3)New Mexico:
4.7% (39,064)
10:00 a.m. to 10:59 a.m.: Rio Lucio:
5.6% (10)New Mexico:
3.3% (26,972)
12:00 p.m. to 3:59 p.m.: Rio Lucio:
2.7% (5)New Mexico:
6.2% (50,927)
5:30am: Rio Lucio:
4.3% (6)New Mexico:
2.4% (18,406)
6am: Rio Lucio:
7.9% (11)New Mexico:
3.7% (28,342)
6:30am: Rio Lucio:
25.2% (35)New Mexico:
7.4% (56,047)
7am: Rio Lucio:
10.1% (14)New Mexico:
10.5% (79,915)
7:30am: Rio Lucio:
22.3% (31)New Mexico:
15.0% (113,891)
8am: Rio Lucio:
13.7% (19)New Mexico:
18.4% (139,438)
8:30am: Rio Lucio:
5.0% (7)New Mexico:
10.3% (78,335)
9am: Rio Lucio:
1.4% (2)New Mexico:
4.5% (33,927)
10am: Rio Lucio:
1.4% (2)New Mexico:
5.4% (40,980)
11am: Rio Lucio:
3.6% (5)New Mexico:
2.3% (17,825)
4pm: Rio Lucio:
1.4% (2)New Mexico:
5.7% (43,093)
>4pm: Rio Lucio:
3.6% (5)New Mexico:
6.2% (47,115)
12:00 a.m. to 4:59 a.m. - Males: Rio Lucio:
3.5% (4)New Mexico:
5.7% (25,356)
5:00 a.m. to 5:29 a.m. - Males: Rio Lucio:
6.6% (7)New Mexico:
5.2% (23,201)
5:30 a.m. to 5:59 a.m. - Males: Rio Lucio:
11.7% (13)New Mexico:
6.2% (27,894)
6:00 a.m. to 6:29 a.m. - Males: Rio Lucio:
17.7% (19)New Mexico:
10.8% (48,334)
6:30 a.m. to 6:59 a.m. - Males: Rio Lucio:
4.6% (5)New Mexico:
11.1% (49,662)
7:00 a.m. to 7:29 a.m. - Males: Rio Lucio:
27.3% (30)New Mexico:
14.3% (64,129)
7:30 a.m. to 7:59 a.m. - Males: Rio Lucio:
12.3% (13)New Mexico:
12.1% (54,167)
8:00 a.m. to 8:29 a.m. - Males: Rio Lucio:
10.1% (11)New Mexico:
10.6% (47,522)
10:00 a.m. to 10:59 a.m. - Males: Rio Lucio:
2.5% (3)New Mexico:
3.3% (14,683)
12:00 p.m. to 3:59 p.m. - Males: Rio Lucio:
3.3% (4)New Mexico:
5.4% (24,361)
12:00 a.m. to 4:59 a.m. - Females: Rio Lucio:
7.3% (6)New Mexico:
3.4% (12,854)
5:00 a.m. to 5:29 a.m. - Females: Rio Lucio:
7.7% (6)New Mexico:
1.8% (6,893)
5:30 a.m. to 5:59 a.m. - Females: Rio Lucio:
14.3% (11)New Mexico:
3.7% (13,917)
6:00 a.m. to 6:29 a.m. - Females: Rio Lucio:
2.8% (2)New Mexico:
7.1% (26,658)
6:30 a.m. to 6:59 a.m. - Females: Rio Lucio:
22.6% (18)New Mexico:
8.5% (32,272)
7:30 a.m. to 7:59 a.m. - Females: Rio Lucio:
19.6% (15)New Mexico:
17.9% (67,619)
8:00 a.m. to 8:29 a.m. - Females: Rio Lucio:
10.5% (8)New Mexico:
11.0% (41,561)
8:30 a.m. to 8:59 a.m. - Females: Rio Lucio:
4.1% (3)New Mexico:
5.9% (22,363)
10:00 a.m. to 10:59 a.m. - Females: Rio Lucio:
8.7% (7)New Mexico:
3.3% (12,289)
12:00 p.m. to 3:59 p.m. - Females: Rio Lucio:
1.4% (1)New Mexico:
7.0% (26,566)
Travel time to work Percentage of workers working in this county: 60.8%Number of people working at home: 28 (12.7% of all workers )
Less than 5 minutes: Rio Lucio:
5.8% (8)New Mexico:
4.6% (34,755)
5 to 9 minutes: Rio Lucio:
13.7% (19)New Mexico:
13.9% (105,613)
10 to 14 minutes: Rio Lucio:
15.1% (21)New Mexico:
16.9% (128,524)
20 to 24 minutes: Rio Lucio:
1.4% (2)New Mexico:
13.9% (105,552)
30 to 34 minutes: Rio Lucio:
7.9% (11)New Mexico:
10.9% (83,054)
35 to 39 minutes: Rio Lucio:
5.8% (8)New Mexico:
1.6% (12,256)
40 to 44 minutes: Rio Lucio:
7.2% (10)New Mexico:
2.2% (16,472)
45 to 59 minutes: Rio Lucio:
6.5% (9)New Mexico:
5.1% (38,963)
60 to 89 minutes: Rio Lucio:
25.9% (36)New Mexico:
3.2% (24,038)
90 or more minutes: Rio Lucio:
10.8% (15)New Mexico:
2.0% (15,506)
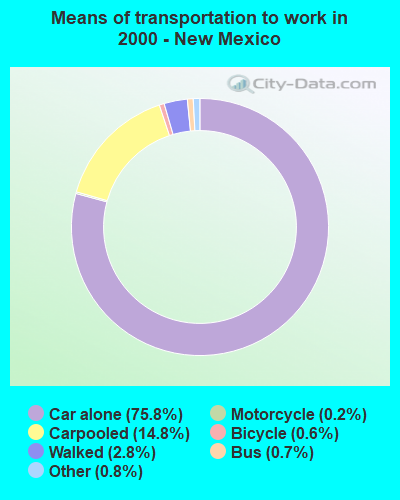
Means of transportation to work Drove car alone: Rio Lucio:
56.8% (79)New Mexico:
75.8% (575,187)
Carpooled: Rio Lucio:
38.1% (53)New Mexico:
14.8% (112,489)
Walked: Rio Lucio:
2.9% (4)New Mexico:
2.8% (21,435)
Other means: Rio Lucio:
2.2% (3)New Mexico:
0.8% (6,202)
Private vehicle occupancy Drove alone: Rio Lucio:
82.8% (147)New Mexico:
87.9% (687,338)
In 2 person carpool: Rio Lucio:
14.5% (26)New Mexico:
8.7% (68,297)
In 3 person carpool: Rio Lucio:
2.7% (5)New Mexico:
2.3% (17,742)
Drove alone: Rio Lucio:
59.8% (79)New Mexico:
83.6% (575,187)
In 2 person carpool: Rio Lucio:
19.7% (26)New Mexico:
12.3% (84,314)
In 3 person carpool: Rio Lucio:
8.3% (11)New Mexico:
2.5% (17,109)
In 5-6 person carpool: Rio Lucio:
5.3% (7)New Mexico:
0.4% (2,603)
In 7+ person carpool: Rio Lucio:
6.8% (9)New Mexico:
0.2% (1,470)
Class of workers
Employee of private company: Rio Lucio:
51.4% (113)New Mexico:
57.1% (535,323)
Private not-for-profit wage and salary workers: Rio Lucio:
7.1% (16)New Mexico:
8.2% (77,259)
Local government workers: Rio Lucio:
12.7% (28)New Mexico:
9.1% (85,345)
State government workers: Rio Lucio:
16.5% (36)New Mexico:
7.1% (66,149)
Federal government workers: Rio Lucio:
9.4% (21)New Mexico:
7.6% (71,182)
Self-employed workers in own not incorporated business: Rio Lucio:
2.8% (6)New Mexico:
7.3% (68,193)
Employee of private company: Rio Lucio:
37.4% (52)New Mexico:
58.3% (444,948)
Private not-for-profit wage and salary workers: Rio Lucio:
5.8% (8)New Mexico:
6.8% (51,679)
Local government workers: Rio Lucio:
11.5% (16)New Mexico:
7.6% (58,106)
State government workers: Rio Lucio:
19.4% (27)New Mexico:
8.5% (64,737)
Federal government workers: Rio Lucio:
16.5% (23)New Mexico:
6.6% (50,346)
Self-employed workers in own not incorporated business: Rio Lucio:
9.4% (13)New Mexico:
8.4% (64,108)
Employee of private company - Males: Rio Lucio:
71.3% (85)New Mexico:
60.1% (293,772)
Local government workers - Males: Rio Lucio:
11.3% (13)New Mexico:
7.5% (36,775)
State government workers - Males: Rio Lucio:
7.0% (8)New Mexico:
5.6% (27,614)
Federal government workers - Males: Rio Lucio:
6.1% (7)New Mexico:
9.1% (44,462)
Self-employed workers in own not incorporated business - Males: Rio Lucio:
4.3% (5)New Mexico:
7.9% (38,542)
Employee of private company - Females: Rio Lucio:
27.8% (28)New Mexico:
53.9% (241,551)
Private not-for-profit wage and salary workers - Females: Rio Lucio:
15.5% (16)New Mexico:
11.3% (50,817)
Local government workers - Females: Rio Lucio:
14.4% (15)New Mexico:
10.8% (48,570)
State government workers - Females: Rio Lucio:
27.8% (28)New Mexico:
8.6% (38,535)
Federal government workers - Females: Rio Lucio:
13.4% (13)New Mexico:
6.0% (26,720)
Self-employed workers in own not incorporated business - Females: Rio Lucio:
1.0% (1)New Mexico:
6.6% (29,651)