Work and Jobs in Northeast Tarrant, Texas (TX) Detailed Stats
Occupations, Industries, Unemployment, Workers, Commute
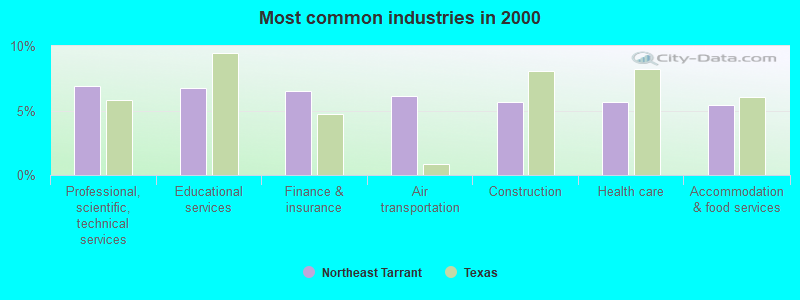
The most common industries in Northeast Tarrant are: Professional, scientific, technical services (6.9% of civilian employees), Educational services (6.7% of civilian employees), Finance & insurance (6.5% of civilian employees). 77.1% of workers are employees of private companies, which is 9.8% greater than the rate of 69.6% across the entire state of Texas.
Most common industries
Most common industries | |||
|---|---|---|---|
Industry | All | Males | Females |
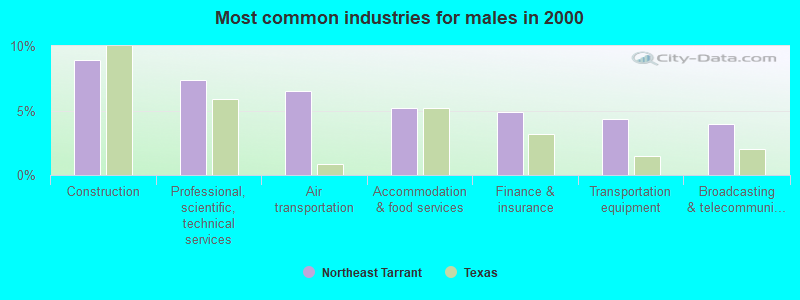
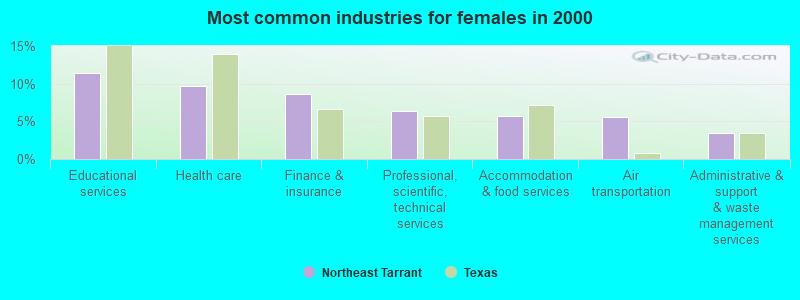
| Professional, scientific, and technical services | 6.9% (14,964) | 7.4% (8,725) | 6.4% (6,239) |
| Educational services | 6.7% (14,531) | 2.8% (3,376) | 11.5% (11,155) |
| Finance and insurance | 6.5% (14,132) | 4.9% (5,771) | 8.6% (8,361) |
| Air transportation | 6.1% (13,145) | 6.5% (7,722) | 5.6% (5,423) |
| Construction | 5.7% (12,273) | 8.9% (10,604) | 1.7% (1,669) |
| Health care | 5.6% (12,152) | 2.3% (2,769) | 9.7% (9,383) |
| Accommodation and food services | 5.5% (11,772) | 5.2% (6,175) | 5.8% (5,597) |
| Administrative and support and waste management services | 3.6% (7,767) | 3.7% (4,370) | 3.5% (3,397) |
| Broadcasting and telecommunications | 3.5% (7,651) | 3.9% (4,673) | 3.1% (2,978) |
| Computer and electronic products | 3.0% (6,512) | 3.6% (4,318) | 2.3% (2,194) |
| Transportation equipment | 3.0% (6,375) | 4.3% (5,134) | 1.3% (1,241) |
| Public administration | 2.9% (6,303) | 3.2% (3,759) | 2.6% (2,544) |
| Real estate and rental and leasing | 2.5% (5,419) | 2.1% (2,443) | 3.1% (2,976) |
| Food and beverage stores | 2.2% (4,658) | 2.2% (2,612) | 2.1% (2,046) |
| Other transportation, and support activities, and couriers | 2.1% (4,603) | 2.9% (3,412) | 1.2% (1,191) |
| Department and other general merchandise stores | 1.8% (3,832) | 1.1% (1,328) | 2.6% (2,504) |
| Radio, TV, and computer stores | 1.7% (3,577) | 1.9% (2,298) | 1.3% (1,279) |
| Social assistance | 1.6% (3,432) | 0.2% (273) | 3.2% (3,159) |
| Repair and maintenance | 1.4% (3,095) | 2.2% (2,568) | 0.5% (527) |
| Motor vehicle and parts dealers | 1.3% (2,899) | 2.0% (2,429) | 0.5% (470) |
| Truck transportation | 1.3% (2,885) | 1.9% (2,276) | 0.6% (609) |
| Religious, grantmaking, civic, professional, and similar organizations | 1.3% (2,844) | 1.0% (1,157) | 1.7% (1,687) |
| Arts, entertainment, and recreation | 1.3% (2,776) | 1.3% (1,539) | 1.3% (1,237) |
| Personal and laundry services | 1.2% (2,579) | 0.6% (764) | 1.9% (1,815) |
| Miscellaneous manufacturing | 1.1% (2,304) | 1.2% (1,436) | 0.9% (868) |
| Rail transportation | 1.0% (2,069) | 1.3% (1,556) | 0.5% (513) |
| Building material and garden equipment and supplies dealers | 0.9% (1,947) | 1.3% (1,503) | 0.5% (444) |
| Publishing, and motion picture and sound recording industries | 0.8% (1,806) | 0.9% (1,051) | 0.8% (755) |
| Metal and metal products | 0.7% (1,613) | 1.2% (1,379) | 0.2% (234) |
| Professional and commercial equipment and supplies merchant wholesalers | 0.7% (1,494) | 0.7% (854) | 0.7% (640) |
| Data processing, libraries, and other information services | 0.7% (1,474) | 0.7% (820) | 0.7% (654) |
| Used merchandise, gift, novelty, and souvenir, and other miscellaneous stores | 0.7% (1,472) | 0.5% (543) | 1.0% (929) |
| Machinery | 0.7% (1,427) | 0.9% (1,043) | 0.4% (384) |
| U. S. Postal service | 0.7% (1,411) | 0.8% (909) | 0.5% (502) |
| Printing and related support activities | 0.6% (1,358) | 0.7% (832) | 0.5% (526) |
| Furniture and home furnishings, and household appliance stores | 0.6% (1,282) | 0.6% (691) | 0.6% (591) |
| Groceries and related products merchant wholesalers | 0.6% (1,257) | 0.8% (975) | 0.3% (282) |
| Other direct selling establishments | 0.6% (1,234) | 0.5% (564) | 0.7% (670) |
| Chemicals | 0.6% (1,225) | 0.6% (708) | 0.5% (517) |
| Machinery, equipment, and supplies merchant wholesalers | 0.6% (1,205) | 0.8% (916) | 0.3% (289) |
| Food | 0.6% (1,202) | 0.7% (801) | 0.4% (401) |
| Electrical and electronic goods merchant wholesalers | 0.5% (1,168) | 0.7% (818) | 0.4% (350) |
| Clothing and accessories, including shoe, stores | 0.5% (1,131) | 0.3% (413) | 0.7% (718) |
| Pharmacies and drug stores | 0.5% (1,086) | 0.4% (457) | 0.6% (629) |
| Sporting goods, camera, and hobby and toy stores | 0.5% (1,021) | 0.4% (465) | 0.6% (556) |
| Drugs, sundries, and chemical and allied products merchant wholesalers | 0.4% (811) | 0.3% (385) | 0.4% (426) |
| Utilities | 0.4% (771) | 0.5% (626) | 0.1% (145) |
| Plastics and rubber products | 0.3% (754) | 0.5% (545) | 0.2% (209) |
| Mining, quarrying, and oil and gas extraction | 0.3% (708) | 0.4% (500) | 0.2% (208) |
| Miscellaneous nondurable goods merchant wholesalers | 0.3% (682) | 0.3% (339) | 0.4% (343) |
| Paper | 0.3% (605) | 0.3% (398) | 0.2% (207) |
| Motor vehicles, parts and supplies merchant wholesalers | 0.3% (600) | 0.4% (457) | 0.1% (143) |
| Gasoline stations | 0.3% (573) | 0.3% (367) | 0.2% (206) |
| Warehousing and storage | 0.3% (554) | 0.3% (406) | 0.2% (148) |
| Beverage and tobacco products | 0.3% (552) | 0.4% (451) | 0.1% (101) |
| Nonmetallic mineral products | 0.3% (548) | 0.4% (441) | 0.1% (107) |
| Private households | 0.2% (509) | 0.0% (48) | 0.5% (461) |
| Furniture and related product manufacturing | 0.2% (465) | 0.3% (298) | 0.2% (167) |
| Health and personal care, except drug, stores | 0.2% (461) | 0.1% (93) | 0.4% (368) |
| Miscellaneous durable goods merchant wholesalers | 0.2% (457) | 0.2% (244) | 0.2% (213) |
| Electronic shopping and mail-order houses | 0.2% (440) | 0.2% (207) | 0.2% (233) |
| Lumber and other construction materials merchant wholesalers | 0.2% (428) | 0.3% (342) | 0.1% (86) |
| Jewelry, luggage, and leather goods stores | 0.2% (424) | 0.1% (175) | 0.3% (249) |
| Hardware, plumbing and heating equipment, and supplies merchant wholesalers | 0.2% (421) | 0.2% (258) | 0.2% (163) |
| Electrical equipment, appliances, and components | 0.2% (409) | 0.3% (337) | 0.1% (72) |
| Petroleum and petroleum products merchant wholesalers | 0.2% (327) | 0.1% (162) | 0.2% (165) |
| Furniture and home furnishing merchant wholesalers | 0.1% (286) | 0.2% (205) | 0.1% (81) |
| Paper and paper products merchant wholesalers | 0.1% (285) | 0.1% (157) | 0.1% (128) |
| Office supplies and stationery stores | 0.1% (281) | 0.1% (135) | 0.2% (146) |
| Retail florists | 0.1% (269) | 0.1% (66) | 0.2% (203) |
| Petroleum and coal products | 0.1% (261) | 0.2% (184) | 0.1% (77) |
| Agriculture, forestry, fishing and hunting | 0.1% (258) | 0.2% (191) | 0.1% (67) |
| Wood products | 0.1% (242) | 0.2% (211) | 0.0% (31) |
| Apparel | 0.1% (229) | 0.1% (121) | 0.1% (108) |
| Music stores | 0.1% (224) | 0.1% (159) | 0.1% (65) |
Unemployment in Northeast Tarrant
- Unemployment by race in 2000
- Unemployment rate for White non-Hispanic residents
- 2.6%Males
- 3.0%Females
- Unemployment rate for Black residents
- 4.6%Males
- 6.5%Females
- Unemployment rate for American Indian and Alaska Native residents
- 5.3%Males
- 4.8%Females
- Unemployment rate for Asian residents
- 1.9%Males
- 2.9%Females
- Unemployment rate for other race residents
- 4.0%Males
- 5.7%Females
- Unemployment rate for two or more race residents
- 6.4%Males
- 5.6%Females
- Unemployment rate for Hispanic or Latino residents
- 3.6%Males
- 5.1%Females
Time leaving home to go to work

<5am:
| Northeast Tarrant: | 2.4% (5,165) |
| Texas: | 3.1% (281,361) |
5:30am:
| Northeast Tarrant: | 2.5% (5,312) |
| Texas: | 2.9% (262,060) |
6am:
| Northeast Tarrant: | 3.9% (8,217) |
| Texas: | 4.4% (403,423) |
6:30am:
| Northeast Tarrant: | 8.5% (18,058) |
| Texas: | 8.8% (808,876) |
7am:
| Northeast Tarrant: | 10.7% (22,734) |
| Texas: | 10.7% (976,557) |
7:30am:
| Northeast Tarrant: | 17.4% (36,847) |
| Texas: | 16.4% (1,500,904) |
8am:
| Northeast Tarrant: | 15.9% (33,750) |
| Texas: | 16.8% (1,536,308) |
8:30am:
| Northeast Tarrant: | 10.5% (22,198) |
| Texas: | 10.0% (913,601) |
9am:
| Northeast Tarrant: | 4.7% (10,046) |
| Texas: | 4.4% (398,656) |
10am:
| Northeast Tarrant: | 5.1% (10,879) |
| Texas: | 5.2% (472,592) |
11am:
| Northeast Tarrant: | 2.1% (4,531) |
| Texas: | 2.2% (197,844) |
12pm:
| Northeast Tarrant: | 0.9% (1,915) |
| Texas: | 0.9% (86,997) |
4pm:
| Northeast Tarrant: | 5.7% (12,179) |
| Texas: | 5.5% (503,565) |
>4pm:
| Northeast Tarrant: | 6.3% (13,343) |
| Texas: | 6.1% (563,107) |
Travel time to work


Less than 5 minutes:
| Northeast Tarrant: | 1.8% (3,837) |
| Texas: | 3.0% (277,642) |
5 to 9 minutes:
| Northeast Tarrant: | 7.7% (16,435) |
| Texas: | 10.3% (942,891) |
10 to 14 minutes:
| Northeast Tarrant: | 12.1% (25,620) |
| Texas: | 14.4% (1,317,555) |
15 to 19 minutes:
| Northeast Tarrant: | 14.2% (30,172) |
| Texas: | 16.0% (1,467,945) |
20 to 24 minutes:
| Northeast Tarrant: | 15.7% (33,249) |
| Texas: | 13.9% (1,276,781) |
25 to 29 minutes:
| Northeast Tarrant: | 7.3% (15,517) |
| Texas: | 5.3% (482,838) |
30 to 34 minutes:
| Northeast Tarrant: | 16.4% (34,785) |
| Texas: | 14.3% (1,309,699) |
35 to 39 minutes:
| Northeast Tarrant: | 3.2% (6,796) |
| Texas: | 2.4% (219,873) |
40 to 44 minutes:
| Northeast Tarrant: | 3.9% (8,379) |
| Texas: | 3.1% (280,916) |
45 to 59 minutes:
| Northeast Tarrant: | 8.4% (17,735) |
| Texas: | 7.6% (692,006) |
60 to 89 minutes:
| Northeast Tarrant: | 4.1% (8,610) |
| Texas: | 4.6% (418,905) |
90 or more minutes:
| Northeast Tarrant: | 1.9% (4,039) |
| Texas: | 2.4% (218,800) |
Means of transportation to work


Drove car alone:
| Northeast Tarrant: | 84.8% (179,949) |
| Texas: | 77.7% (7,115,590) |
Carpooled:
| Northeast Tarrant: | 9.8% (20,798) |
| Texas: | 14.5% (1,326,012) |
Bus or trolley bus:
| Northeast Tarrant: | 0.0% (99) |
| Texas: | 1.7% (157,014) |
Streetcar or trolley car:
| Northeast Tarrant: | 0.0% (15) |
| Texas: | 0.0% (1,669) |
Subway or elevated:
| Northeast Tarrant: | 0.0% (52) |
| Texas: | 0.0% (2,371) |
Railroad:
| Northeast Tarrant: | 0.0% (39) |
| Texas: | 0.0% (2,374) |
Ferryboat:
| Northeast Tarrant: | 0.0% (8) |
| Texas: | 0.0% (738) |
Taxicab:
| Northeast Tarrant: | 0.1% (166) |
| Texas: | 0.1% (6,102) |
Motorcycle:
| Northeast Tarrant: | 0.1% (260) |
| Texas: | 0.1% (12,068) |
Bicycle:
| Northeast Tarrant: | 0.2% (404) |
| Texas: | 0.2% (21,551) |
Walked:
| Northeast Tarrant: | 0.9% (1,962) |
| Texas: | 1.9% (173,670) |
Other means:
| Northeast Tarrant: | 0.7% (1,422) |
| Texas: | 0.9% (86,692) |
Private vehicle occupancy

Drove alone:
| Northeast Tarrant: | 89.6% (179,949) |
| Texas: | 84.3% (7,115,590) |
In 2 person carpool:
| Northeast Tarrant: | 8.5% (17,101) |
| Texas: | 11.6% (982,994) |
In 3 person carpool:
| Northeast Tarrant: | 1.2% (2,325) |
| Texas: | 2.4% (201,602) |
In 4 person carpool:
| Northeast Tarrant: | 0.4% (878) |
| Texas: | 1.0% (83,518) |
In 5-6 person carpool:
| Northeast Tarrant: | 0.2% (324) |
| Texas: | 0.5% (40,662) |
In 7+ person carpool:
| Northeast Tarrant: | 0.1% (170) |
| Texas: | 0.2% (17,236) |
Class of workers

Employee of private company:
| Northeast Tarrant: | 77.1% (166,461) |
| Texas: | 69.6% (6,425,274) |
Self-employed in own incorporated business:
| Northeast Tarrant: | 2.8% (6,107) |
| Texas: | 2.7% (250,864) |
Private not-for-profit wage and salary workers:
| Northeast Tarrant: | 5.0% (10,742) |
| Texas: | 5.7% (526,631) |
Local government workers:
| Northeast Tarrant: | 5.0% (10,878) |
| Texas: | 6.6% (608,479) |
State government workers:
| Northeast Tarrant: | 2.0% (4,379) |
| Texas: | 5.4% (501,082) |
Federal government workers:
| Northeast Tarrant: | 2.3% (4,855) |
| Texas: | 2.6% (237,177) |
Self-employed workers in own not incorporated business:
| Northeast Tarrant: | 5.5% (11,886) |
| Texas: | 7.1% (653,527) |
Unpaid family workers:
| Northeast Tarrant: | 0.2% (466) |
| Texas: | 0.3% (31,338) |

Employee of private company - Males:
| Northeast Tarrant: | 80.4% (95,338) |
| Texas: | 72.7% (3,684,731) |
Self-employed in own incorporated business - Males:
| Northeast Tarrant: | 3.7% (4,344) |
| Texas: | 3.6% (183,838) |
Private not-for-profit wage and salary workers - Males:
| Northeast Tarrant: | 2.7% (3,242) |
| Texas: | 3.4% (173,484) |
Local government workers - Males:
| Northeast Tarrant: | 3.7% (4,417) |
| Texas: | 5.1% (260,804) |
State government workers - Males:
| Northeast Tarrant: | 1.0% (1,239) |
| Texas: | 3.8% (190,371) |
Federal government workers - Males:
| Northeast Tarrant: | 2.5% (2,968) |
| Texas: | 2.6% (133,009) |
Self-employed workers in own not incorporated business - Males:
| Northeast Tarrant: | 5.8% (6,873) |
| Texas: | 8.4% (428,111) |
Unpaid family workers - Males:
| Northeast Tarrant: | 0.1% (145) |
| Texas: | 0.3% (14,338) |

Employee of private company - Females:
| Northeast Tarrant: | 73.2% (71,123) |
| Texas: | 65.8% (2,740,543) |
Self-employed in own incorporated business - Females:
| Northeast Tarrant: | 1.8% (1,763) |
| Texas: | 1.6% (67,026) |
Private not-for-profit wage and salary workers - Females:
| Northeast Tarrant: | 7.7% (7,500) |
| Texas: | 8.5% (353,147) |
Local government workers - Females:
| Northeast Tarrant: | 6.6% (6,461) |
| Texas: | 8.3% (347,675) |
State government workers - Females:
| Northeast Tarrant: | 3.2% (3,140) |
| Texas: | 7.5% (310,711) |
Federal government workers - Females:
| Northeast Tarrant: | 1.9% (1,887) |
| Texas: | 2.5% (104,168) |
Self-employed workers in own not incorporated business - Females:
| Northeast Tarrant: | 5.2% (5,013) |
| Texas: | 5.4% (225,416) |
Unpaid family workers - Females:
| Northeast Tarrant: | 0.3% (321) |
| Texas: | 0.4% (17,000) |