Work and Jobs in Kaplan, Louisiana (LA) Detailed Stats
Occupations, Industries, Unemployment, Workers, Commute
Settings
X


Recent posts about work in Kaplan, Louisiana on our local forum with over 2,400,000 registered users:
 | River ranch, lafayette SNOOTY? (166 replies) |
| Moving to Vermilion Parish (1 reply) |
Latest news about work in Kaplan, LA collected exclusively by city-data.com from local newspapers, TV, and radio stations
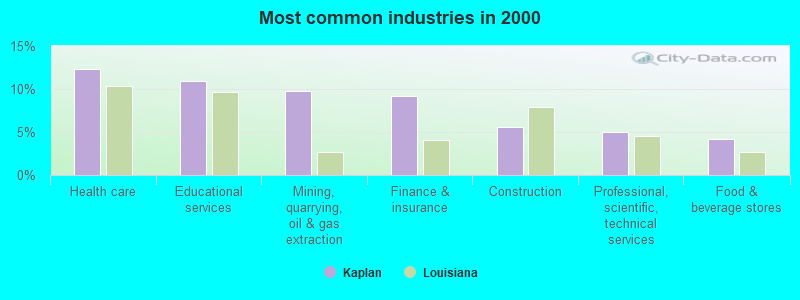
The most common industries in Kaplan are: Health care (12.3% of civilian employees), Educational services (10.9% of civilian employees), Mining, quarrying, oil & gas extraction (9.7% of civilian employees). 54.6% of workers work in Vermilion Parish and 1.5% of all workers work at home. 71.3% of workers are employees of private companies, which is 8.9% greater than the rate of 64.9% across the entire state of Louisiana.
Whole page based on the data from 2000 / 2022 when the population of Kaplan, Louisiana was 5,177 / 4,288
Whole page based on the data from 2000 / 2022 when the population of Kaplan, Louisiana was 5,177 / 4,288
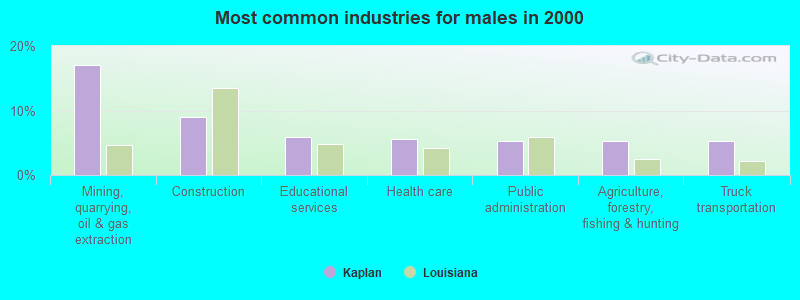
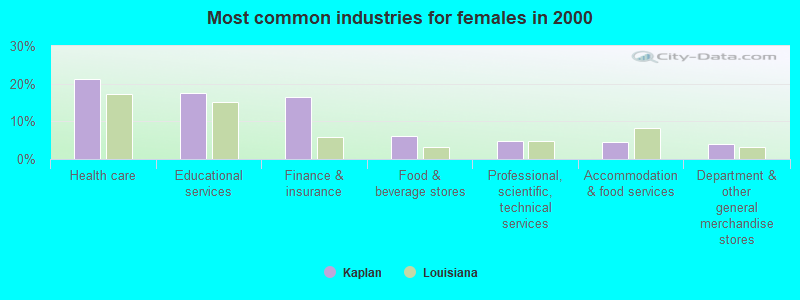
Most common industries
Most common industries | |||
|---|---|---|---|
Industry | All | Males | Females |
| Health care | 12.3% (210) | 5.6% (55) | 21.1% (155) |
| Educational services | 10.9% (186) | 5.8% (57) | 17.6% (129) |
| Mining, quarrying, and oil and gas extraction | 9.7% (166) | 17.0% (166) | 0.0% (0) |
| Finance and insurance | 9.1% (156) | 3.6% (35) | 16.5% (121) |
| Construction | 5.6% (96) | 8.9% (87) | 1.2% (9) |
| Professional, scientific, and technical services | 5.0% (86) | 5.2% (51) | 4.8% (35) |
| Food and beverage stores | 4.2% (72) | 2.9% (28) | 6.0% (44) |
| Public administration | 4.1% (70) | 5.3% (52) | 2.5% (18) |
| Agriculture, forestry, fishing and hunting | 3.0% (51) | 5.2% (51) | 0.0% (0) |
| Truck transportation | 3.0% (51) | 5.2% (51) | 0.0% (0) |
| Food | 2.6% (44) | 3.7% (36) | 1.1% (8) |
| Broadcasting and telecommunications | 2.6% (44) | 3.1% (30) | 1.9% (14) |
| Accommodation and food services | 2.5% (43) | 0.9% (9) | 4.6% (34) |
| Administrative and support and waste management services | 2.5% (43) | 2.6% (25) | 2.5% (18) |
| Social assistance | 2.3% (39) | 1.5% (15) | 3.3% (24) |
| Other transportation, and support activities, and couriers | 1.9% (32) | 3.3% (32) | 0.0% (0) |
| Department and other general merchandise stores | 1.7% (29) | 0.0% (0) | 4.0% (29) |
| Motor vehicle and parts dealers | 1.5% (25) | 2.6% (25) | 0.0% (0) |
| Real estate and rental and leasing | 1.3% (23) | 0.7% (7) | 2.2% (16) |
| Apparel | 1.2% (20) | 0.9% (9) | 1.5% (11) |
| U. S. Postal service | 1.2% (20) | 2.1% (20) | 0.0% (0) |
| Metal and metal products | 1.1% (19) | 1.9% (19) | 0.0% (0) |
| Gasoline stations | 1.1% (19) | 1.9% (19) | 0.0% (0) |
| Utilities | 1.1% (18) | 1.8% (18) | 0.0% (0) |
| Clothing and accessories, including shoe, stores | 0.8% (14) | 1.4% (14) | 0.0% (0) |
| Data processing, libraries, and other information services | 0.8% (13) | 0.0% (0) | 1.8% (13) |
| Electrical equipment, appliances, and components | 0.8% (13) | 1.3% (13) | 0.0% (0) |
| Religious, grantmaking, civic, professional, and similar organizations | 0.8% (13) | 0.0% (0) | 1.8% (13) |
| Repair and maintenance | 0.6% (11) | 1.1% (11) | 0.0% (0) |
| Other direct selling establishments | 0.6% (10) | 0.0% (0) | 1.4% (10) |
| Machinery, equipment, and supplies merchant wholesalers | 0.6% (10) | 0.0% (0) | 1.4% (10) |
| Recyclable material merchant wholesalers | 0.5% (9) | 0.9% (9) | 0.0% (0) |
| Building material and garden equipment and supplies dealers | 0.5% (9) | 0.9% (9) | 0.0% (0) |
| Personal and laundry services | 0.5% (9) | 0.0% (0) | 1.2% (9) |
| Lumber and other construction materials merchant wholesalers | 0.5% (9) | 0.9% (9) | 0.0% (0) |
| Miscellaneous nondurable goods merchant wholesalers | 0.5% (8) | 0.0% (0) | 1.1% (8) |
| Apparel, fabrics, and notions merchant wholesalers | 0.4% (7) | 0.7% (7) | 0.0% (0) |
| Arts, entertainment, and recreation | 0.4% (6) | 0.6% (6) | 0.0% (0) |
| Miscellaneous manufacturing | 0.3% (5) | 0.0% (0) | 0.7% (5) |
Unemployment in Kaplan
- Unemployment by race in 2022
- Unemployment rate for White non-Hispanic residents
- 12.9%Males
- 3.9%Females
- Unemployment by race in 2000
- Unemployment rate for White non-Hispanic residents
- 11.8%Males
- 7.5%Females
- Unemployment rate for Black residents
- 26.8%Males
- 17.3%Females
Time leaving home to go to work

12:00 a.m. to 4:59 a.m.:
| Kaplan: | 2.1% (25) |
| Louisiana: | 8.2% (151,357) |
5:00 a.m. to 5:29 a.m.:
| Kaplan: | 4.4% (53) |
| Louisiana: | 5.3% (97,780) |
5:30 a.m. to 5:59 a.m.:
| Kaplan: | 17.4% (209) |
| Louisiana: | 5.3% (97,379) |
6:00 a.m. to 6:29 a.m.:
| Kaplan: | 14.3% (173) |
| Louisiana: | 10.6% (197,173) |
6:30 a.m. to 6:59 a.m.:
| Kaplan: | 10.2% (123) |
| Louisiana: | 10.1% (188,085) |
7:00 a.m. to 7:29 a.m.:
| Kaplan: | 4.5% (54) |
| Louisiana: | 15.8% (293,731) |
7:30 a.m. to 7:59 a.m.:
| Kaplan: | 16.5% (200) |
| Louisiana: | 11.4% (211,328) |
8:00 a.m. to 8:29 a.m.:
| Kaplan: | 2.2% (26) |
| Louisiana: | 9.1% (169,520) |
8:30 a.m. to 8:59 a.m.:
| Kaplan: | 5.9% (71) |
| Louisiana: | 3.6% (67,322) |
10:00 a.m. to 10:59 a.m.:
| Kaplan: | 4.7% (56) |
| Louisiana: | 2.7% (49,400) |
12:00 p.m. to 3:59 p.m.:
| Kaplan: | 9.9% (119) |
| Louisiana: | 5.7% (105,836) |
4:00 p.m. to 11:59 p.m.:
| Kaplan: | 7.9% (96) |
| Louisiana: | 5.9% (108,753) |

<5am:
| Kaplan: | 4.7% (80) |
| Louisiana: | 4.7% (85,706) |
5:30am:
| Kaplan: | 2.9% (50) |
| Louisiana: | 3.7% (67,771) |
6am:
| Kaplan: | 7.8% (133) |
| Louisiana: | 5.1% (93,066) |
6:30am:
| Kaplan: | 19.8% (338) |
| Louisiana: | 9.9% (180,725) |
7am:
| Kaplan: | 5.9% (101) |
| Louisiana: | 11.4% (208,729) |
7:30am:
| Kaplan: | 16.5% (283) |
| Louisiana: | 15.7% (287,107) |
8am:
| Kaplan: | 9.6% (165) |
| Louisiana: | 15.5% (283,342) |
8:30am:
| Kaplan: | 8.7% (148) |
| Louisiana: | 9.0% (164,858) |
9am:
| Kaplan: | 5.7% (98) |
| Louisiana: | 3.8% (69,191) |
10am:
| Kaplan: | 2.2% (37) |
| Louisiana: | 4.3% (79,604) |
11am:
| Kaplan: | 1.7% (29) |
| Louisiana: | 1.9% (34,713) |
12pm:
| Kaplan: | 0.8% (13) |
| Louisiana: | 0.9% (15,822) |
4pm:
| Kaplan: | 4.9% (83) |
| Louisiana: | 5.6% (101,653) |
>4pm:
| Kaplan: | 6.3% (107) |
| Louisiana: | 6.5% (119,441) |

12:00 a.m. to 4:59 a.m. - Males:
| Kaplan: | 3.6% (25) |
| Louisiana: | 11.4% (109,553) |
5:00 a.m. to 5:29 a.m. - Males:
| Kaplan: | 0.9% (6) |
| Louisiana: | 7.3% (69,883) |
5:30 a.m. to 5:59 a.m. - Males:
| Kaplan: | 23.7% (163) |
| Louisiana: | 6.6% (63,729) |
6:00 a.m. to 6:29 a.m. - Males:
| Kaplan: | 25.3% (174) |
| Louisiana: | 12.7% (122,252) |
6:30 a.m. to 6:59 a.m. - Males:
| Kaplan: | 15.4% (106) |
| Louisiana: | 9.1% (87,751) |
7:00 a.m. to 7:29 a.m. - Males:
| Kaplan: | 2.8% (19) |
| Louisiana: | 14.7% (141,518) |
7:30 a.m. to 7:59 a.m. - Males:
| Kaplan: | 10.4% (72) |
| Louisiana: | 8.9% (85,328) |
8:30 a.m. to 8:59 a.m. - Males:
| Kaplan: | 10.2% (70) |
| Louisiana: | 2.9% (28,340) |
4:00 p.m. to 11:59 p.m. - Males:
| Kaplan: | 4.1% (28) |
| Louisiana: | 5.5% (52,576) |

5:00 a.m. to 5:29 a.m. - Females:
| Kaplan: | 10.2% (53) |
| Louisiana: | 3.1% (27,897) |
5:30 a.m. to 5:59 a.m. - Females:
| Kaplan: | 8.5% (44) |
| Louisiana: | 3.8% (33,650) |
6:30 a.m. to 6:59 a.m. - Females:
| Kaplan: | 2.1% (11) |
| Louisiana: | 11.3% (100,334) |
7:00 a.m. to 7:29 a.m. - Females:
| Kaplan: | 6.7% (35) |
| Louisiana: | 17.1% (152,213) |
7:30 a.m. to 7:59 a.m. - Females:
| Kaplan: | 24.8% (128) |
| Louisiana: | 14.2% (126,000) |
8:00 a.m. to 8:29 a.m. - Females:
| Kaplan: | 4.8% (25) |
| Louisiana: | 9.8% (87,060) |
10:00 a.m. to 10:59 a.m. - Females:
| Kaplan: | 11.3% (58) |
| Louisiana: | 3.3% (29,537) |
12:00 p.m. to 3:59 p.m. - Females:
| Kaplan: | 22.7% (118) |
| Louisiana: | 6.3% (55,663) |
4:00 p.m. to 11:59 p.m. - Females:
| Kaplan: | 13.1% (68) |
| Louisiana: | 6.3% (56,177) |
Travel time to work
Percentage of workers working in this county: 54.6%
Number of people working at home: 19 (1.5% of all workers)
Number of people working at home: 19 (1.5% of all workers)

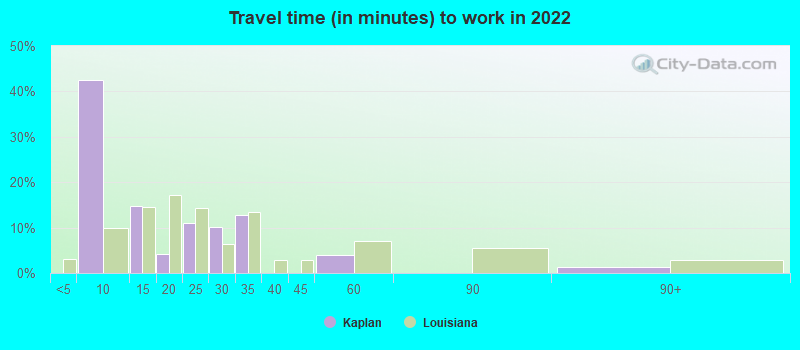

Less than 5 minutes:
| Kaplan: | 0.1% (1) |
| Louisiana: | 3.2% (58,824) |
5 to 9 minutes:
| Kaplan: | 42.4% (397) |
| Louisiana: | 10.0% (185,508) |
10 to 14 minutes:
| Kaplan: | 14.8% (138) |
| Louisiana: | 14.6% (271,512) |
15 to 19 minutes:
| Kaplan: | 4.2% (39) |
| Louisiana: | 17.2% (319,190) |
20 to 24 minutes:
| Kaplan: | 11.1% (104) |
| Louisiana: | 14.3% (265,127) |
25 to 29 minutes:
| Kaplan: | 10.2% (95) |
| Louisiana: | 6.5% (119,937) |
30 to 34 minutes:
| Kaplan: | 12.9% (120) |
| Louisiana: | 13.5% (251,176) |
45 to 59 minutes:
| Kaplan: | 4.0% (37) |
| Louisiana: | 7.1% (131,178) |
90 or more minutes:
| Kaplan: | 1.3% (12) |
| Louisiana: | 2.8% (52,200) |


Less than 5 minutes:
| Kaplan: | 7.8% (133) |
| Louisiana: | 3.4% (62,320) |
5 to 9 minutes:
| Kaplan: | 27.1% (463) |
| Louisiana: | 10.7% (196,227) |
10 to 14 minutes:
| Kaplan: | 9.6% (164) |
| Louisiana: | 15.3% (281,034) |
15 to 19 minutes:
| Kaplan: | 6.9% (118) |
| Louisiana: | 17.2% (314,832) |
20 to 24 minutes:
| Kaplan: | 12.3% (210) |
| Louisiana: | 14.4% (263,842) |
25 to 29 minutes:
| Kaplan: | 1.2% (20) |
| Louisiana: | 5.1% (93,519) |
30 to 34 minutes:
| Kaplan: | 10.8% (185) |
| Louisiana: | 13.2% (240,995) |
35 to 39 minutes:
| Kaplan: | 3.2% (55) |
| Louisiana: | 2.1% (39,029) |
40 to 44 minutes:
| Kaplan: | 4.2% (72) |
| Louisiana: | 2.4% (43,572) |
45 to 59 minutes:
| Kaplan: | 5.4% (92) |
| Louisiana: | 6.6% (120,270) |
60 to 89 minutes:
| Kaplan: | 3.1% (53) |
| Louisiana: | 4.2% (76,269) |
90 or more minutes:
| Kaplan: | 5.8% (100) |
| Louisiana: | 3.3% (59,819) |

Less than 5 minutes - Males:
| Kaplan: | 0.2% (1) |
| Louisiana: | 2.9% (27,710) |
5 to 9 minutes - Males:
| Kaplan: | 51.8% (216) |
| Louisiana: | 9.0% (87,605) |
15 to 19 minutes - Males:
| Kaplan: | 2.9% (12) |
| Louisiana: | 16.4% (159,234) |
20 to 24 minutes - Males:
| Kaplan: | 6.7% (28) |
| Louisiana: | 13.9% (134,498) |
25 to 29 minutes - Males:
| Kaplan: | 10.2% (42) |
| Louisiana: | 6.2% (60,114) |
30 to 34 minutes - Males:
| Kaplan: | 20.6% (86) |
| Louisiana: | 13.4% (130,162) |
45 to 59 minutes - Males:
| Kaplan: | 9.0% (37) |
| Louisiana: | 7.7% (74,661) |
90 or more minutes - Males:
| Kaplan: | 1.2% (5) |
| Louisiana: | 4.0% (38,432) |

5 to 9 minutes - Females:
| Kaplan: | 35.2% (183) |
| Louisiana: | 11.0% (97,903) |
10 to 14 minutes - Females:
| Kaplan: | 25.6% (133) |
| Louisiana: | 15.2% (135,773) |
15 to 19 minutes - Females:
| Kaplan: | 5.2% (27) |
| Louisiana: | 18.0% (159,956) |
20 to 24 minutes - Females:
| Kaplan: | 14.8% (77) |
| Louisiana: | 14.7% (130,629) |
25 to 29 minutes - Females:
| Kaplan: | 10.2% (53) |
| Louisiana: | 6.7% (59,823) |
30 to 34 minutes - Females:
| Kaplan: | 6.3% (33) |
| Louisiana: | 13.6% (121,014) |
90 or more minutes - Females:
| Kaplan: | 1.4% (8) |
| Louisiana: | 1.5% (13,768) |
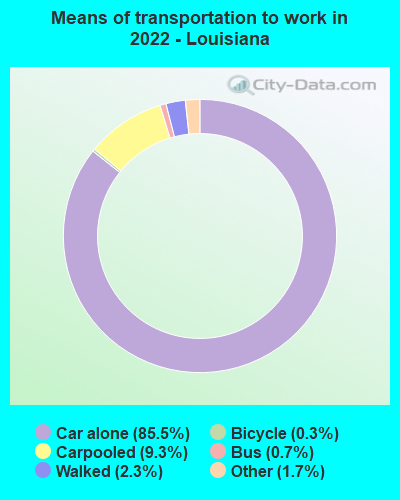
Means of transportation to work
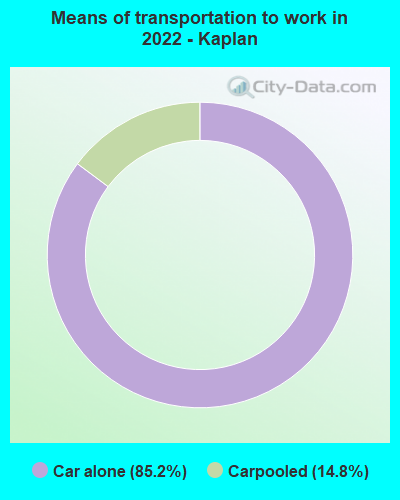
Drove car alone:
| Kaplan: | 85.2% (814) |
| Louisiana: | 85.5% (760,999) |
Carpooled:
| Kaplan: | 14.8% (141) |
| Louisiana: | 9.3% (88,060) |

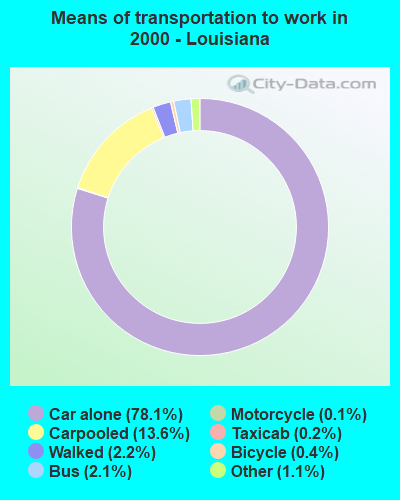
Drove car alone:
| Kaplan: | 69.1% (1,181) |
| Louisiana: | 78.1% (1,430,142) |
Carpooled:
| Kaplan: | 16.4% (280) |
| Louisiana: | 13.6% (249,640) |
Bus or trolley bus:
| Kaplan: | 0.5% (9) |
| Louisiana: | 2.1% (38,284) |
Motorcycle:
| Kaplan: | 0.6% (10) |
| Louisiana: | 0.1% (1,905) |
Bicycle:
| Kaplan: | 1.1% (19) |
| Louisiana: | 0.4% (6,648) |
Walked:
| Kaplan: | 6.6% (113) |
| Louisiana: | 2.2% (40,184) |
Other means:
| Kaplan: | 3.1% (53) |
| Louisiana: | 1.1% (19,932) |


Drove car alone - Males:
| Kaplan: | 75.9% (321) |
| Louisiana: | 85.7% (760,999) |
Carpooled - Males:
| Kaplan: | 24.1% (102) |
| Louisiana: | 8.8% (88,060) |

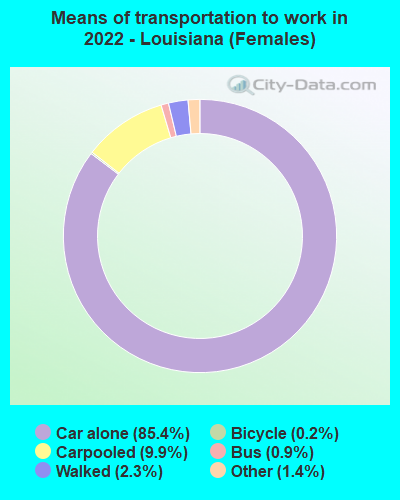
Drove car alone - Females:
| Kaplan: | 92.7% (496) |
| Louisiana: | 85.4% (760,999) |
Carpooled - Females:
| Kaplan: | 7.3% (39) |
| Louisiana: | 9.9% (88,060) |
Private vehicle occupancy

Drove alone:
| Kaplan: | 93.4% (1,086) |
| Louisiana: | 90.2% (1,585,743) |
In 2 person carpool:
| Kaplan: | 6.5% (76) |
| Louisiana: | 7.2% (125,938) |

Drove alone:
| Kaplan: | 80.8% (1,181) |
| Louisiana: | 85.1% (1,430,142) |
In 2 person carpool:
| Kaplan: | 12.1% (177) |
| Louisiana: | 11.2% (188,946) |
In 3 person carpool:
| Kaplan: | 4.2% (61) |
| Louisiana: | 2.2% (37,549) |
In 4 person carpool:
| Kaplan: | 1.6% (24) |
| Louisiana: | 0.8% (12,767) |
In 7+ person carpool:
| Kaplan: | 1.2% (18) |
| Louisiana: | 0.2% (3,798) |
Class of workers

Employee of private company:
| Kaplan: | 71.3% (891) |
| Louisiana: | 64.9% (1,323,254) |
Self-employed in own incorporated business:
| Kaplan: | 1.9% (23) |
| Louisiana: | 4.3% (87,972) |
Private not-for-profit wage and salary workers:
| Kaplan: | 7.1% (89) |
| Louisiana: | 7.9% (161,710) |
Local government workers:
| Kaplan: | 5.2% (65) |
| Louisiana: | 7.6% (154,461) |
Federal government workers:
| Kaplan: | 0.1% (1) |
| Louisiana: | 2.4% (48,815) |
Self-employed workers in own not incorporated business:
| Kaplan: | 14.5% (182) |
| Louisiana: | 7.0% (142,134) |

Employee of private company:
| Kaplan: | 62.6% (1,069) |
| Louisiana: | 67.3% (1,246,955) |
Self-employed in own incorporated business:
| Kaplan: | 2.7% (46) |
| Louisiana: | 3.4% (62,704) |
Private not-for-profit wage and salary workers:
| Kaplan: | 7.0% (120) |
| Louisiana: | 5.5% (101,490) |
Local government workers:
| Kaplan: | 11.1% (190) |
| Louisiana: | 7.1% (131,539) |
State government workers:
| Kaplan: | 4.8% (82) |
| Louisiana: | 7.7% (142,060) |
Federal government workers:
| Kaplan: | 1.8% (31) |
| Louisiana: | 2.7% (49,172) |
Self-employed workers in own not incorporated business:
| Kaplan: | 10.0% (170) |
| Louisiana: | 6.1% (112,275) |

Employee of private company - Males:
| Kaplan: | 64.0% (429) |
| Louisiana: | 68.8% (714,584) |
Private not-for-profit wage and salary workers - Males:
| Kaplan: | 3.0% (20) |
| Louisiana: | 5.0% (52,308) |
Local government workers - Males:
| Kaplan: | 8.0% (54) |
| Louisiana: | 5.5% (57,257) |
Federal government workers - Males:
| Kaplan: | 0.2% (1) |
| Louisiana: | 2.2% (22,553) |
Self-employed workers in own not incorporated business - Males:
| Kaplan: | 24.8% (167) |
| Louisiana: | 8.3% (86,638) |

Employee of private company - Females:
| Kaplan: | 79.7% (462) |
| Louisiana: | 60.9% (608,670) |
Self-employed in own incorporated business - Females:
| Kaplan: | 4.0% (23) |
| Louisiana: | 3.0% (30,250) |
Private not-for-profit wage and salary workers - Females:
| Kaplan: | 11.8% (69) |
| Louisiana: | 10.9% (109,402) |
Local government workers - Females:
| Kaplan: | 1.9% (11) |
| Louisiana: | 9.7% (97,204) |
Self-employed workers in own not incorporated business - Females:
| Kaplan: | 2.6% (15) |
| Louisiana: | 5.6% (55,496) |