Work and Jobs in Irving, Texas (TX) Detailed Stats
Occupations, Industries, Unemployment, Workers, Commute
Settings
X


Recent posts about work in Irving, Texas on our local forum with over 2,400,000 registered users:

Latest news about work in Irving, TX collected exclusively by city-data.com from local newspapers, TV, and radio stations
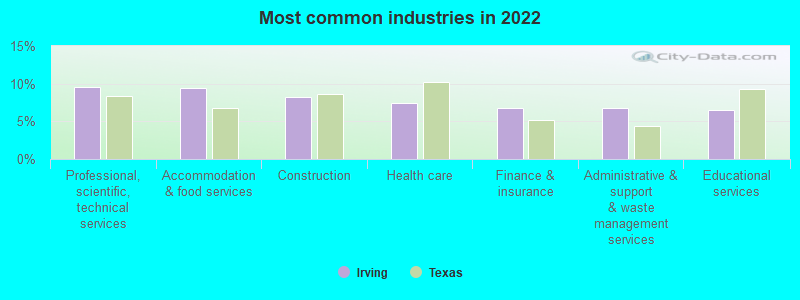
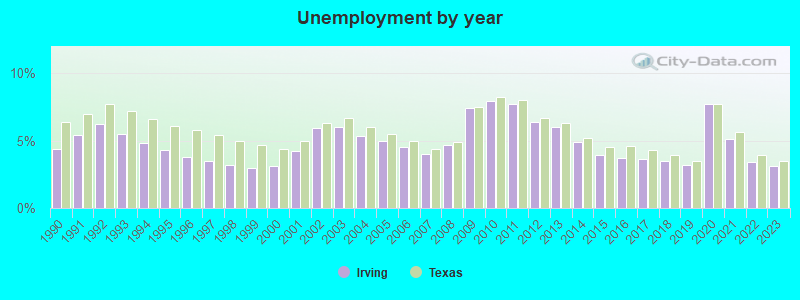
The unemployment rate in 2023 in Irving, TX was 3.1%, which was 12.9% less than the unemployment rate of 3.5% across the entire state of Texas. Compared to the unemployment rate of 6.0% in 2013, this represents a decrease of 93.5%. According to 2022 data, the most common industries in Irving are: Professional, scientific, technical services (9.6% of civilian employees), Accommodation & food services (9.4% of civilian employees), Construction (8.2% of civilian employees). 78.7% of workers work in Dallas County and 18.4% of all workers work at home. 81.4% of workers are employees of private companies, which is 14.5% greater than the rate of 69.6% across the entire state of Texas.
Whole page based on the data from 2000 / 2022 when the population of Irving, Texas was 191,615 / 254,712
Whole page based on the data from 2000 / 2022 when the population of Irving, Texas was 191,615 / 254,712
Most common industries


Most common industries | Most common industries | |||||
|---|---|---|---|---|---|---|
Industry | All | Males | Females | All | Males | Females |
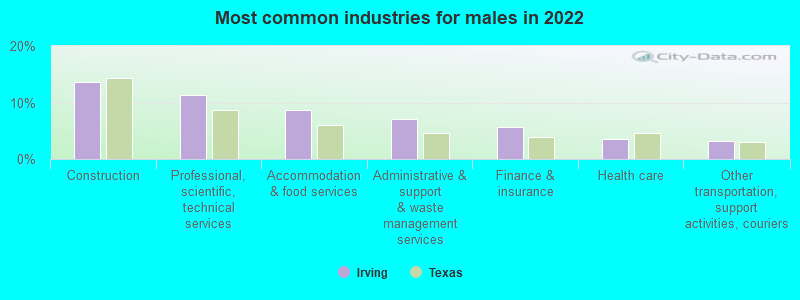
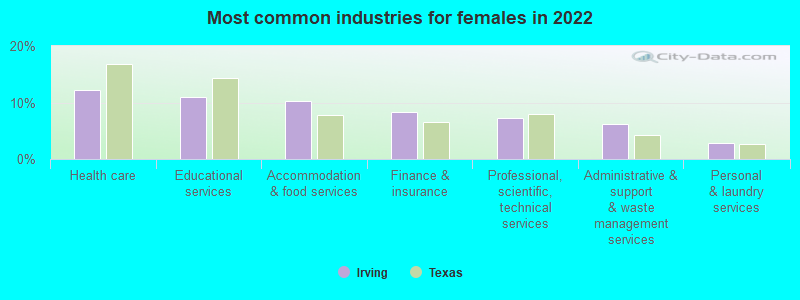
| Professional, scientific, and technical services | 9.6% (13,019) | 11.3% (8,667) | 7.3% (4,352) | 8.5% (8,872) | 8.7% (5,083) | 8.2% (3,789) |
| Accommodation and food services | 9.4% (12,741) | 8.7% (6,681) | 10.2% (6,060) | 7.9% (8,225) | 7.4% (4,320) | 8.4% (3,905) |
| Construction | 8.2% (11,203) | 13.5% (10,398) | 1.4% (805) | 8.0% (8,369) | 13.1% (7,677) | 1.5% (692) |
| Health care | 7.4% (10,041) | 3.6% (2,771) | 12.3% (7,270) | 5.3% (5,573) | 2.7% (1,561) | 8.7% (4,012) |
| Finance and insurance | 6.8% (9,254) | 5.6% (4,308) | 8.3% (4,946) | 7.0% (7,343) | 4.9% (2,863) | 9.7% (4,480) |
| Administrative and support and waste management services | 6.7% (9,168) | 7.1% (5,467) | 6.2% (3,701) | 4.9% (5,098) | 4.9% (2,842) | 4.9% (2,256) |
| Educational services | 6.5% (8,808) | 3.0% (2,305) | 11.0% (6,503) | 5.8% (6,080) | 2.8% (1,617) | 9.7% (4,463) |
| Other transportation, and support activities, and couriers | 2.8% (3,758) | 3.1% (2,403) | 2.3% (1,355) | 2.0% (2,076) | 2.4% (1,376) | 1.5% (700) |
| Food and beverage stores | 2.2% (2,945) | 2.1% (1,634) | 2.2% (1,311) | 1.6% (1,725) | 1.6% (949) | 1.7% (776) |
| Broadcasting and telecommunications | 2.1% (2,847) | 2.5% (1,897) | 1.6% (950) | 4.3% (4,534) | 4.3% (2,495) | 4.4% (2,039) |
| Truck transportation | 2.0% (2,680) | 2.8% (2,130) | 0.9% (550) | 1.7% (1,791) | 2.5% (1,478) | 0.7% (313) |
| Real estate and rental and leasing | 1.8% (2,396) | 2.3% (1,730) | 1.1% (666) | 2.8% (2,935) | 2.3% (1,329) | 3.5% (1,606) |
| Department and other general merchandise stores | 1.7% (2,280) | 1.3% (975) | 2.2% (1,305) | 1.5% (1,597) | 1.1% (650) | 2.0% (947) |
| Repair and maintenance | 1.6% (2,230) | 2.5% (1,915) | 0.5% (315) | 1.7% (1,782) | 2.8% (1,635) | 0.3% (147) |
| Public administration | 1.6% (2,193) | 1.3% (971) | 2.1% (1,222) | 1.8% (1,877) | 2.0% (1,140) | 1.6% (737) |
| Air transportation | 1.6% (2,170) | 1.4% (1,043) | 1.9% (1,127) | 1.9% (2,033) | 1.8% (1,077) | 2.1% (956) |
| Personal and laundry services | 1.5% (2,100) | 0.6% (428) | 2.8% (1,672) | 1.3% (1,378) | 0.9% (542) | 1.8% (836) |
| Computer and electronic products | 1.4% (1,901) | 1.6% (1,239) | 1.1% (662) | 2.2% (2,306) | 2.8% (1,607) | 1.5% (699) |
| Religious, grantmaking, civic, professional, and similar organizations | 1.1% (1,555) | 0.8% (576) | 1.7% (979) | 1.2% (1,222) | 0.8% (461) | 1.6% (761) |
| Food | 1.1% (1,533) | 1.3% (965) | 1.0% (568) | 0.6% (610) | 0.6% (378) | 0.5% (232) |
| Social assistance | 1.1% (1,533) | 0.3% (195) | 2.3% (1,338) | 1.3% (1,386) | 0.3% (169) | 2.6% (1,217) |
| Arts, entertainment, and recreation | 1.1% (1,518) | 1.2% (937) | 1.0% (581) | 1.2% (1,212) | 1.2% (722) | 1.1% (490) |
| Motor vehicle and parts dealers | 1.0% (1,401) | 1.4% (1,095) | 0.5% (306) | 1.3% (1,391) | 2.0% (1,145) | 0.5% (246) |
| Radio, TV, and computer stores | 0.9% (1,202) | 0.8% (641) | 0.9% (561) | 1.8% (1,850) | 2.2% (1,310) | 1.2% (540) |
| Chemicals | 0.8% (1,089) | 0.7% (500) | 1.0% (589) | 0.8% (884) | 0.8% (468) | 0.9% (416) |
| Machinery | 0.8% (1,070) | 1.2% (906) | 0.3% (164) | 0.8% (792) | 1.0% (586) | 0.4% (206) |
| Pharmacies and drug stores | 0.7% (995) | 0.4% (277) | 1.2% (718) | 0.5% (499) | 0.2% (118) | 0.8% (381) |
| Private households | 0.7% (964) | 0.0% (34) | 1.6% (930) | 0.2% (235) | 0.0% (22) | 0.5% (213) |
| Transportation equipment | 0.7% (938) | 1.0% (779) | 0.3% (159) | 1.1% (1,143) | 1.5% (869) | 0.6% (274) |
| Metal and metal products | 0.7% (928) | 1.0% (769) | 0.3% (159) | 1.0% (1,001) | 1.3% (785) | 0.5% (216) |
| Miscellaneous manufacturing | 0.7% (927) | 0.7% (550) | 0.6% (377) | 1.3% (1,410) | 1.6% (954) | 1.0% (456) |
| Groceries and related products merchant wholesalers | 0.7% (908) | 0.6% (454) | 0.8% (454) | 0.7% (735) | 0.7% (427) | 0.7% (308) |
| Utilities | 0.6% (868) | 0.8% (609) | 0.4% (259) | 0.4% (386) | 0.5% (288) | 0.2% (98) |
| Mining, quarrying, and oil and gas extraction | 0.5% (735) | 0.6% (430) | 0.5% (305) | 0.2% (192) | 0.2% (122) | 0.2% (70) |
| Clothing and accessories, including shoe, stores | 0.5% (727) | 0.3% (239) | 0.8% (488) | 0.4% (392) | 0.3% (164) | 0.5% (228) |
| Building material and garden equipment and supplies dealers | 0.5% (697) | 0.6% (473) | 0.4% (224) | 0.5% (557) | 0.7% (436) | 0.3% (121) |
| Used merchandise, gift, novelty, and souvenir, and other miscellaneous stores | 0.5% (674) | 0.5% (381) | 0.5% (293) | 0.5% (500) | 0.3% (174) | 0.7% (326) |
| Furniture and home furnishings, and household appliance stores | 0.5% (639) | 0.7% (512) | 0.2% (127) | 0.4% (458) | 0.5% (266) | 0.4% (192) |
| Data processing, libraries, and other information services | 0.4% (580) | 0.5% (369) | 0.4% (211) | 0.7% (777) | 0.8% (490) | 0.6% (287) |
| Furniture and related product manufacturing | 0.4% (560) | 0.5% (367) | 0.3% (193) | 0.3% (334) | 0.4% (227) | 0.2% (107) |
| Warehousing and storage | 0.4% (534) | 0.6% (441) | 0.2% (93) | 0.3% (283) | 0.3% (186) | 0.2% (97) |
| Nonmetallic mineral products | 0.4% (526) | 0.5% (387) | 0.2% (139) | 0.3% (333) | 0.5% (272) | 0.1% (61) |
| Miscellaneous nondurable goods merchant wholesalers | 0.4% (526) | 0.3% (224) | 0.5% (302) | 0.6% (626) | 0.5% (298) | 0.7% (328) |
| Printing and related support activities | 0.4% (516) | 0.4% (341) | 0.3% (175) | 1.2% (1,256) | 1.4% (819) | 0.9% (437) |
| Health and personal care, except drug, stores | 0.4% (508) | 0.2% (118) | 0.7% (390) | 0.4% (388) | 0.2% (90) | 0.6% (298) |
| Other direct selling establishments | 0.4% (500) | 0.3% (259) | 0.4% (241) | 0.6% (582) | 0.5% (265) | 0.7% (317) |
| U. S. Postal service | 0.4% (489) | 0.4% (310) | 0.3% (179) | 0.6% (623) | 0.7% (418) | 0.4% (205) |
| Drugs, sundries, and chemical and allied products merchant wholesalers | 0.3% (462) | 0.6% (429) | 0.1% (33) | 0.3% (264) | 0.2% (109) | 0.3% (155) |
| Sporting goods, camera, and hobby and toy stores | 0.3% (455) | 0.2% (190) | 0.4% (265) | 0.4% (411) | 0.3% (192) | 0.5% (219) |
| Electrical equipment, appliances, and components | 0.3% (442) | 0.4% (330) | 0.2% (112) | 0.3% (323) | 0.4% (246) | 0.2% (77) |
| Publishing, and motion picture and sound recording industries | 0.3% (427) | 0.4% (311) | 0.2% (116) | 0.9% (956) | 0.8% (479) | 1.0% (477) |
| Jewelry, luggage, and leather goods stores | 0.3% (424) | 0.2% (160) | 0.4% (264) | 0.4% (463) | 0.4% (225) | 0.5% (238) |
| Professional and commercial equipment and supplies merchant wholesalers | 0.3% (424) | 0.2% (129) | 0.5% (295) | 0.8% (814) | 1.0% (564) | 0.5% (250) |
| Beverage and tobacco products | 0.3% (419) | 0.3% (232) | 0.3% (187) | 0.0% (40) | 0.1% (40) | 0.0% (0) |
| Electrical and electronic goods merchant wholesalers | 0.3% (352) | 0.1% (48) | 0.5% (304) | 0.5% (558) | 0.6% (360) | 0.4% (198) |
| Motor vehicles, parts and supplies merchant wholesalers | 0.2% (340) | 0.3% (257) | 0.1% (83) | 0.2% (201) | 0.3% (171) | 0.1% (30) |
| Petroleum and petroleum products merchant wholesalers | 0.2% (329) | 0.4% (329) | 0.0% (0) | 0.1% (73) | 0.1% (46) | 0.1% (27) |
| Electronic shopping and mail-order houses | 0.2% (295) | 0.3% (225) | 0.1% (70) | 0.3% (348) | 0.3% (161) | 0.4% (187) |
| Apparel, fabrics, and notions merchant wholesalers | 0.2% (278) | 0.1% (114) | 0.3% (164) | 0.2% (158) | 0.2% (95) | 0.1% (63) |
| Alcoholic beverages merchant wholesalers | 0.2% (278) | 0.4% (278) | 0.0% (0) | 0.1% (76) | 0.1% (54) | 0.0% (22) |
| Gasoline stations | 0.2% (277) | 0.4% (277) | 0.0% (0) | 0.2% (236) | 0.3% (161) | 0.2% (75) |
| Rail transportation | 0.2% (276) | 0.3% (262) | 0.0% (14) | 0.1% (94) | 0.1% (50) | 0.1% (44) |
| Miscellaneous durable goods merchant wholesalers | 0.2% (268) | 0.1% (83) | 0.3% (185) | 0.2% (231) | 0.1% (85) | 0.3% (146) |
| Agriculture, forestry, fishing and hunting | 0.2% (237) | 0.2% (177) | 0.1% (60) | 0.1% (105) | 0.1% (64) | 0.1% (41) |
| Plastics and rubber products | 0.2% (234) | 0.2% (138) | 0.2% (96) | 0.5% (505) | 0.6% (325) | 0.4% (180) |
| Lumber and other construction materials merchant wholesalers | 0.2% (210) | 0.1% (83) | 0.2% (127) | 0.1% (107) | 0.1% (71) | 0.1% (36) |
| Petroleum and coal products | 0.2% (206) | 0.3% (206) | 0.0% (0) | 0.1% (73) | 0.1% (30) | 0.1% (43) |
| Paper and paper products merchant wholesalers | 0.1% (200) | 0.2% (188) | 0.0% (12) | 0.2% (192) | 0.1% (79) | 0.2% (113) |
| Textile mills and textile products | 0.1% (192) | 0.1% (82) | 0.2% (110) | 0.2% (197) | 0.1% (86) | 0.2% (111) |
| Apparel | 0.1% (181) | 0.0% (36) | 0.2% (145) | 0.2% (171) | 0.1% (55) | 0.3% (116) |
| Machinery, equipment, and supplies merchant wholesalers | 0.1% (174) | 0.2% (138) | 0.1% (36) | 0.6% (583) | 0.6% (374) | 0.5% (209) |
| Management of companies and enterprises | 0.1% (167) | 0.1% (67) | 0.2% (100) | 0.1% (86) | 0.0% (15) | 0.2% (71) |
| Book stores and news dealers | 0.1% (156) | 0.2% (121) | 0.1% (35) | 0.1% (135) | 0.1% (74) | 0.1% (61) |
| Paper | 0.1% (133) | 0.1% (108) | 0.0% (25) | 0.2% (245) | 0.3% (152) | 0.2% (93) |
| Fuel dealers | 0.1% (118) | 0.2% (118) | 0.0% (0) | 0.0% (30) | 0.1% (30) | 0.0% (0) |
| Metals and minerals, except petroleum, merchant wholesalers | 0.1% (112) | 0.1% (96) | 0.0% (16) | 0.1% (103) | 0.1% (61) | 0.1% (42) |
| Wood products | 0.1% (92) | 0.1% (92) | 0.0% (0) | 0.3% (307) | 0.3% (198) | 0.2% (109) |
| Hardware, plumbing and heating equipment, and supplies merchant wholesalers | 0.1% (92) | 0.1% (92) | 0.0% (0) | 0.2% (161) | 0.2% (143) | 0.0% (18) |
| Recyclable material merchant wholesalers | 0.1% (77) | 0.1% (77) | 0.0% (0) | 0.1% (88) | 0.1% (48) | 0.1% (40) |
| Office supplies and stationery stores | 0.1% (74) | 0.1% (64) | 0.0% (10) | 0.2% (252) | 0.2% (143) | 0.2% (109) |
| Music stores | 0.0% (17) | 0.0% (17) | 0.0% (0) | 0.1% (129) | 0.2% (102) | 0.1% (27) |
Unemployment in Irving
- Unemployment by race in 2022
- Unemployment rate for White non-Hispanic residents
- 1.9%Males
- 5.0%Females
- Unemployment rate for Black residents
- 7.6%Males
- 3.8%Females
- Unemployment rate for American Indian and Alaska Native residents
- 6.3%Females
- Unemployment rate for Asian residents
- 4.9%Males
- 3.6%Females
- Unemployment rate for other race residents
- 0.4%Males
- 0.7%Females
- Unemployment rate for two or more race residents
- 10.5%Males
- 1.1%Females
- Unemployment rate for Hispanic or Latino residents
- 2.4%Males
- 1.4%Females
- Unemployment by race in 2000
- Unemployment rate for White non-Hispanic residents
- 3.4%Males
- 2.6%Females
- Unemployment rate for Black residents
- 5.1%Males
- 5.2%Females
- Unemployment rate for American Indian and Alaska Native residents
- 6.0%Males
- 12.2%Females
- Unemployment rate for Asian residents
- 3.3%Males
- 5.6%Females
- Unemployment rate for other race residents
- 4.0%Males
- 9.4%Females
- Unemployment rate for two or more race residents
- 11.0%Males
- 9.6%Females
- Unemployment rate for Hispanic or Latino residents
- 4.6%Males
- 9.4%Females
Unemployment in 2023:
| Irving: | 3.1% |
| Texas: | 3.5% |
Unemployment in 2022:
| Irving: | 3.4% |
| Texas: | 3.9% |
Unemployment in 2021:
| Irving: | 5.1% |
| Texas: | 5.6% |
Unemployment in 2020:
| Irving: | 7.7% |
| Texas: | 7.7% |
Unemployment in 2019:
| Irving: | 3.2% |
| Texas: | 3.5% |
Unemployment in 2018:
| Irving: | 3.5% |
| Texas: | 3.9% |
Unemployment in 2017:
| Irving: | 3.6% |
| Texas: | 4.3% |
Unemployment in 2016:
| Irving: | 3.7% |
| Texas: | 4.6% |
Unemployment in 2015:
| Irving: | 3.9% |
| Texas: | 4.5% |
Unemployment in 2014:
| Irving: | 4.9% |
| Texas: | 5.2% |
Unemployment in 2013:
| Irving: | 6.0% |
| Texas: | 6.3% |
Unemployment in 2012:
| Irving: | 6.4% |
| Texas: | 6.7% |
Unemployment in 2011:
| Irving: | 7.7% |
| Texas: | 8.0% |
Unemployment in 2010:
| Irving: | 7.9% |
| Texas: | 8.2% |
Unemployment in 2009:
| Irving: | 7.4% |
| Texas: | 7.5% |
Unemployment in 2008:
| Irving: | 4.7% |
| Texas: | 4.9% |
Unemployment in 2007:
| Irving: | 4.0% |
| Texas: | 4.4% |
Unemployment in 2006:
| Irving: | 4.5% |
| Texas: | 5.0% |
Unemployment in 2005:
| Irving: | 5.0% |
| Texas: | 5.5% |
Unemployment in 2004:
| Irving: | 5.3% |
| Texas: | 6.0% |
Unemployment in 2003:
| Irving: | 6.0% |
| Texas: | 6.7% |
Unemployment in 2002:
| Irving: | 5.9% |
| Texas: | 6.3% |
Unemployment in 2001:
| Irving: | 4.2% |
| Texas: | 5.0% |
Unemployment in 2000:
| Irving: | 3.1% |
| Texas: | 4.4% |
Unemployment in 1999:
| Irving: | 3.0% |
| Texas: | 4.7% |
Unemployment in 1998:
| Irving: | 3.2% |
| Texas: | 5.0% |
Unemployment in 1997:
| Irving: | 3.5% |
| Texas: | 5.4% |
Unemployment in 1996:
| Irving: | 3.8% |
| Texas: | 5.8% |
Unemployment in 1995:
| Irving: | 4.3% |
| Texas: | 6.1% |
Unemployment in 1994:
| Irving: | 4.8% |
| Texas: | 6.6% |
Unemployment in 1993:
| Irving: | 5.5% |
| Texas: | 7.2% |
Unemployment in 1992:
| Irving: | 6.2% |
| Texas: | 7.7% |
Unemployment in 1991:
| Irving: | 5.4% |
| Texas: | 7.0% |
Unemployment in 1990:
| Irving: | 4.4% |
| Texas: | 6.4% |
Time leaving home to go to work
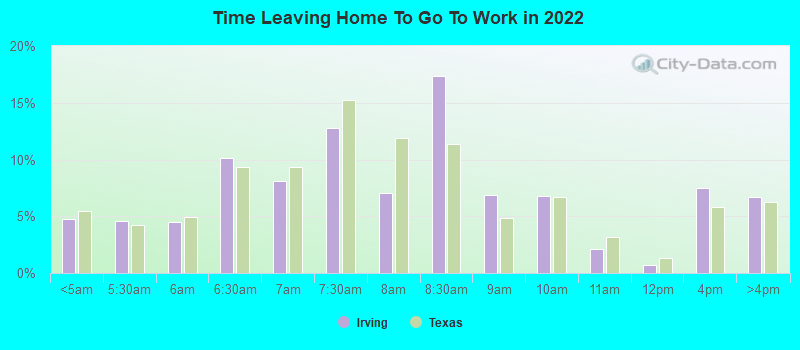
12:00 a.m. to 4:59 a.m.:
| Irving: | 4.8% (5,202) |
| Texas: | 5.5% (678,264) |
5:00 a.m. to 5:29 a.m.:
| Irving: | 4.5% (4,941) |
| Texas: | 4.3% (525,841) |
5:30 a.m. to 5:59 a.m.:
| Irving: | 4.5% (4,850) |
| Texas: | 4.9% (603,953) |
6:00 a.m. to 6:29 a.m.:
| Irving: | 10.2% (11,069) |
| Texas: | 9.4% (1,155,020) |
6:30 a.m. to 6:59 a.m.:
| Irving: | 8.1% (8,839) |
| Texas: | 9.3% (1,152,822) |
7:00 a.m. to 7:29 a.m.:
| Irving: | 12.8% (13,892) |
| Texas: | 15.3% (1,885,477) |
7:30 a.m. to 7:59 a.m.:
| Irving: | 7.1% (7,701) |
| Texas: | 11.9% (1,469,628) |
8:00 a.m. to 8:29 a.m.:
| Irving: | 17.4% (18,888) |
| Texas: | 11.3% (1,400,175) |
8:30 a.m. to 8:59 a.m.:
| Irving: | 6.8% (7,432) |
| Texas: | 4.9% (599,574) |
9:00 a.m. to 9:59 a.m.:
| Irving: | 6.8% (7,367) |
| Texas: | 6.7% (829,367) |
10:00 a.m. to 10:59 a.m.:
| Irving: | 2.1% (2,329) |
| Texas: | 3.2% (390,354) |
11:00 a.m. to 11:59 a.m.:
| Irving: | 0.7% (784) |
| Texas: | 1.3% (162,330) |
12:00 p.m. to 3:59 p.m.:
| Irving: | 7.5% (8,171) |
| Texas: | 5.8% (720,594) |
4:00 p.m. to 11:59 p.m.:
| Irving: | 6.7% (7,323) |
| Texas: | 6.3% (777,072) |

<5am:
| Irving: | 2.5% (2,617) |
| Texas: | 3.1% (281,361) |
5:30am:
| Irving: | 2.4% (2,503) |
| Texas: | 2.9% (262,060) |
6am:
| Irving: | 3.4% (3,470) |
| Texas: | 4.4% (403,423) |
6:30am:
| Irving: | 7.9% (8,089) |
| Texas: | 8.8% (808,876) |
7am:
| Irving: | 10.1% (10,354) |
| Texas: | 10.7% (976,557) |
7:30am:
| Irving: | 17.0% (17,500) |
| Texas: | 16.4% (1,500,904) |
8am:
| Irving: | 17.1% (17,559) |
| Texas: | 16.8% (1,536,308) |
8:30am:
| Irving: | 11.9% (12,212) |
| Texas: | 10.0% (913,601) |
9am:
| Irving: | 5.8% (5,979) |
| Texas: | 4.4% (398,656) |
10am:
| Irving: | 5.8% (5,989) |
| Texas: | 5.2% (472,592) |
11am:
| Irving: | 2.4% (2,428) |
| Texas: | 2.2% (197,844) |
12pm:
| Irving: | 1.0% (1,012) |
| Texas: | 0.9% (86,997) |
4pm:
| Irving: | 5.1% (5,234) |
| Texas: | 5.5% (503,565) |
>4pm:
| Irving: | 5.4% (5,521) |
| Texas: | 6.1% (563,107) |

12:00 a.m. to 4:59 a.m. - Males:
| Irving: | 5.1% (3,056) |
| Texas: | 7.0% (477,284) |
5:00 a.m. to 5:29 a.m. - Males:
| Irving: | 5.2% (3,141) |
| Texas: | 5.8% (394,876) |
5:30 a.m. to 5:59 a.m. - Males:
| Irving: | 5.3% (3,162) |
| Texas: | 5.9% (402,788) |
6:00 a.m. to 6:29 a.m. - Males:
| Irving: | 13.5% (8,080) |
| Texas: | 10.9% (751,118) |
6:30 a.m. to 6:59 a.m. - Males:
| Irving: | 7.6% (4,582) |
| Texas: | 9.5% (652,306) |
7:00 a.m. to 7:29 a.m. - Males:
| Irving: | 11.4% (6,851) |
| Texas: | 14.1% (970,598) |
7:30 a.m. to 7:59 a.m. - Males:
| Irving: | 4.7% (2,798) |
| Texas: | 10.2% (696,429) |
8:00 a.m. to 8:29 a.m. - Males:
| Irving: | 16.7% (10,038) |
| Texas: | 10.6% (729,041) |
8:30 a.m. to 8:59 a.m. - Males:
| Irving: | 6.3% (3,782) |
| Texas: | 4.1% (281,762) |
9:00 a.m. to 9:59 a.m. - Males:
| Irving: | 8.0% (4,808) |
| Texas: | 5.8% (401,071) |
10:00 a.m. to 10:59 a.m. - Males:
| Irving: | 1.2% (715) |
| Texas: | 2.7% (186,469) |
11:00 a.m. to 11:59 a.m. - Males:
| Irving: | 0.5% (277) |
| Texas: | 1.2% (82,242) |
12:00 p.m. to 3:59 p.m. - Males:
| Irving: | 7.2% (4,299) |
| Texas: | 5.8% (397,795) |
4:00 p.m. to 11:59 p.m. - Males:
| Irving: | 7.4% (4,459) |
| Texas: | 6.4% (435,950) |

12:00 a.m. to 4:59 a.m. - Females:
| Irving: | 4.4% (2,146) |
| Texas: | 3.7% (200,980) |
5:00 a.m. to 5:29 a.m. - Females:
| Irving: | 3.7% (1,800) |
| Texas: | 2.4% (130,965) |
5:30 a.m. to 5:59 a.m. - Females:
| Irving: | 3.5% (1,688) |
| Texas: | 3.7% (201,165) |
6:00 a.m. to 6:29 a.m. - Females:
| Irving: | 6.1% (2,989) |
| Texas: | 7.4% (403,902) |
6:30 a.m. to 6:59 a.m. - Females:
| Irving: | 8.7% (4,257) |
| Texas: | 9.1% (500,516) |
7:00 a.m. to 7:29 a.m. - Females:
| Irving: | 14.4% (7,041) |
| Texas: | 16.7% (914,879) |
7:30 a.m. to 7:59 a.m. - Females:
| Irving: | 10.1% (4,903) |
| Texas: | 14.1% (773,199) |
8:00 a.m. to 8:29 a.m. - Females:
| Irving: | 18.2% (8,850) |
| Texas: | 12.2% (671,134) |
8:30 a.m. to 8:59 a.m. - Females:
| Irving: | 7.5% (3,650) |
| Texas: | 5.8% (317,812) |
9:00 a.m. to 9:59 a.m. - Females:
| Irving: | 5.3% (2,559) |
| Texas: | 7.8% (428,296) |
10:00 a.m. to 10:59 a.m. - Females:
| Irving: | 3.3% (1,614) |
| Texas: | 3.7% (203,885) |
11:00 a.m. to 11:59 a.m. - Females:
| Irving: | 1.0% (507) |
| Texas: | 1.5% (80,088) |
12:00 p.m. to 3:59 p.m. - Females:
| Irving: | 7.9% (3,872) |
| Texas: | 5.9% (322,799) |
4:00 p.m. to 11:59 p.m. - Females:
| Irving: | 5.9% (2,864) |
| Texas: | 6.2% (341,122) |
Travel time to work
Percentage of workers working in this county: 78.7%
Number of people working at home: 24,610 (18.4% of all workers)
Daytime population change due to commuting: +65,184 (+34.0%)
Workers who live and work in this city: 41,574 (40.5%)
Number of people working at home: 24,610 (18.4% of all workers)
Daytime population change due to commuting: +65,184 (+34.0%)
Workers who live and work in this city: 41,574 (40.5%)

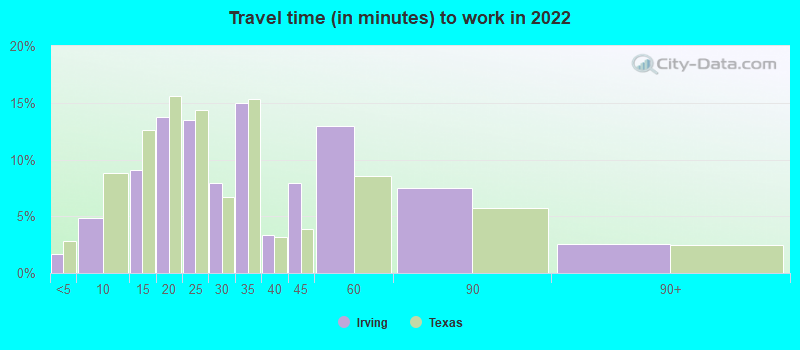

Less than 5 minutes:
| Irving: | 1.7% (2,657) |
| Texas: | 2.8% (350,462) |
5 to 9 minutes:
| Irving: | 4.8% (7,613) |
| Texas: | 8.8% (1,087,762) |
10 to 14 minutes:
| Irving: | 9.1% (14,322) |
| Texas: | 12.6% (1,550,271) |
15 to 19 minutes:
| Irving: | 13.7% (21,574) |
| Texas: | 15.6% (1,918,353) |
20 to 24 minutes:
| Irving: | 13.5% (21,243) |
| Texas: | 14.4% (1,772,079) |
25 to 29 minutes:
| Irving: | 7.9% (12,487) |
| Texas: | 6.7% (827,833) |
30 to 34 minutes:
| Irving: | 15.0% (23,598) |
| Texas: | 15.3% (1,887,878) |
35 to 39 minutes:
| Irving: | 3.3% (5,209) |
| Texas: | 3.2% (394,170) |
40 to 44 minutes:
| Irving: | 7.9% (12,469) |
| Texas: | 3.9% (476,118) |
45 to 59 minutes:
| Irving: | 12.9% (20,357) |
| Texas: | 8.6% (1,058,376) |
60 to 89 minutes:
| Irving: | 7.5% (11,717) |
| Texas: | 5.7% (706,002) |
90 or more minutes:
| Irving: | 2.5% (3,992) |
| Texas: | 2.4% (299,884) |


Less than 5 minutes:
| Irving: | 1.9% (1,938) |
| Texas: | 3.0% (277,642) |
5 to 9 minutes:
| Irving: | 7.8% (8,014) |
| Texas: | 10.3% (942,891) |
10 to 14 minutes:
| Irving: | 14.2% (14,558) |
| Texas: | 14.4% (1,317,555) |
15 to 19 minutes:
| Irving: | 18.6% (19,114) |
| Texas: | 16.0% (1,467,945) |
20 to 24 minutes:
| Irving: | 17.5% (17,982) |
| Texas: | 13.9% (1,276,781) |
25 to 29 minutes:
| Irving: | 6.6% (6,781) |
| Texas: | 5.3% (482,838) |
30 to 34 minutes:
| Irving: | 15.9% (16,290) |
| Texas: | 14.3% (1,309,699) |
35 to 39 minutes:
| Irving: | 2.2% (2,292) |
| Texas: | 2.4% (219,873) |
40 to 44 minutes:
| Irving: | 2.8% (2,857) |
| Texas: | 3.1% (280,916) |
45 to 59 minutes:
| Irving: | 5.7% (5,805) |
| Texas: | 7.6% (692,006) |
60 to 89 minutes:
| Irving: | 2.7% (2,780) |
| Texas: | 4.6% (418,905) |
90 or more minutes:
| Irving: | 2.0% (2,056) |
| Texas: | 2.4% (218,800) |

Less than 5 minutes - Males:
| Irving: | 1.5% (1,379) |
| Texas: | 2.7% (181,937) |
5 to 9 minutes - Males:
| Irving: | 3.6% (3,406) |
| Texas: | 7.6% (522,166) |
10 to 14 minutes - Males:
| Irving: | 8.4% (7,903) |
| Texas: | 11.5% (785,572) |
15 to 19 minutes - Males:
| Irving: | 12.3% (11,530) |
| Texas: | 14.6% (1,001,179) |
20 to 24 minutes - Males:
| Irving: | 13.1% (12,352) |
| Texas: | 13.9% (950,043) |
25 to 29 minutes - Males:
| Irving: | 8.0% (7,546) |
| Texas: | 6.7% (457,259) |
30 to 34 minutes - Males:
| Irving: | 16.3% (15,337) |
| Texas: | 16.2% (1,110,357) |
35 to 39 minutes - Males:
| Irving: | 3.1% (2,908) |
| Texas: | 3.3% (223,512) |
40 to 44 minutes - Males:
| Irving: | 9.2% (8,635) |
| Texas: | 4.2% (289,434) |
45 to 59 minutes - Males:
| Irving: | 14.2% (13,342) |
| Texas: | 9.3% (639,122) |
60 to 89 minutes - Males:
| Irving: | 7.3% (6,911) |
| Texas: | 6.8% (467,154) |
90 or more minutes - Males:
| Irving: | 3.0% (2,851) |
| Texas: | 3.1% (211,313) |

Less than 5 minutes - Females:
| Irving: | 2.0% (1,278) |
| Texas: | 3.1% (168,525) |
5 to 9 minutes - Females:
| Irving: | 6.7% (4,207) |
| Texas: | 10.3% (565,596) |
10 to 14 minutes - Females:
| Irving: | 10.2% (6,419) |
| Texas: | 13.9% (764,699) |
15 to 19 minutes - Females:
| Irving: | 15.9% (10,044) |
| Texas: | 16.7% (917,174) |
20 to 24 minutes - Females:
| Irving: | 14.1% (8,891) |
| Texas: | 15.0% (822,036) |
25 to 29 minutes - Females:
| Irving: | 7.8% (4,941) |
| Texas: | 6.7% (370,574) |
30 to 34 minutes - Females:
| Irving: | 13.1% (8,261) |
| Texas: | 14.2% (777,521) |
35 to 39 minutes - Females:
| Irving: | 3.6% (2,301) |
| Texas: | 3.1% (170,658) |
40 to 44 minutes - Females:
| Irving: | 6.1% (3,834) |
| Texas: | 3.4% (186,684) |
45 to 59 minutes - Females:
| Irving: | 11.1% (7,015) |
| Texas: | 7.6% (419,254) |
60 to 89 minutes - Females:
| Irving: | 7.6% (4,806) |
| Texas: | 4.4% (238,848) |
90 or more minutes - Females:
| Irving: | 1.8% (1,141) |
| Texas: | 1.6% (88,571) |
Means of transportation to work
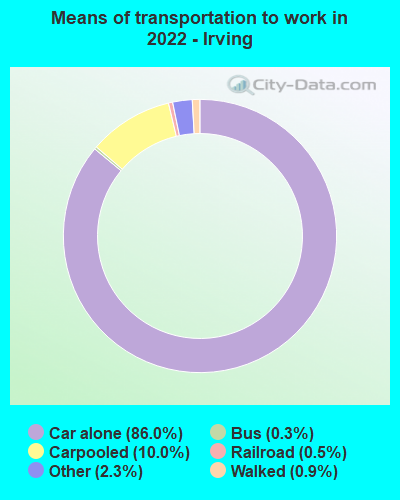

Drove car alone:
| Irving: | 86.0% (135,218) |
| Texas: | 83.3% (4,557,023) |
Carpooled:
| Irving: | 10.0% (15,688) |
| Texas: | 11.7% (674,818) |
Bus:
| Irving: | 0.3% (498) |
| Texas: | 0.9% (50,435) |
Light rail, streetcar or trolley:
| Irving: | 0.5% (737) |
| Texas: | 0.1% (2,519) |
Bicycle:
| Irving: | 0.1% (113) |
| Texas: | 0.2% (7,954) |
Walked:
| Irving: | 0.9% (1,350) |
| Texas: | 1.7% (99,911) |
Other means:
| Irving: | 2.3% (3,634) |
| Texas: | 2.0% (95,481) |


Drove car alone:
| Irving: | 77.9% (80,048) |
| Texas: | 77.7% (7,115,590) |
Carpooled:
| Irving: | 14.7% (15,065) |
| Texas: | 14.5% (1,326,012) |
Bus or trolley bus:
| Irving: | 1.6% (1,638) |
| Texas: | 1.7% (157,014) |
Streetcar or trolley car:
| Irving: | 0.0% (34) |
| Texas: | 0.0% (1,669) |
Subway or elevated:
| Irving: | 0.1% (119) |
| Texas: | 0.0% (2,371) |
Railroad:
| Irving: | 0.4% (389) |
| Texas: | 0.0% (2,374) |
Ferryboat:
| Irving: | 0.0% (28) |
| Texas: | 0.0% (738) |
Taxicab:
| Irving: | 0.2% (189) |
| Texas: | 0.1% (6,102) |
Motorcycle:
| Irving: | 0.1% (132) |
| Texas: | 0.1% (12,068) |
Bicycle:
| Irving: | 0.1% (153) |
| Texas: | 0.2% (21,551) |
Walked:
| Irving: | 1.7% (1,769) |
| Texas: | 1.9% (173,670) |
Other means:
| Irving: | 0.9% (903) |
| Texas: | 0.9% (86,692) |


Drove car alone - Males:
| Irving: | 85.8% (80,704) |
| Texas: | 83.6% (4,557,023) |
Carpooled - Males:
| Irving: | 9.6% (9,027) |
| Texas: | 11.2% (674,818) |
Bus - Males:
| Irving: | 0.3% (295) |
| Texas: | 0.8% (50,435) |
Light rail, streetcar or trolley - Males:
| Irving: | 0.8% (737) |
| Texas: | 0.1% (2,519) |
Bicycle - Males:
| Irving: | 0.0% (44) |
| Texas: | 0.3% (7,954) |
Walked - Males:
| Irving: | 0.6% (560) |
| Texas: | 1.7% (99,911) |
Other means - Males:
| Irving: | 2.9% (2,733) |
| Texas: | 2.2% (95,481) |


Drove car alone - Females:
| Irving: | 86.3% (54,514) |
| Texas: | 83.0% (4,557,023) |
Carpooled - Females:
| Irving: | 10.5% (6,661) |
| Texas: | 12.3% (674,818) |
Bus - Females:
| Irving: | 0.3% (203) |
| Texas: | 0.9% (50,435) |
Bicycle - Females:
| Irving: | 0.1% (69) |
| Texas: | 0.1% (7,954) |
Walked - Females:
| Irving: | 1.3% (790) |
| Texas: | 1.8% (99,911) |
Other means - Females:
| Irving: | 1.4% (901) |
| Texas: | 1.7% (95,481) |
Private vehicle occupancy

Drove alone:
| Irving: | 88.1% (90,792) |
| Texas: | 87.6% (10,283,021) |
In 2 person carpool:
| Irving: | 8.3% (8,532) |
| Texas: | 9.0% (1,052,595) |
In 3 person carpool:
| Irving: | 1.4% (1,441) |
| Texas: | 2.1% (244,139) |
In 4 person carpool:
| Irving: | 1.8% (1,809) |
| Texas: | 0.8% (92,732) |
In 5-6 person carpool:
| Irving: | 0.4% (388) |
| Texas: | 0.4% (44,947) |
In 7+ person carpool:
| Irving: | 0.1% (88) |
| Texas: | 0.1% (16,725) |

Drove alone:
| Irving: | 84.2% (80,048) |
| Texas: | 84.3% (7,115,590) |
In 2 person carpool:
| Irving: | 11.5% (10,958) |
| Texas: | 11.6% (982,994) |
In 3 person carpool:
| Irving: | 2.4% (2,253) |
| Texas: | 2.4% (201,602) |
In 4 person carpool:
| Irving: | 1.1% (1,077) |
| Texas: | 1.0% (83,518) |
In 5-6 person carpool:
| Irving: | 0.5% (517) |
| Texas: | 0.5% (40,662) |
In 7+ person carpool:
| Irving: | 0.3% (260) |
| Texas: | 0.2% (17,236) |
Class of workers
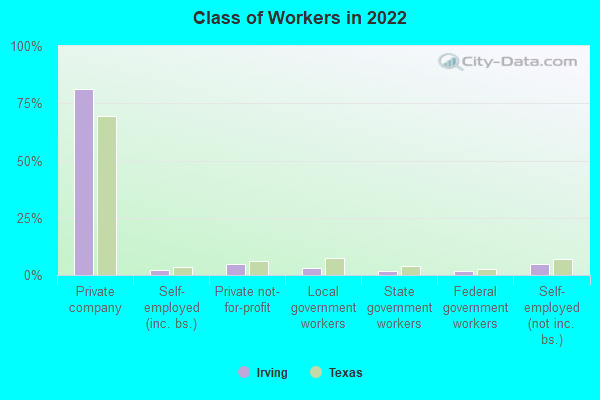
Employee of private company:
| Irving: | 81.4% (110,819) |
| Texas: | 69.6% (10,139,666) |
Self-employed in own incorporated business:
| Irving: | 2.2% (3,036) |
| Texas: | 3.5% (516,446) |
Private not-for-profit wage and salary workers:
| Irving: | 4.7% (6,396) |
| Texas: | 6.0% (870,454) |
Local government workers:
| Irving: | 3.2% (4,378) |
| Texas: | 7.6% (1,109,799) |
State government workers:
| Irving: | 1.8% (2,448) |
| Texas: | 3.8% (558,618) |
Federal government workers:
| Irving: | 1.7% (2,266) |
| Texas: | 2.5% (357,298) |
Self-employed workers in own not incorporated business:
| Irving: | 5.0% (6,752) |
| Texas: | 6.8% (998,270) |
Unpaid family workers:
| Irving: | 0.0% (59) |
| Texas: | 0.2% (27,882) |

Employee of private company:
| Irving: | 81.5% (85,221) |
| Texas: | 69.6% (6,425,274) |
Self-employed in own incorporated business:
| Irving: | 2.3% (2,450) |
| Texas: | 2.7% (250,864) |
Private not-for-profit wage and salary workers:
| Irving: | 4.1% (4,273) |
| Texas: | 5.7% (526,631) |
Local government workers:
| Irving: | 4.6% (4,804) |
| Texas: | 6.6% (608,479) |
State government workers:
| Irving: | 1.7% (1,757) |
| Texas: | 5.4% (501,082) |
Federal government workers:
| Irving: | 1.4% (1,486) |
| Texas: | 2.6% (237,177) |
Self-employed workers in own not incorporated business:
| Irving: | 4.2% (4,422) |
| Texas: | 7.1% (653,527) |
Unpaid family workers:
| Irving: | 0.2% (204) |
| Texas: | 0.3% (31,338) |

Employee of private company - Males:
| Irving: | 82.6% (62,407) |
| Texas: | 73.1% (5,788,450) |
Self-employed in own incorporated business - Males:
| Irving: | 2.4% (1,779) |
| Texas: | 4.2% (332,655) |
Private not-for-profit wage and salary workers - Males:
| Irving: | 3.1% (2,309) |
| Texas: | 4.1% (323,476) |
Local government workers - Males:
| Irving: | 1.9% (1,445) |
| Texas: | 5.1% (405,467) |
State government workers - Males:
| Irving: | 1.7% (1,295) |
| Texas: | 3.0% (236,706) |
Federal government workers - Males:
| Irving: | 2.2% (1,634) |
| Texas: | 2.7% (211,629) |
Self-employed workers in own not incorporated business - Males:
| Irving: | 6.1% (4,613) |
| Texas: | 7.7% (609,246) |
Unpaid family workers - Males:
| Irving: | 0.1% (59) |
| Texas: | 0.2% (12,606) |

Employee of private company - Females:
| Irving: | 79.9% (48,412) |
| Texas: | 65.4% (4,351,216) |
Self-employed in own incorporated business - Females:
| Irving: | 2.1% (1,257) |
| Texas: | 2.8% (183,791) |
Private not-for-profit wage and salary workers - Females:
| Irving: | 6.7% (4,087) |
| Texas: | 8.2% (546,978) |
Local government workers - Females:
| Irving: | 4.8% (2,933) |
| Texas: | 10.6% (704,332) |
State government workers - Females:
| Irving: | 1.9% (1,153) |
| Texas: | 4.8% (321,912) |
Federal government workers - Females:
| Irving: | 1.0% (632) |
| Texas: | 2.2% (145,669) |
Self-employed workers in own not incorporated business - Females:
| Irving: | 3.5% (2,139) |
| Texas: | 5.8% (389,024) |