Work and Jobs in Honolulu, Hawaii (HI) Detailed Stats
Occupations, Industries, Unemployment, Workers, Commute

Recent posts about work in Honolulu, Hawaii on our local forum with over 2,400,000 registered users:
 | Social Worker/Social Service Jobs on Maui & Kauai (8 replies) |
| IT/network administration jobs in Honolulu? (3 replies) |
| Salaries and Cost of Living for Honolulu (9 replies) |
| Possible move to Honolulu (42 replies) |
| Does Honolulu do a good job of "feeling" like a big city (12 replies) |
| Looking for a social work job (14 replies) |
Latest news about work in Honolulu, HI collected exclusively by city-data.com from local newspapers, TV, and radio stations
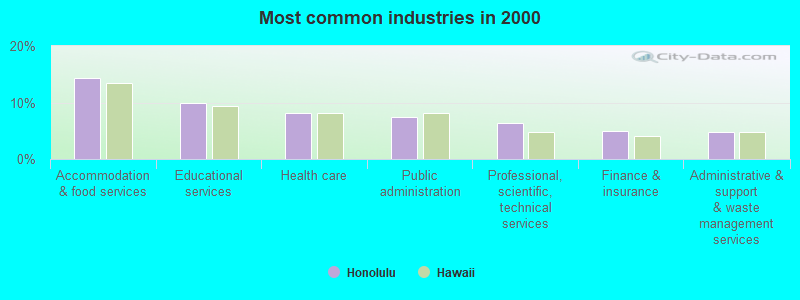
The most common industries in Honolulu are: Accommodation & food services (14.3% of civilian employees), Educational services (10.0% of civilian employees), Health care (8.1% of civilian employees). 61.6% of workers are employees of private companies, which is about the same as the rate of 61.1% across the entire state of Hawaii.
Most common industries
Most common industries | |||
|---|---|---|---|
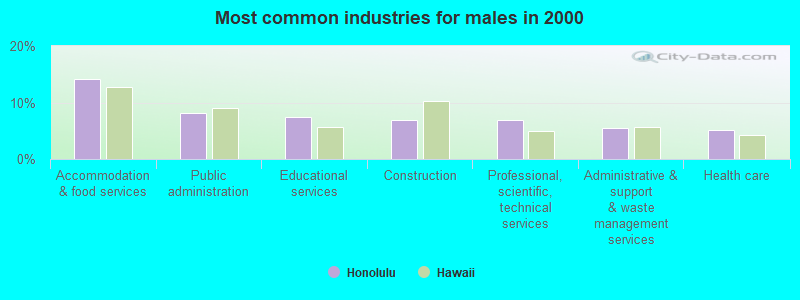
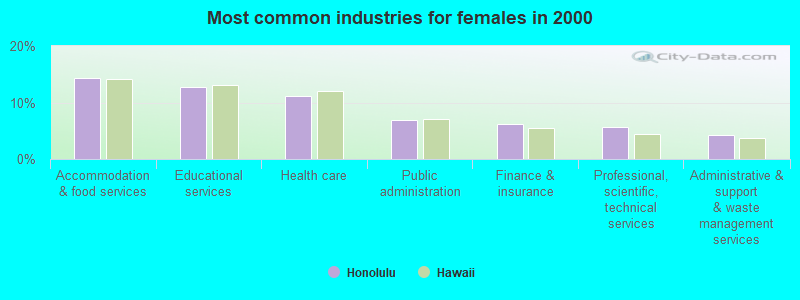
Industry | All | Males | Females |
| Accommodation and food services | 14.3% (24,272) | 14.2% (12,460) | 14.3% (11,812) |
| Educational services | 10.0% (16,964) | 7.4% (6,467) | 12.7% (10,497) |
| Health care | 8.1% (13,698) | 5.1% (4,487) | 11.2% (9,211) |
| Public administration | 7.5% (12,747) | 8.1% (7,071) | 6.9% (5,676) |
| Professional, scientific, and technical services | 6.4% (10,797) | 6.9% (6,064) | 5.7% (4,733) |
| Finance and insurance | 5.0% (8,528) | 3.9% (3,444) | 6.2% (5,084) |
| Administrative and support and waste management services | 4.9% (8,268) | 5.4% (4,769) | 4.2% (3,499) |
| Construction | 4.1% (6,945) | 7.0% (6,092) | 1.0% (853) |
| Real estate and rental and leasing | 3.1% (5,335) | 3.5% (3,093) | 2.7% (2,242) |
| Arts, entertainment, and recreation | 2.3% (3,828) | 2.7% (2,361) | 1.8% (1,467) |
| Other transportation, and support activities, and couriers | 2.1% (3,627) | 3.3% (2,896) | 0.9% (731) |
| Food and beverage stores | 2.0% (3,327) | 1.9% (1,689) | 2.0% (1,638) |
| Air transportation | 1.9% (3,294) | 1.9% (1,701) | 1.9% (1,593) |
| Personal and laundry services | 1.7% (2,942) | 1.1% (930) | 2.4% (2,012) |
| Clothing and accessories, including shoe, stores | 1.7% (2,850) | 1.1% (945) | 2.3% (1,905) |
| Department and other general merchandise stores | 1.5% (2,574) | 1.0% (875) | 2.1% (1,699) |
| Religious, grantmaking, civic, professional, and similar organizations | 1.5% (2,552) | 1.3% (1,120) | 1.7% (1,432) |
| Broadcasting and telecommunications | 1.4% (2,410) | 1.4% (1,235) | 1.4% (1,175) |
| Social assistance | 1.2% (2,080) | 0.4% (384) | 2.1% (1,696) |
| Used merchandise, gift, novelty, and souvenir, and other miscellaneous stores | 1.2% (2,022) | 0.9% (784) | 1.5% (1,238) |
| Repair and maintenance | 1.2% (1,998) | 1.8% (1,572) | 0.5% (426) |
| Publishing, and motion picture and sound recording industries | 1.1% (1,856) | 1.4% (1,183) | 0.8% (673) |
| Jewelry, luggage, and leather goods stores | 1.0% (1,615) | 0.6% (501) | 1.4% (1,114) |
| Other direct selling establishments | 0.9% (1,555) | 0.6% (488) | 1.3% (1,067) |
| Motor vehicle and parts dealers | 0.9% (1,476) | 1.3% (1,156) | 0.4% (320) |
| Food | 0.8% (1,430) | 1.0% (880) | 0.7% (550) |
| Groceries and related products merchant wholesalers | 0.8% (1,320) | 1.0% (862) | 0.6% (458) |
| Utilities | 0.7% (1,165) | 0.9% (828) | 0.4% (337) |
| Agriculture, forestry, fishing and hunting | 0.7% (1,139) | 0.9% (781) | 0.4% (358) |
| Pharmacies and drug stores | 0.5% (921) | 0.5% (395) | 0.6% (526) |
| Miscellaneous nondurable goods merchant wholesalers | 0.5% (866) | 0.5% (481) | 0.5% (385) |
| Transportation equipment | 0.5% (821) | 0.9% (765) | 0.1% (56) |
| Data processing, libraries, and other information services | 0.5% (820) | 0.5% (458) | 0.4% (362) |
| Miscellaneous manufacturing | 0.5% (813) | 0.5% (473) | 0.4% (340) |
| Apparel | 0.5% (785) | 0.2% (161) | 0.8% (624) |
| U. S. Postal service | 0.4% (762) | 0.6% (524) | 0.3% (238) |
| Radio, TV, and computer stores | 0.4% (740) | 0.6% (509) | 0.3% (231) |
| Sporting goods, camera, and hobby and toy stores | 0.4% (688) | 0.4% (381) | 0.4% (307) |
| Building material and garden equipment and supplies dealers | 0.4% (653) | 0.5% (421) | 0.3% (232) |
| Furniture and home furnishings, and household appliance stores | 0.4% (606) | 0.4% (370) | 0.3% (236) |
| Printing and related support activities | 0.3% (591) | 0.5% (404) | 0.2% (187) |
| Truck transportation | 0.3% (547) | 0.5% (471) | 0.1% (76) |
| Gasoline stations | 0.3% (506) | 0.4% (345) | 0.2% (161) |
| Private households | 0.3% (479) | 0.1% (91) | 0.5% (388) |
| Health and personal care, except drug, stores | 0.3% (467) | 0.2% (204) | 0.3% (263) |
| Miscellaneous durable goods merchant wholesalers | 0.3% (425) | 0.2% (208) | 0.3% (217) |
| Professional and commercial equipment and supplies merchant wholesalers | 0.2% (385) | 0.3% (291) | 0.1% (94) |
| Retail florists | 0.2% (337) | 0.1% (126) | 0.3% (211) |
| Electrical and electronic goods merchant wholesalers | 0.2% (303) | 0.2% (188) | 0.1% (115) |
| Machinery, equipment, and supplies merchant wholesalers | 0.2% (299) | 0.2% (215) | 0.1% (84) |
| Book stores and news dealers | 0.2% (290) | 0.1% (61) | 0.3% (229) |
| Drugs, sundries, and chemical and allied products merchant wholesalers | 0.2% (287) | 0.2% (155) | 0.2% (132) |
| Office supplies and stationery stores | 0.2% (287) | 0.2% (171) | 0.1% (116) |
| Motor vehicles, parts and supplies merchant wholesalers | 0.2% (285) | 0.3% (245) | 0.0% (40) |
| Apparel, fabrics, and notions merchant wholesalers | 0.1% (234) | 0.2% (140) | 0.1% (94) |
| Beverage and tobacco products | 0.1% (191) | 0.1% (117) | 0.1% (74) |
| Paper and paper products merchant wholesalers | 0.1% (177) | 0.1% (112) | 0.1% (65) |
| Computer and electronic products | 0.1% (172) | 0.2% (132) | 0.0% (40) |
| Music stores | 0.1% (170) | 0.1% (82) | 0.1% (88) |
| Hardware, plumbing and heating equipment, and supplies merchant wholesalers | 0.1% (165) | 0.1% (118) | 0.1% (47) |
| Alcoholic beverages merchant wholesalers | 0.1% (153) | 0.1% (129) | 0.0% (24) |
| Furniture and related product manufacturing | 0.1% (151) | 0.1% (116) | 0.0% (35) |
| Metal and metal products | 0.1% (150) | 0.1% (129) | 0.0% (21) |
| Nonmetallic mineral products | 0.1% (139) | 0.1% (94) | 0.1% (45) |
| Petroleum and coal products | 0.1% (131) | 0.1% (97) | 0.0% (34) |
| Warehousing and storage | 0.1% (124) | 0.1% (101) | 0.0% (23) |
| Lumber and other construction materials merchant wholesalers | 0.1% (117) | 0.1% (96) | 0.0% (21) |
Unemployment in Honolulu
- Unemployment by race in 2000
- Unemployment rate for White non-Hispanic residents
- 7.2%Males
- 5.6%Females
- Unemployment rate for Black residents
- 12.7%Males
- 13.1%Females
- Unemployment rate for American Indian and Alaska Native residents
- 6.1%Females
- Unemployment rate for Asian residents
- 5.4%Males
- 3.8%Females
- Unemployment rate for other race residents
- 12.0%Males
- 8.8%Females
- Unemployment rate for two or more race residents
- 8.1%Males
- 6.2%Females
- Unemployment rate for Hispanic or Latino residents
- 8.2%Males
- 8.1%Females
Time leaving home to go to work

<5am:
| Honolulu: | 3.3% (5,671) |
| Hawaii: | 4.3% (24,484) |
5:30am:
| Honolulu: | 3.3% (5,746) |
| Hawaii: | 4.9% (27,476) |
6am:
| Honolulu: | 5.2% (8,939) |
| Hawaii: | 7.7% (43,322) |
6:30am:
| Honolulu: | 9.8% (16,984) |
| Hawaii: | 11.6% (65,360) |
7am:
| Honolulu: | 11.2% (19,415) |
| Hawaii: | 12.0% (67,419) |
7:30am:
| Honolulu: | 15.4% (26,601) |
| Hawaii: | 14.5% (81,910) |
8am:
| Honolulu: | 12.1% (20,983) |
| Hawaii: | 10.7% (60,043) |
8:30am:
| Honolulu: | 8.4% (14,608) |
| Hawaii: | 6.9% (39,062) |
9am:
| Honolulu: | 4.5% (7,775) |
| Hawaii: | 3.4% (19,353) |
10am:
| Honolulu: | 6.4% (11,067) |
| Hawaii: | 4.6% (26,106) |
11am:
| Honolulu: | 2.8% (4,904) |
| Hawaii: | 2.2% (12,599) |
12pm:
| Honolulu: | 1.3% (2,196) |
| Hawaii: | 1.1% (6,027) |
4pm:
| Honolulu: | 6.8% (11,796) |
| Hawaii: | 6.7% (37,483) |
>4pm:
| Honolulu: | 6.4% (11,048) |
| Hawaii: | 5.7% (32,314) |
Travel time to work
Daytime population change due to commuting: +93,305 (+25.1%)
Workers who live and work in this place: 147,888 (85.5%)
Workers who live and work in this place: 147,888 (85.5%)


Less than 5 minutes:
| Honolulu: | 1.5% (2,548) |
| Hawaii: | 2.6% (14,748) |
5 to 9 minutes:
| Honolulu: | 8.1% (13,995) |
| Hawaii: | 9.6% (54,341) |
10 to 14 minutes:
| Honolulu: | 15.9% (27,455) |
| Hawaii: | 13.7% (77,207) |
15 to 19 minutes:
| Honolulu: | 19.2% (33,185) |
| Hawaii: | 14.5% (81,891) |
20 to 24 minutes:
| Honolulu: | 16.4% (28,455) |
| Hawaii: | 13.4% (75,329) |
25 to 29 minutes:
| Honolulu: | 5.2% (9,077) |
| Hawaii: | 5.0% (28,106) |
30 to 34 minutes:
| Honolulu: | 16.4% (28,367) |
| Hawaii: | 15.5% (87,508) |
35 to 39 minutes:
| Honolulu: | 1.7% (2,912) |
| Hawaii: | 2.1% (12,088) |
40 to 44 minutes:
| Honolulu: | 2.8% (4,921) |
| Hawaii: | 3.5% (19,539) |
45 to 59 minutes:
| Honolulu: | 5.2% (9,075) |
| Hawaii: | 8.5% (48,025) |
60 to 89 minutes:
| Honolulu: | 3.2% (5,541) |
| Hawaii: | 5.6% (31,296) |
90 or more minutes:
| Honolulu: | 1.3% (2,202) |
| Hawaii: | 2.3% (12,880) |
Means of transportation to work

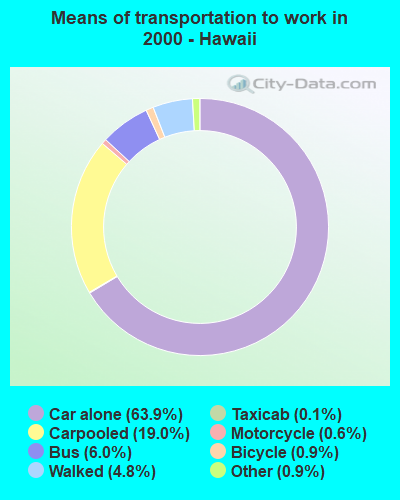
Drove car alone:
| Honolulu: | 57.7% (99,890) |
| Hawaii: | 63.9% (359,916) |
Carpooled:
| Honolulu: | 18.1% (31,283) |
| Hawaii: | 19.0% (107,191) |
Bus or trolley bus:
| Honolulu: | 11.3% (19,536) |
| Hawaii: | 6.0% (34,022) |
Streetcar or trolley car:
| Honolulu: | 0.0% (24) |
| Hawaii: | 0.0% (56) |
Subway or elevated:
| Honolulu: | 0.0% (66) |
| Hawaii: | 0.0% (122) |
Railroad:
| Honolulu: | 0.0% (17) |
| Hawaii: | 0.0% (66) |
Taxicab:
| Honolulu: | 0.3% (518) |
| Hawaii: | 0.1% (798) |
Motorcycle:
| Honolulu: | 0.9% (1,537) |
| Hawaii: | 0.6% (3,254) |
Bicycle:
| Honolulu: | 1.2% (2,155) |
| Hawaii: | 0.9% (4,888) |
Walked:
| Honolulu: | 6.6% (11,404) |
| Hawaii: | 4.8% (27,134) |
Other means:
| Honolulu: | 0.8% (1,303) |
| Hawaii: | 0.9% (5,207) |
Private vehicle occupancy

Drove alone:
| Honolulu: | 76.2% (99,890) |
| Hawaii: | 77.1% (359,916) |
In 2 person carpool:
| Honolulu: | 18.7% (24,540) |
| Hawaii: | 17.1% (80,034) |
In 3 person carpool:
| Honolulu: | 3.6% (4,676) |
| Hawaii: | 3.8% (17,627) |
In 4 person carpool:
| Honolulu: | 1.1% (1,492) |
| Hawaii: | 1.3% (6,277) |
In 5-6 person carpool:
| Honolulu: | 0.4% (466) |
| Hawaii: | 0.5% (2,391) |
In 7+ person carpool:
| Honolulu: | 0.1% (109) |
| Hawaii: | 0.2% (862) |
Class of workers

Employee of private company:
| Honolulu: | 61.6% (104,762) |
| Hawaii: | 61.1% (328,465) |
Self-employed in own incorporated business:
| Honolulu: | 4.0% (6,767) |
| Hawaii: | 3.2% (17,161) |
Private not-for-profit wage and salary workers:
| Honolulu: | 7.2% (12,222) |
| Hawaii: | 6.7% (35,980) |
Local government workers:
| Honolulu: | 2.8% (4,720) |
| Hawaii: | 3.5% (18,685) |
State government workers:
| Honolulu: | 11.3% (19,181) |
| Hawaii: | 11.2% (60,085) |
Federal government workers:
| Honolulu: | 5.3% (9,041) |
| Hawaii: | 6.4% (34,229) |
Self-employed workers in own not incorporated business:
| Honolulu: | 7.4% (12,632) |
| Hawaii: | 7.6% (41,109) |
Unpaid family workers:
| Honolulu: | 0.4% (657) |
| Hawaii: | 0.4% (2,195) |

Employee of private company - Males:
| Honolulu: | 61.5% (53,831) |
| Hawaii: | 62.1% (171,831) |
Self-employed in own incorporated business - Males:
| Honolulu: | 5.4% (4,710) |
| Hawaii: | 4.3% (11,812) |
Private not-for-profit wage and salary workers - Males:
| Honolulu: | 5.2% (4,565) |
| Hawaii: | 4.6% (12,779) |
Local government workers - Males:
| Honolulu: | 3.4% (2,938) |
| Hawaii: | 4.3% (11,954) |
State government workers - Males:
| Honolulu: | 9.0% (7,899) |
| Hawaii: | 7.9% (21,739) |
Federal government workers - Males:
| Honolulu: | 6.6% (5,801) |
| Hawaii: | 7.7% (21,221) |
Self-employed workers in own not incorporated business - Males:
| Honolulu: | 8.6% (7,567) |
| Hawaii: | 8.8% (24,193) |
Unpaid family workers - Males:
| Honolulu: | 0.3% (219) |
| Hawaii: | 0.3% (954) |

Employee of private company - Females:
| Honolulu: | 61.8% (50,931) |
| Hawaii: | 59.9% (156,634) |
Self-employed in own incorporated business - Females:
| Honolulu: | 2.5% (2,057) |
| Hawaii: | 2.0% (5,349) |
Private not-for-profit wage and salary workers - Females:
| Honolulu: | 9.3% (7,657) |
| Hawaii: | 8.9% (23,201) |
Local government workers - Females:
| Honolulu: | 2.2% (1,782) |
| Hawaii: | 2.6% (6,731) |
State government workers - Females:
| Honolulu: | 13.7% (11,282) |
| Hawaii: | 14.7% (38,346) |
Federal government workers - Females:
| Honolulu: | 3.9% (3,240) |
| Hawaii: | 5.0% (13,008) |
Self-employed workers in own not incorporated business - Females:
| Honolulu: | 6.1% (5,065) |
| Hawaii: | 6.5% (16,916) |
Unpaid family workers - Females:
| Honolulu: | 0.5% (438) |
| Hawaii: | 0.5% (1,241) |