Work and Jobs in Georgetown, Texas (TX) Detailed Stats
Occupations, Industries, Unemployment, Workers, Commute
Settings
X


Recent posts about work in Georgetown, Texas on our local forum with over 2,400,000 registered users:
 | Texas Republicans want statewide elections to be decided by counties. (118 replies) |
| Info on Belton, Harrell, Georgetown (8 replies) |
| Houston's economic diversity Thread .. (1259 replies) |
| Live in Round Rock/Georgetown? Job is in Killeen. (12 replies) |
| Job is in Killeen - live in Round Rock or Georgetown? (10 replies) |
| Liberty Hill vs Georgetown - new construction (9 replies) |
Latest news about work in Georgetown, TX collected exclusively by city-data.com from local newspapers, TV, and radio stations
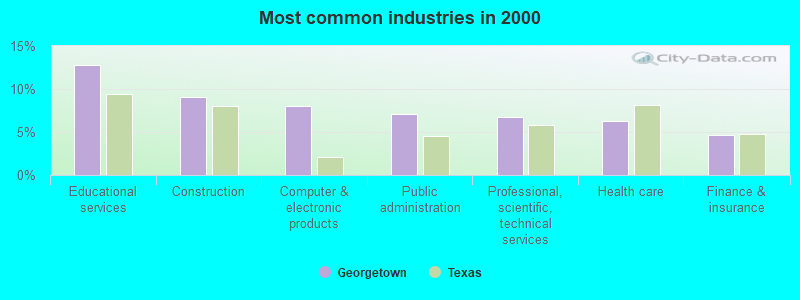
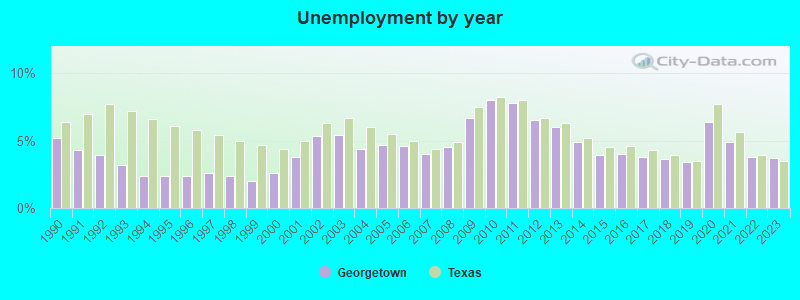
The unemployment rate in 2023 in Georgetown, TX was 3.7%, which was 5.4% greater than the unemployment rate of 3.5% across the entire state of Texas. Compared to the unemployment rate of 6.0% in 2013, this represents a decrease of 62.2%. The most common industries in Georgetown are: Educational services (12.8% of civilian employees), Construction (9.1% of civilian employees), Computer & electronic products (8.0% of civilian employees). 74.3% of workers work in Williamson County and 18.7% of all workers work at home. 65.5% of workers are employees of private companies, which is 6.2% less than the rate of 69.6% across the entire state of Texas.
Whole page based on the data from 2000 / 2022 when the population of Georgetown, Texas was 28,339 / 86,505
Whole page based on the data from 2000 / 2022 when the population of Georgetown, Texas was 28,339 / 86,505
Most common industries
Most common industries | |||
|---|---|---|---|
Industry | All | Males | Females |
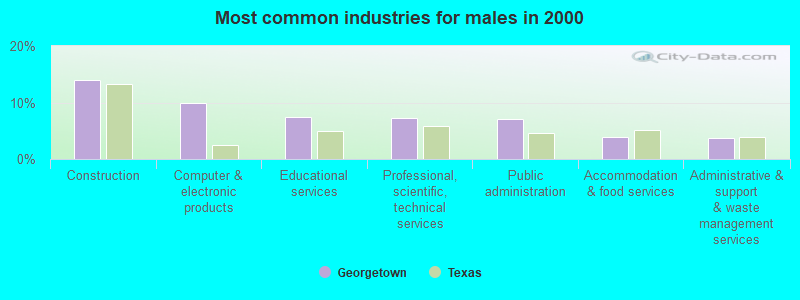
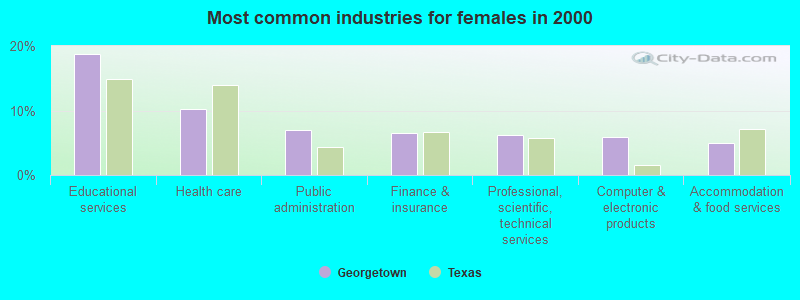
| Educational services | 12.8% (1,638) | 7.5% (507) | 18.7% (1,131) |
| Construction | 9.1% (1,163) | 14.0% (950) | 3.5% (213) |
| Computer and electronic products | 8.0% (1,026) | 9.9% (669) | 5.9% (357) |
| Public administration | 7.1% (905) | 7.2% (485) | 7.0% (420) |
| Professional, scientific, and technical services | 6.7% (862) | 7.2% (489) | 6.2% (373) |
| Health care | 6.3% (801) | 2.6% (179) | 10.3% (622) |
| Finance and insurance | 4.7% (602) | 3.1% (207) | 6.5% (395) |
| Accommodation and food services | 4.4% (567) | 3.9% (267) | 5.0% (300) |
| Administrative and support and waste management services | 3.8% (481) | 3.8% (257) | 3.7% (224) |
| Food and beverage stores | 2.6% (338) | 2.7% (184) | 2.6% (154) |
| Real estate and rental and leasing | 2.6% (328) | 2.1% (144) | 3.0% (184) |
| Social assistance | 2.4% (303) | 0.6% (39) | 4.4% (264) |
| Repair and maintenance | 1.8% (235) | 3.0% (205) | 0.5% (30) |
| Broadcasting and telecommunications | 1.4% (173) | 1.6% (105) | 1.1% (68) |
| Department and other general merchandise stores | 1.3% (169) | 0.9% (62) | 1.8% (107) |
| Motor vehicle and parts dealers | 1.3% (165) | 2.0% (134) | 0.5% (31) |
| Miscellaneous manufacturing | 1.2% (156) | 1.2% (83) | 1.2% (73) |
| Religious, grantmaking, civic, professional, and similar organizations | 1.1% (146) | 0.7% (47) | 1.6% (99) |
| Personal and laundry services | 1.1% (140) | 0.5% (35) | 1.7% (105) |
| Truck transportation | 1.1% (137) | 1.4% (95) | 0.7% (42) |
| Arts, entertainment, and recreation | 1.0% (130) | 1.1% (72) | 1.0% (58) |
| Printing and related support activities | 0.9% (112) | 1.2% (84) | 0.5% (28) |
| Radio, TV, and computer stores | 0.8% (105) | 0.8% (57) | 0.8% (48) |
| Building material and garden equipment and supplies dealers | 0.8% (104) | 1.2% (82) | 0.4% (22) |
| Utilities | 0.7% (96) | 1.4% (96) | 0.0% (0) |
| Metal and metal products | 0.7% (93) | 1.1% (74) | 0.3% (19) |
| Used merchandise, gift, novelty, and souvenir, and other miscellaneous stores | 0.7% (84) | 0.7% (49) | 0.6% (35) |
| Other transportation, and support activities, and couriers | 0.6% (82) | 1.0% (65) | 0.3% (17) |
| Pharmacies and drug stores | 0.6% (81) | 0.4% (28) | 0.9% (53) |
| Mining, quarrying, and oil and gas extraction | 0.6% (79) | 1.2% (79) | 0.0% (0) |
| U. S. Postal service | 0.6% (77) | 0.5% (34) | 0.7% (43) |
| Publishing, and motion picture and sound recording industries | 0.6% (76) | 0.7% (48) | 0.5% (28) |
| Data processing, libraries, and other information services | 0.6% (73) | 0.4% (26) | 0.8% (47) |
| Electrical and electronic goods merchant wholesalers | 0.5% (66) | 0.5% (37) | 0.5% (29) |
| Agriculture, forestry, fishing and hunting | 0.5% (65) | 0.8% (51) | 0.2% (14) |
| Other direct selling establishments | 0.5% (65) | 0.5% (35) | 0.5% (30) |
| Groceries and related products merchant wholesalers | 0.5% (64) | 0.9% (58) | 0.1% (6) |
| Food | 0.5% (63) | 0.9% (58) | 0.1% (5) |
| Machinery | 0.5% (63) | 0.5% (36) | 0.4% (27) |
| Furniture and home furnishings, and household appliance stores | 0.5% (58) | 0.6% (43) | 0.2% (15) |
| Plastics and rubber products | 0.4% (56) | 0.4% (30) | 0.4% (26) |
| Electrical equipment, appliances, and components | 0.4% (53) | 0.7% (44) | 0.1% (9) |
| Clothing and accessories, including shoe, stores | 0.4% (49) | 0.4% (28) | 0.3% (21) |
| Machinery, equipment, and supplies merchant wholesalers | 0.4% (47) | 0.4% (27) | 0.3% (20) |
| Wood products | 0.3% (42) | 0.6% (42) | 0.0% (0) |
| Lumber and other construction materials merchant wholesalers | 0.3% (42) | 0.6% (42) | 0.0% (0) |
| Furniture and related product manufacturing | 0.3% (35) | 0.5% (35) | 0.0% (0) |
| Gasoline stations | 0.3% (35) | 0.5% (35) | 0.0% (0) |
| Private households | 0.3% (33) | 0.0% (3) | 0.5% (30) |
| Chemicals | 0.2% (31) | 0.1% (10) | 0.3% (21) |
| Sporting goods, camera, and hobby and toy stores | 0.2% (29) | 0.3% (17) | 0.2% (12) |
| Electronic shopping and mail-order houses | 0.2% (29) | 0.0% (0) | 0.5% (29) |
| Health and personal care, except drug, stores | 0.2% (27) | 0.1% (5) | 0.4% (22) |
| Professional and commercial equipment and supplies merchant wholesalers | 0.2% (27) | 0.4% (27) | 0.0% (0) |
| Jewelry, luggage, and leather goods stores | 0.2% (25) | 0.1% (6) | 0.3% (19) |
| Transportation equipment | 0.2% (24) | 0.1% (10) | 0.2% (14) |
| Sewing, needlework, and piece goods stores | 0.2% (22) | 0.1% (5) | 0.3% (17) |
| Hardware, plumbing and heating equipment, and supplies merchant wholesalers | 0.2% (22) | 0.1% (8) | 0.2% (14) |
| Alcoholic beverages merchant wholesalers | 0.2% (20) | 0.3% (20) | 0.0% (0) |
| Motor vehicles, parts and supplies merchant wholesalers | 0.2% (20) | 0.3% (20) | 0.0% (0) |
| Petroleum and coal products | 0.1% (17) | 0.3% (17) | 0.0% (0) |
| Drugs, sundries, and chemical and allied products merchant wholesalers | 0.1% (17) | 0.3% (17) | 0.0% (0) |
| Petroleum and petroleum products merchant wholesalers | 0.1% (17) | 0.3% (17) | 0.0% (0) |
| Air transportation | 0.1% (16) | 0.2% (16) | 0.0% (0) |
| Retail florists | 0.1% (14) | 0.1% (9) | 0.1% (5) |
| Miscellaneous nondurable goods merchant wholesalers | 0.1% (14) | 0.1% (5) | 0.1% (9) |
| Vending machine operators | 0.1% (8) | 0.1% (8) | 0.0% (0) |
Unemployment in Georgetown
- Unemployment by race in 2022
- Unemployment rate for White non-Hispanic residents
- 1.5%Males
- 2.0%Females
- Unemployment rate for Black residents
- 7.8%Males
- 10.7%Females
- Unemployment rate for Asian residents
- 2.7%Females
- Unemployment rate for other race residents
- 0.3%Females
- Unemployment rate for two or more race residents
- 5.9%Males
- 2.1%Females
- Unemployment rate for Hispanic or Latino residents
- 2.8%Males
- 2.1%Females
- Unemployment by race in 2000
- Unemployment rate for White non-Hispanic residents
- 2.3%Males
- 1.9%Females
- Unemployment rate for Black residents
- 15.0%Males
- 4.1%Females
- Unemployment rate for other race residents
- 3.1%Males
- 13.9%Females
- Unemployment rate for two or more race residents
- 17.9%Males
- 4.0%Females
- Unemployment rate for Hispanic or Latino residents
- 3.3%Males
- 8.1%Females
Unemployment in 2023:
| Georgetown: | 3.7% |
| Texas: | 3.5% |
Unemployment in 2022:
| Georgetown: | 3.8% |
| Texas: | 3.9% |
Unemployment in 2021:
| Georgetown: | 4.9% |
| Texas: | 5.6% |
Unemployment in 2020:
| Georgetown: | 6.4% |
| Texas: | 7.7% |
Unemployment in 2019:
| Georgetown: | 3.4% |
| Texas: | 3.5% |
Unemployment in 2018:
| Georgetown: | 3.6% |
| Texas: | 3.9% |
Unemployment in 2017:
| Georgetown: | 3.8% |
| Texas: | 4.3% |
Unemployment in 2016:
| Georgetown: | 4.0% |
| Texas: | 4.6% |
Unemployment in 2015:
| Georgetown: | 3.9% |
| Texas: | 4.5% |
Unemployment in 2014:
| Georgetown: | 4.9% |
| Texas: | 5.2% |
Unemployment in 2013:
| Georgetown: | 6.0% |
| Texas: | 6.3% |
Unemployment in 2012:
| Georgetown: | 6.5% |
| Texas: | 6.7% |
Unemployment in 2011:
| Georgetown: | 7.8% |
| Texas: | 8.0% |
Unemployment in 2010:
| Georgetown: | 8.0% |
| Texas: | 8.2% |
Unemployment in 2009:
| Georgetown: | 6.7% |
| Texas: | 7.5% |
Unemployment in 2008:
| Georgetown: | 4.5% |
| Texas: | 4.9% |
Unemployment in 2007:
| Georgetown: | 4.0% |
| Texas: | 4.4% |
Unemployment in 2006:
| Georgetown: | 4.6% |
| Texas: | 5.0% |
Unemployment in 2005:
| Georgetown: | 4.7% |
| Texas: | 5.5% |
Unemployment in 2004:
| Georgetown: | 4.4% |
| Texas: | 6.0% |
Unemployment in 2003:
| Georgetown: | 5.4% |
| Texas: | 6.7% |
Unemployment in 2002:
| Georgetown: | 5.3% |
| Texas: | 6.3% |
Unemployment in 2001:
| Georgetown: | 3.8% |
| Texas: | 5.0% |
Unemployment in 2000:
| Georgetown: | 2.6% |
| Texas: | 4.4% |
Unemployment in 1999:
| Georgetown: | 2.0% |
| Texas: | 4.7% |
Unemployment in 1998:
| Georgetown: | 2.4% |
| Texas: | 5.0% |
Unemployment in 1997:
| Georgetown: | 2.6% |
| Texas: | 5.4% |
Unemployment in 1996:
| Georgetown: | 2.4% |
| Texas: | 5.8% |
Unemployment in 1995:
| Georgetown: | 2.4% |
| Texas: | 6.1% |
Unemployment in 1994:
| Georgetown: | 2.4% |
| Texas: | 6.6% |
Unemployment in 1993:
| Georgetown: | 3.2% |
| Texas: | 7.2% |
Unemployment in 1992:
| Georgetown: | 3.9% |
| Texas: | 7.7% |
Unemployment in 1991:
| Georgetown: | 4.3% |
| Texas: | 7.0% |
Unemployment in 1990:
| Georgetown: | 5.2% |
| Texas: | 6.4% |
Time leaving home to go to work
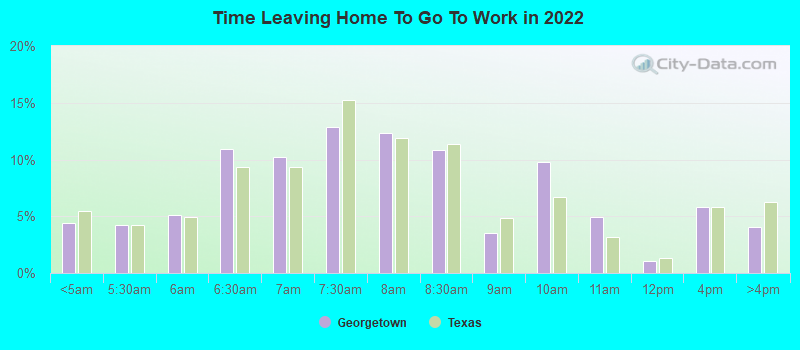
12:00 a.m. to 4:59 a.m.:
| Georgetown: | 4.4% (1,363) |
| Texas: | 5.5% (678,264) |
5:00 a.m. to 5:29 a.m.:
| Georgetown: | 4.3% (1,328) |
| Texas: | 4.3% (525,841) |
5:30 a.m. to 5:59 a.m.:
| Georgetown: | 5.1% (1,596) |
| Texas: | 4.9% (603,953) |
6:00 a.m. to 6:29 a.m.:
| Georgetown: | 11.0% (3,412) |
| Texas: | 9.4% (1,155,020) |
6:30 a.m. to 6:59 a.m.:
| Georgetown: | 10.2% (3,173) |
| Texas: | 9.3% (1,152,822) |
7:00 a.m. to 7:29 a.m.:
| Georgetown: | 12.8% (3,992) |
| Texas: | 15.3% (1,885,477) |
7:30 a.m. to 7:59 a.m.:
| Georgetown: | 12.4% (3,852) |
| Texas: | 11.9% (1,469,628) |
8:00 a.m. to 8:29 a.m.:
| Georgetown: | 10.8% (3,362) |
| Texas: | 11.3% (1,400,175) |
8:30 a.m. to 8:59 a.m.:
| Georgetown: | 3.5% (1,088) |
| Texas: | 4.9% (599,574) |
9:00 a.m. to 9:59 a.m.:
| Georgetown: | 9.7% (3,033) |
| Texas: | 6.7% (829,367) |
10:00 a.m. to 10:59 a.m.:
| Georgetown: | 4.9% (1,528) |
| Texas: | 3.2% (390,354) |
11:00 a.m. to 11:59 a.m.:
| Georgetown: | 1.1% (327) |
| Texas: | 1.3% (162,330) |
12:00 p.m. to 3:59 p.m.:
| Georgetown: | 5.8% (1,809) |
| Texas: | 5.8% (720,594) |
4:00 p.m. to 11:59 p.m.:
| Georgetown: | 4.1% (1,263) |
| Texas: | 6.3% (777,072) |

<5am:
| Georgetown: | 1.9% (242) |
| Texas: | 3.1% (281,361) |
5:30am:
| Georgetown: | 3.2% (411) |
| Texas: | 2.9% (262,060) |
6am:
| Georgetown: | 4.0% (502) |
| Texas: | 4.4% (403,423) |
6:30am:
| Georgetown: | 9.7% (1,226) |
| Texas: | 8.8% (808,876) |
7am:
| Georgetown: | 11.0% (1,394) |
| Texas: | 10.7% (976,557) |
7:30am:
| Georgetown: | 14.6% (1,853) |
| Texas: | 16.4% (1,500,904) |
8am:
| Georgetown: | 17.7% (2,250) |
| Texas: | 16.8% (1,536,308) |
8:30am:
| Georgetown: | 9.6% (1,214) |
| Texas: | 10.0% (913,601) |
9am:
| Georgetown: | 4.8% (606) |
| Texas: | 4.4% (398,656) |
10am:
| Georgetown: | 4.7% (596) |
| Texas: | 5.2% (472,592) |
11am:
| Georgetown: | 1.9% (241) |
| Texas: | 2.2% (197,844) |
12pm:
| Georgetown: | 1.0% (125) |
| Texas: | 0.9% (86,997) |
4pm:
| Georgetown: | 5.3% (675) |
| Texas: | 5.5% (503,565) |
>4pm:
| Georgetown: | 6.6% (838) |
| Texas: | 6.1% (563,107) |

12:00 a.m. to 4:59 a.m. - Males:
| Georgetown: | 5.9% (972) |
| Texas: | 7.0% (477,284) |
5:00 a.m. to 5:29 a.m. - Males:
| Georgetown: | 7.6% (1,239) |
| Texas: | 5.8% (394,876) |
5:30 a.m. to 5:59 a.m. - Males:
| Georgetown: | 8.7% (1,421) |
| Texas: | 5.9% (402,788) |
6:00 a.m. to 6:29 a.m. - Males:
| Georgetown: | 12.6% (2,058) |
| Texas: | 10.9% (751,118) |
6:30 a.m. to 6:59 a.m. - Males:
| Georgetown: | 9.7% (1,592) |
| Texas: | 9.5% (652,306) |
7:00 a.m. to 7:29 a.m. - Males:
| Georgetown: | 10.3% (1,679) |
| Texas: | 14.1% (970,598) |
7:30 a.m. to 7:59 a.m. - Males:
| Georgetown: | 8.0% (1,314) |
| Texas: | 10.2% (696,429) |
8:00 a.m. to 8:29 a.m. - Males:
| Georgetown: | 9.2% (1,513) |
| Texas: | 10.6% (729,041) |
8:30 a.m. to 8:59 a.m. - Males:
| Georgetown: | 0.5% (90) |
| Texas: | 4.1% (281,762) |
9:00 a.m. to 9:59 a.m. - Males:
| Georgetown: | 9.7% (1,581) |
| Texas: | 5.8% (401,071) |
10:00 a.m. to 10:59 a.m. - Males:
| Georgetown: | 5.1% (839) |
| Texas: | 2.7% (186,469) |
11:00 a.m. to 11:59 a.m. - Males:
| Georgetown: | 0.5% (84) |
| Texas: | 1.2% (82,242) |
12:00 p.m. to 3:59 p.m. - Males:
| Georgetown: | 7.0% (1,144) |
| Texas: | 5.8% (397,795) |
4:00 p.m. to 11:59 p.m. - Males:
| Georgetown: | 5.2% (851) |
| Texas: | 6.4% (435,950) |

12:00 a.m. to 4:59 a.m. - Females:
| Georgetown: | 2.7% (391) |
| Texas: | 3.7% (200,980) |
5:00 a.m. to 5:29 a.m. - Females:
| Georgetown: | 0.6% (89) |
| Texas: | 2.4% (130,965) |
5:30 a.m. to 5:59 a.m. - Females:
| Georgetown: | 1.2% (175) |
| Texas: | 3.7% (201,165) |
6:00 a.m. to 6:29 a.m. - Females:
| Georgetown: | 9.2% (1,354) |
| Texas: | 7.4% (403,902) |
6:30 a.m. to 6:59 a.m. - Females:
| Georgetown: | 10.7% (1,581) |
| Texas: | 9.1% (500,516) |
7:00 a.m. to 7:29 a.m. - Females:
| Georgetown: | 15.7% (2,313) |
| Texas: | 16.7% (914,879) |
7:30 a.m. to 7:59 a.m. - Females:
| Georgetown: | 17.2% (2,538) |
| Texas: | 14.1% (773,199) |
8:00 a.m. to 8:29 a.m. - Females:
| Georgetown: | 12.5% (1,849) |
| Texas: | 12.2% (671,134) |
8:30 a.m. to 8:59 a.m. - Females:
| Georgetown: | 6.8% (998) |
| Texas: | 5.8% (317,812) |
9:00 a.m. to 9:59 a.m. - Females:
| Georgetown: | 9.8% (1,452) |
| Texas: | 7.8% (428,296) |
10:00 a.m. to 10:59 a.m. - Females:
| Georgetown: | 4.7% (689) |
| Texas: | 3.7% (203,885) |
11:00 a.m. to 11:59 a.m. - Females:
| Georgetown: | 1.6% (243) |
| Texas: | 1.5% (80,088) |
12:00 p.m. to 3:59 p.m. - Females:
| Georgetown: | 4.5% (665) |
| Texas: | 5.9% (322,799) |
4:00 p.m. to 11:59 p.m. - Females:
| Georgetown: | 2.8% (412) |
| Texas: | 6.2% (341,122) |
Travel time to work
Percentage of workers working in this county: 74.3%
Number of people working at home: 6,328 (18.7% of all workers)
Daytime population change due to commuting: +1,327 (+4.7%)
Workers who live and work in this city: 5,487 (43.2%)
Number of people working at home: 6,328 (18.7% of all workers)
Daytime population change due to commuting: +1,327 (+4.7%)
Workers who live and work in this city: 5,487 (43.2%)

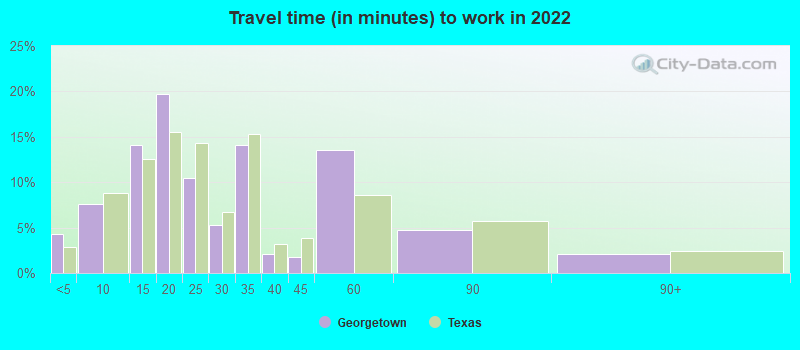

Less than 5 minutes:
| Georgetown: | 4.3% (1,259) |
| Texas: | 2.8% (350,462) |
5 to 9 minutes:
| Georgetown: | 7.6% (2,246) |
| Texas: | 8.8% (1,087,762) |
10 to 14 minutes:
| Georgetown: | 14.1% (4,160) |
| Texas: | 12.6% (1,550,271) |
15 to 19 minutes:
| Georgetown: | 19.7% (5,806) |
| Texas: | 15.6% (1,918,353) |
20 to 24 minutes:
| Georgetown: | 10.5% (3,089) |
| Texas: | 14.4% (1,772,079) |
25 to 29 minutes:
| Georgetown: | 5.3% (1,570) |
| Texas: | 6.7% (827,833) |
30 to 34 minutes:
| Georgetown: | 14.0% (4,138) |
| Texas: | 15.3% (1,887,878) |
35 to 39 minutes:
| Georgetown: | 2.1% (623) |
| Texas: | 3.2% (394,170) |
40 to 44 minutes:
| Georgetown: | 1.8% (529) |
| Texas: | 3.9% (476,118) |
45 to 59 minutes:
| Georgetown: | 13.6% (3,997) |
| Texas: | 8.6% (1,058,376) |
60 to 89 minutes:
| Georgetown: | 4.8% (1,406) |
| Texas: | 5.7% (706,002) |
90 or more minutes:
| Georgetown: | 2.1% (630) |
| Texas: | 2.4% (299,884) |


Less than 5 minutes:
| Georgetown: | 4.0% (502) |
| Texas: | 3.0% (277,642) |
5 to 9 minutes:
| Georgetown: | 14.5% (1,837) |
| Texas: | 10.3% (942,891) |
10 to 14 minutes:
| Georgetown: | 15.8% (2,007) |
| Texas: | 14.4% (1,317,555) |
15 to 19 minutes:
| Georgetown: | 11.9% (1,512) |
| Texas: | 16.0% (1,467,945) |
20 to 24 minutes:
| Georgetown: | 6.7% (847) |
| Texas: | 13.9% (1,276,781) |
25 to 29 minutes:
| Georgetown: | 3.5% (442) |
| Texas: | 5.3% (482,838) |
30 to 34 minutes:
| Georgetown: | 13.8% (1,756) |
| Texas: | 14.3% (1,309,699) |
35 to 39 minutes:
| Georgetown: | 2.6% (331) |
| Texas: | 2.4% (219,873) |
40 to 44 minutes:
| Georgetown: | 4.5% (575) |
| Texas: | 3.1% (280,916) |
45 to 59 minutes:
| Georgetown: | 11.7% (1,490) |
| Texas: | 7.6% (692,006) |
60 to 89 minutes:
| Georgetown: | 5.4% (680) |
| Texas: | 4.6% (418,905) |
90 or more minutes:
| Georgetown: | 1.5% (194) |
| Texas: | 2.4% (218,800) |

Less than 5 minutes - Males:
| Georgetown: | 7.3% (1,047) |
| Texas: | 2.7% (181,937) |
5 to 9 minutes - Males:
| Georgetown: | 5.4% (769) |
| Texas: | 7.6% (522,166) |
10 to 14 minutes - Males:
| Georgetown: | 14.4% (2,071) |
| Texas: | 11.5% (785,572) |
15 to 19 minutes - Males:
| Georgetown: | 18.8% (2,688) |
| Texas: | 14.6% (1,001,179) |
20 to 24 minutes - Males:
| Georgetown: | 9.6% (1,381) |
| Texas: | 13.9% (950,043) |
25 to 29 minutes - Males:
| Georgetown: | 2.8% (398) |
| Texas: | 6.7% (457,259) |
30 to 34 minutes - Males:
| Georgetown: | 13.9% (1,989) |
| Texas: | 16.2% (1,110,357) |
35 to 39 minutes - Males:
| Georgetown: | 2.3% (326) |
| Texas: | 3.3% (223,512) |
40 to 44 minutes - Males:
| Georgetown: | 3.2% (460) |
| Texas: | 4.2% (289,434) |
45 to 59 minutes - Males:
| Georgetown: | 12.9% (1,847) |
| Texas: | 9.3% (639,122) |
60 to 89 minutes - Males:
| Georgetown: | 5.8% (837) |
| Texas: | 6.8% (467,154) |
90 or more minutes - Males:
| Georgetown: | 3.6% (520) |
| Texas: | 3.1% (211,313) |

Less than 5 minutes - Females:
| Georgetown: | 1.4% (212) |
| Texas: | 3.1% (168,525) |
5 to 9 minutes - Females:
| Georgetown: | 9.8% (1,477) |
| Texas: | 10.3% (565,596) |
10 to 14 minutes - Females:
| Georgetown: | 13.8% (2,089) |
| Texas: | 13.9% (764,699) |
15 to 19 minutes - Females:
| Georgetown: | 20.6% (3,118) |
| Texas: | 16.7% (917,174) |
20 to 24 minutes - Females:
| Georgetown: | 11.3% (1,708) |
| Texas: | 15.0% (822,036) |
25 to 29 minutes - Females:
| Georgetown: | 7.8% (1,172) |
| Texas: | 6.7% (370,574) |
30 to 34 minutes - Females:
| Georgetown: | 14.2% (2,149) |
| Texas: | 14.2% (777,521) |
35 to 39 minutes - Females:
| Georgetown: | 2.0% (297) |
| Texas: | 3.1% (170,658) |
40 to 44 minutes - Females:
| Georgetown: | 0.5% (69) |
| Texas: | 3.4% (186,684) |
45 to 59 minutes - Females:
| Georgetown: | 14.2% (2,150) |
| Texas: | 7.6% (419,254) |
60 to 89 minutes - Females:
| Georgetown: | 3.8% (569) |
| Texas: | 4.4% (238,848) |
90 or more minutes - Females:
| Georgetown: | 0.7% (110) |
| Texas: | 1.6% (88,571) |
Means of transportation to work
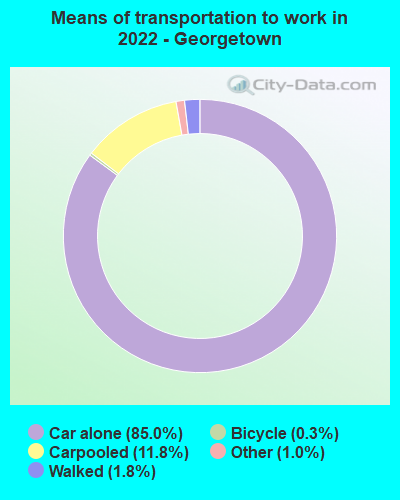

Drove car alone:
| Georgetown: | 85.0% (28,707) |
| Texas: | 83.3% (4,557,023) |
Carpooled:
| Georgetown: | 11.8% (3,977) |
| Texas: | 11.7% (674,818) |
Bus:
| Georgetown: | 0.0% (11) |
| Texas: | 0.9% (50,435) |
Ferryboat:
| Georgetown: | 0.0% (13) |
| Texas: | 0.0% (456) |
Bicycle:
| Georgetown: | 0.3% (99) |
| Texas: | 0.2% (7,954) |
Walked:
| Georgetown: | 1.8% (596) |
| Texas: | 1.7% (99,911) |
Other means:
| Georgetown: | 1.0% (353) |
| Texas: | 2.0% (95,481) |


Drove car alone:
| Georgetown: | 79.6% (10,104) |
| Texas: | 77.7% (7,115,590) |
Carpooled:
| Georgetown: | 11.3% (1,431) |
| Texas: | 14.5% (1,326,012) |
Bus or trolley bus:
| Georgetown: | 0.1% (12) |
| Texas: | 1.7% (157,014) |
Motorcycle:
| Georgetown: | 0.2% (23) |
| Texas: | 0.1% (12,068) |
Bicycle:
| Georgetown: | 0.4% (56) |
| Texas: | 0.2% (21,551) |
Walked:
| Georgetown: | 3.5% (441) |
| Texas: | 1.9% (173,670) |
Other means:
| Georgetown: | 0.8% (106) |
| Texas: | 0.9% (86,692) |


Drove car alone - Males:
| Georgetown: | 83.4% (14,424) |
| Texas: | 83.6% (4,557,023) |
Carpooled - Males:
| Georgetown: | 12.8% (2,206) |
| Texas: | 11.2% (674,818) |
Bicycle - Males:
| Georgetown: | 0.4% (75) |
| Texas: | 0.3% (7,954) |
Walked - Males:
| Georgetown: | 2.0% (338) |
| Texas: | 1.7% (99,911) |
Other means - Males:
| Georgetown: | 1.5% (261) |
| Texas: | 2.2% (95,481) |


Drove car alone - Females:
| Georgetown: | 86.7% (14,224) |
| Texas: | 83.0% (4,557,023) |
Carpooled - Females:
| Georgetown: | 10.8% (1,772) |
| Texas: | 12.3% (674,818) |
Bus - Females:
| Georgetown: | 0.1% (11) |
| Texas: | 0.9% (50,435) |
Ferryboat - Females:
| Georgetown: | 0.1% (12) |
| Texas: | 0.0% (456) |
Bicycle - Females:
| Georgetown: | 0.2% (25) |
| Texas: | 0.1% (7,954) |
Walked - Females:
| Georgetown: | 1.6% (259) |
| Texas: | 1.8% (99,911) |
Other means - Females:
| Georgetown: | 0.6% (95) |
| Texas: | 1.7% (95,481) |
Private vehicle occupancy

Drove alone:
| Georgetown: | 89.2% (21,522) |
| Texas: | 87.6% (10,283,021) |
In 2 person carpool:
| Georgetown: | 8.5% (2,058) |
| Texas: | 9.0% (1,052,595) |
In 3 person carpool:
| Georgetown: | 1.4% (346) |
| Texas: | 2.1% (244,139) |
In 4 person carpool:
| Georgetown: | 0.1% (36) |
| Texas: | 0.8% (92,732) |
In 5-6 person carpool:
| Georgetown: | 0.7% (174) |
| Texas: | 0.4% (44,947) |

Drove alone:
| Georgetown: | 87.6% (10,104) |
| Texas: | 84.3% (7,115,590) |
In 2 person carpool:
| Georgetown: | 8.5% (984) |
| Texas: | 11.6% (982,994) |
In 3 person carpool:
| Georgetown: | 1.3% (153) |
| Texas: | 2.4% (201,602) |
In 4 person carpool:
| Georgetown: | 1.4% (156) |
| Texas: | 1.0% (83,518) |
In 5-6 person carpool:
| Georgetown: | 0.8% (97) |
| Texas: | 0.5% (40,662) |
In 7+ person carpool:
| Georgetown: | 0.4% (41) |
| Texas: | 0.2% (17,236) |
Class of workers
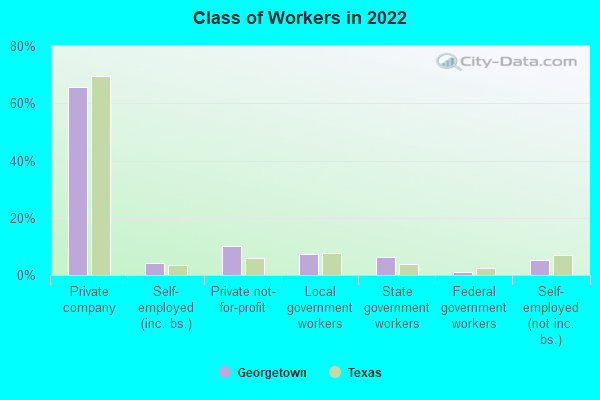
Employee of private company:
| Georgetown: | 65.5% (27,242) |
| Texas: | 69.6% (10,139,666) |
Self-employed in own incorporated business:
| Georgetown: | 4.3% (1,785) |
| Texas: | 3.5% (516,446) |
Private not-for-profit wage and salary workers:
| Georgetown: | 10.0% (4,146) |
| Texas: | 6.0% (870,454) |
Local government workers:
| Georgetown: | 7.4% (3,082) |
| Texas: | 7.6% (1,109,799) |
State government workers:
| Georgetown: | 6.5% (2,685) |
| Texas: | 3.8% (558,618) |
Federal government workers:
| Georgetown: | 0.9% (365) |
| Texas: | 2.5% (357,298) |
Self-employed workers in own not incorporated business:
| Georgetown: | 5.3% (2,183) |
| Texas: | 6.8% (998,270) |
Unpaid family workers:
| Georgetown: | 0.2% (89) |
| Texas: | 0.2% (27,882) |

Employee of private company:
| Georgetown: | 64.5% (8,263) |
| Texas: | 69.6% (6,425,274) |
Self-employed in own incorporated business:
| Georgetown: | 1.6% (204) |
| Texas: | 2.7% (250,864) |
Private not-for-profit wage and salary workers:
| Georgetown: | 8.3% (1,062) |
| Texas: | 5.7% (526,631) |
Local government workers:
| Georgetown: | 8.6% (1,096) |
| Texas: | 6.6% (608,479) |
State government workers:
| Georgetown: | 6.0% (771) |
| Texas: | 5.4% (501,082) |
Federal government workers:
| Georgetown: | 1.8% (233) |
| Texas: | 2.6% (237,177) |
Self-employed workers in own not incorporated business:
| Georgetown: | 8.9% (1,138) |
| Texas: | 7.1% (653,527) |
Unpaid family workers:
| Georgetown: | 0.3% (35) |
| Texas: | 0.3% (31,338) |

Employee of private company - Males:
| Georgetown: | 68.3% (14,199) |
| Texas: | 73.1% (5,788,450) |
Self-employed in own incorporated business - Males:
| Georgetown: | 5.2% (1,087) |
| Texas: | 4.2% (332,655) |
Private not-for-profit wage and salary workers - Males:
| Georgetown: | 9.0% (1,879) |
| Texas: | 4.1% (323,476) |
Local government workers - Males:
| Georgetown: | 4.0% (825) |
| Texas: | 5.1% (405,467) |
State government workers - Males:
| Georgetown: | 6.8% (1,405) |
| Texas: | 3.0% (236,706) |
Federal government workers - Males:
| Georgetown: | 1.2% (256) |
| Texas: | 2.7% (211,629) |
Self-employed workers in own not incorporated business - Males:
| Georgetown: | 5.0% (1,037) |
| Texas: | 7.7% (609,246) |
Unpaid family workers - Males:
| Georgetown: | 0.4% (89) |
| Texas: | 0.2% (12,606) |

Employee of private company - Females:
| Georgetown: | 62.7% (13,043) |
| Texas: | 65.4% (4,351,216) |
Self-employed in own incorporated business - Females:
| Georgetown: | 3.4% (698) |
| Texas: | 2.8% (183,791) |
Private not-for-profit wage and salary workers - Females:
| Georgetown: | 10.9% (2,267) |
| Texas: | 8.2% (546,978) |
Local government workers - Females:
| Georgetown: | 10.9% (2,257) |
| Texas: | 10.6% (704,332) |
State government workers - Females:
| Georgetown: | 6.2% (1,280) |
| Texas: | 4.8% (321,912) |
Federal government workers - Females:
| Georgetown: | 0.5% (109) |
| Texas: | 2.2% (145,669) |
Self-employed workers in own not incorporated business - Females:
| Georgetown: | 5.5% (1,146) |
| Texas: | 5.8% (389,024) |