Work and Jobs in Elsinore Valley, California (CA) Detailed Stats
Occupations, Industries, Unemployment, Workers, Commute
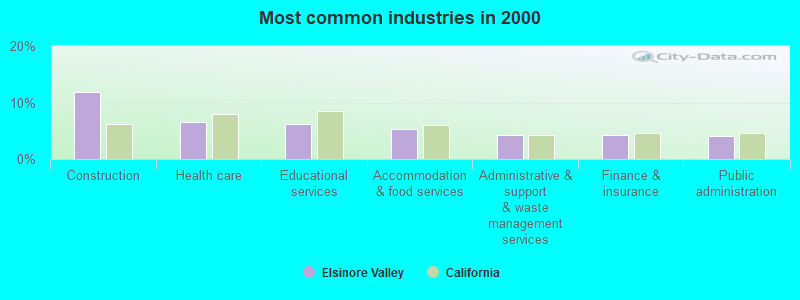
The most common industries in Elsinore Valley are: Construction (11.9% of civilian employees), Health care (6.6% of civilian employees), Educational services (6.2% of civilian employees). 74.5% of workers are employees of private companies, which is 8.8% greater than the rate of 68.0% across the entire state of California.
Most common industries

Most common industries | |||
|---|---|---|---|
Industry | All | Males | Females |
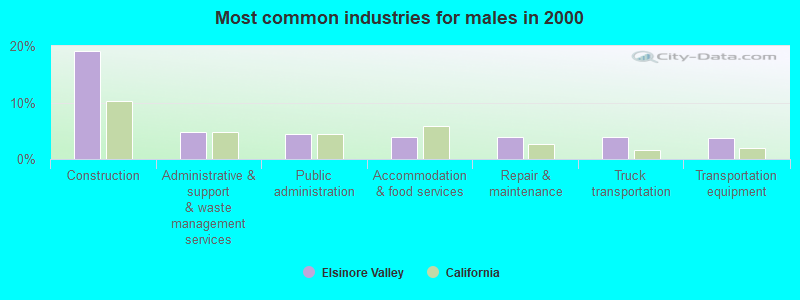
| Construction | 11.9% (3,458) | 19.2% (3,201) | 2.1% (257) |
| Health care | 6.6% (1,899) | 2.4% (400) | 12.2% (1,499) |
| Educational services | 6.2% (1,797) | 2.6% (437) | 11.1% (1,360) |
| Accommodation and food services | 5.3% (1,548) | 3.9% (656) | 7.3% (892) |
| Administrative and support and waste management services | 4.3% (1,240) | 4.8% (807) | 3.5% (433) |
| Finance and insurance | 4.2% (1,227) | 2.6% (436) | 6.4% (791) |
| Public administration | 4.0% (1,164) | 4.4% (734) | 3.5% (430) |
| Professional, scientific, and technical services | 3.7% (1,084) | 3.6% (599) | 4.0% (485) |
| Food and beverage stores | 2.9% (852) | 2.7% (448) | 3.3% (404) |
| Miscellaneous manufacturing | 2.9% (841) | 3.0% (503) | 2.8% (338) |
| Transportation equipment | 2.7% (778) | 3.8% (633) | 1.2% (145) |
| Truck transportation | 2.6% (761) | 3.8% (639) | 1.0% (122) |
| Repair and maintenance | 2.5% (735) | 3.9% (653) | 0.7% (82) |
| Metal and metal products | 2.4% (710) | 3.3% (544) | 1.4% (166) |
| Arts, entertainment, and recreation | 2.2% (630) | 2.3% (383) | 2.0% (247) |
| Computer and electronic products | 2.0% (582) | 2.4% (393) | 1.5% (189) |
| Real estate and rental and leasing | 2.0% (577) | 1.3% (212) | 3.0% (365) |
| Department and other general merchandise stores | 1.9% (557) | 1.0% (164) | 3.2% (393) |
| Motor vehicle and parts dealers | 1.8% (528) | 2.6% (440) | 0.7% (88) |
| Social assistance | 1.6% (475) | 0.0% (6) | 3.8% (469) |
| Building material and garden equipment and supplies dealers | 1.3% (382) | 1.9% (312) | 0.6% (70) |
| Other transportation, and support activities, and couriers | 1.3% (375) | 1.8% (293) | 0.7% (82) |
| Personal and laundry services | 1.2% (362) | 0.4% (70) | 2.4% (292) |
| Broadcasting and telecommunications | 1.1% (328) | 1.3% (213) | 0.9% (115) |
| Machinery | 1.0% (284) | 1.2% (200) | 0.7% (84) |
| Groceries and related products merchant wholesalers | 1.0% (278) | 1.1% (192) | 0.7% (86) |
| Other direct selling establishments | 0.9% (255) | 0.7% (117) | 1.1% (138) |
| Plastics and rubber products | 0.8% (241) | 1.0% (166) | 0.6% (75) |
| Clothing and accessories, including shoe, stores | 0.8% (240) | 0.3% (45) | 1.6% (195) |
| Utilities | 0.8% (228) | 1.1% (188) | 0.3% (40) |
| U. S. Postal service | 0.8% (226) | 0.6% (105) | 1.0% (121) |
| Religious, grantmaking, civic, professional, and similar organizations | 0.8% (226) | 0.6% (102) | 1.0% (124) |
| Used merchandise, gift, novelty, and souvenir, and other miscellaneous stores | 0.7% (209) | 0.5% (88) | 1.0% (121) |
| Nonmetallic mineral products | 0.7% (189) | 0.9% (158) | 0.3% (31) |
| Publishing, and motion picture and sound recording industries | 0.6% (179) | 0.5% (90) | 0.7% (89) |
| Machinery, equipment, and supplies merchant wholesalers | 0.6% (179) | 0.6% (103) | 0.6% (76) |
| Radio, TV, and computer stores | 0.6% (179) | 0.7% (117) | 0.5% (62) |
| Chemicals | 0.6% (178) | 0.5% (89) | 0.7% (89) |
| Miscellaneous nondurable goods merchant wholesalers | 0.6% (178) | 0.6% (105) | 0.6% (73) |
| Printing and related support activities | 0.6% (177) | 0.7% (125) | 0.4% (52) |
| Furniture and related product manufacturing | 0.5% (157) | 0.7% (115) | 0.3% (42) |
| Pharmacies and drug stores | 0.5% (150) | 0.2% (31) | 1.0% (119) |
| Agriculture, forestry, fishing and hunting | 0.5% (143) | 0.7% (120) | 0.2% (23) |
| Private households | 0.5% (139) | 0.0% (8) | 1.1% (131) |
| Furniture and home furnishings, and household appliance stores | 0.5% (131) | 0.3% (43) | 0.7% (88) |
| Food | 0.4% (130) | 0.5% (79) | 0.4% (51) |
| Air transportation | 0.4% (129) | 0.5% (79) | 0.4% (50) |
| Paper | 0.4% (118) | 0.7% (118) | 0.0% (0) |
| Motor vehicles, parts and supplies merchant wholesalers | 0.4% (114) | 0.5% (83) | 0.3% (31) |
| Electrical and electronic goods merchant wholesalers | 0.3% (96) | 0.4% (72) | 0.2% (24) |
| Professional and commercial equipment and supplies merchant wholesalers | 0.3% (95) | 0.5% (87) | 0.1% (8) |
| Rail transportation | 0.3% (88) | 0.4% (69) | 0.2% (19) |
| Data processing, libraries, and other information services | 0.3% (87) | 0.1% (11) | 0.6% (76) |
| Wood products | 0.3% (82) | 0.3% (52) | 0.2% (30) |
| Sporting goods, camera, and hobby and toy stores | 0.3% (73) | 0.3% (50) | 0.2% (23) |
| Warehousing and storage | 0.2% (68) | 0.3% (48) | 0.2% (20) |
| Beverage and tobacco products | 0.2% (59) | 0.4% (59) | 0.0% (0) |
| Petroleum and coal products | 0.2% (59) | 0.4% (59) | 0.0% (0) |
| Gasoline stations | 0.2% (57) | 0.0% (4) | 0.4% (53) |
| Drugs, sundries, and chemical and allied products merchant wholesalers | 0.2% (53) | 0.1% (25) | 0.2% (28) |
| Health and personal care, except drug, stores | 0.2% (53) | 0.2% (38) | 0.1% (15) |
| Apparel | 0.2% (46) | 0.1% (17) | 0.2% (29) |
| Electronic shopping and mail-order houses | 0.2% (45) | 0.0% (8) | 0.3% (37) |
| Lumber and other construction materials merchant wholesalers | 0.2% (45) | 0.3% (45) | 0.0% (0) |
| Electrical equipment, appliances, and components | 0.1% (40) | 0.2% (32) | 0.1% (8) |
| Metals and minerals, except petroleum, merchant wholesalers | 0.1% (35) | 0.1% (14) | 0.2% (21) |
| Textile mills and textile products | 0.1% (34) | 0.1% (15) | 0.2% (19) |
| Jewelry, luggage, and leather goods stores | 0.1% (31) | 0.0% (0) | 0.3% (31) |
| Music stores | 0.1% (25) | 0.1% (18) | 0.1% (7) |
| Petroleum and petroleum products merchant wholesalers | 0.1% (24) | 0.1% (24) | 0.0% (0) |
| Hardware, plumbing and heating equipment, and supplies merchant wholesalers | 0.1% (23) | 0.1% (23) | 0.0% (0) |
| Office supplies and stationery stores | 0.1% (19) | 0.1% (19) | 0.0% (0) |
| Fuel dealers | 0.1% (19) | 0.1% (19) | 0.0% (0) |
Unemployment in Elsinore Valley
- Unemployment by race in 2000
- Unemployment rate for White non-Hispanic residents
- 4.4%Males
- 5.4%Females
- Unemployment rate for Black residents
- 8.7%Males
- 3.5%Females
- Unemployment rate for American Indian and Alaska Native residents
- 7.1%Males
- 7.8%Females
- Unemployment rate for Asian residents
- 4.5%Females
- Unemployment rate for other race residents
- 5.4%Males
- 16.1%Females
- Unemployment rate for two or more race residents
- 1.6%Males
- 8.9%Females
- Unemployment rate for Hispanic or Latino residents
- 6.2%Males
- 13.6%Females
Time leaving home to go to work

<5am:
| Elsinore Valley: | 11.6% (3,312) |
| California: | 4.2% (606,086) |
5:30am:
| Elsinore Valley: | 8.1% (2,307) |
| California: | 3.6% (523,209) |
6am:
| Elsinore Valley: | 6.9% (1,961) |
| California: | 4.8% (692,256) |
6:30am:
| Elsinore Valley: | 10.2% (2,903) |
| California: | 8.4% (1,216,867) |
7am:
| Elsinore Valley: | 10.0% (2,849) |
| California: | 9.4% (1,362,830) |
7:30am:
| Elsinore Valley: | 10.0% (2,853) |
| California: | 13.8% (2,006,950) |
8am:
| Elsinore Valley: | 8.5% (2,434) |
| California: | 13.7% (1,986,831) |
8:30am:
| Elsinore Valley: | 7.2% (2,044) |
| California: | 10.9% (1,577,815) |
9am:
| Elsinore Valley: | 3.5% (1,002) |
| California: | 5.4% (778,152) |
10am:
| Elsinore Valley: | 4.5% (1,286) |
| California: | 6.7% (972,355) |
11am:
| Elsinore Valley: | 2.1% (611) |
| California: | 2.9% (414,479) |
12pm:
| Elsinore Valley: | 1.0% (287) |
| California: | 1.3% (189,005) |
4pm:
| Elsinore Valley: | 6.2% (1,776) |
| California: | 6.0% (865,284) |
>4pm:
| Elsinore Valley: | 5.7% (1,640) |
| California: | 5.3% (776,167) |
Travel time to work


Less than 5 minutes:
| Elsinore Valley: | 1.2% (335) |
| California: | 2.2% (324,703) |
5 to 9 minutes:
| Elsinore Valley: | 4.6% (1,313) |
| California: | 8.8% (1,280,443) |
10 to 14 minutes:
| Elsinore Valley: | 8.2% (2,340) |
| California: | 13.3% (1,930,263) |
15 to 19 minutes:
| Elsinore Valley: | 9.1% (2,597) |
| California: | 14.9% (2,157,970) |
20 to 24 minutes:
| Elsinore Valley: | 10.1% (2,889) |
| California: | 13.8% (2,004,060) |
25 to 29 minutes:
| Elsinore Valley: | 4.4% (1,251) |
| California: | 5.4% (782,241) |
30 to 34 minutes:
| Elsinore Valley: | 12.3% (3,499) |
| California: | 13.9% (2,025,657) |
35 to 39 minutes:
| Elsinore Valley: | 2.7% (772) |
| California: | 2.5% (366,487) |
40 to 44 minutes:
| Elsinore Valley: | 4.4% (1,264) |
| California: | 3.6% (528,043) |
45 to 59 minutes:
| Elsinore Valley: | 11.7% (3,324) |
| California: | 7.9% (1,151,598) |
60 to 89 minutes:
| Elsinore Valley: | 18.1% (5,153) |
| California: | 6.4% (933,123) |
90 or more minutes:
| Elsinore Valley: | 8.9% (2,528) |
| California: | 3.3% (483,698) |
Means of transportation to work


Drove car alone:
| Elsinore Valley: | 74.1% (21,147) |
| California: | 71.8% (10,432,462) |
Carpooled:
| Elsinore Valley: | 18.4% (5,246) |
| California: | 14.5% (2,113,313) |
Bus or trolley bus:
| Elsinore Valley: | 0.6% (159) |
| California: | 3.8% (549,425) |
Streetcar or trolley car:
| Elsinore Valley: | 0.0% (9) |
| California: | 0.1% (21,158) |
Railroad:
| Elsinore Valley: | 0.3% (99) |
| California: | 0.3% (41,022) |
Motorcycle:
| Elsinore Valley: | 0.3% (78) |
| California: | 0.2% (36,262) |
Bicycle:
| Elsinore Valley: | 0.3% (86) |
| California: | 0.8% (120,567) |
Walked:
| Elsinore Valley: | 0.9% (263) |
| California: | 2.9% (414,581) |
Other means:
| Elsinore Valley: | 0.6% (178) |
| California: | 0.8% (115,064) |
Private vehicle occupancy

Drove alone:
| Elsinore Valley: | 80.1% (21,147) |
| California: | 83.2% (10,432,462) |
In 2 person carpool:
| Elsinore Valley: | 14.3% (3,770) |
| California: | 12.5% (1,564,905) |
In 3 person carpool:
| Elsinore Valley: | 3.2% (855) |
| California: | 2.6% (330,732) |
In 4 person carpool:
| Elsinore Valley: | 1.3% (353) |
| California: | 1.0% (119,364) |
In 5-6 person carpool:
| Elsinore Valley: | 0.4% (118) |
| California: | 0.5% (57,036) |
In 7+ person carpool:
| Elsinore Valley: | 0.6% (150) |
| California: | 0.3% (41,276) |
Class of workers

Employee of private company:
| Elsinore Valley: | 74.5% (21,603) |
| California: | 68.0% (10,009,465) |
Self-employed in own incorporated business:
| Elsinore Valley: | 1.7% (498) |
| California: | 2.7% (402,392) |
Private not-for-profit wage and salary workers:
| Elsinore Valley: | 3.4% (983) |
| California: | 5.7% (845,536) |
Local government workers:
| Elsinore Valley: | 7.3% (2,119) |
| California: | 8.3% (1,218,764) |
State government workers:
| Elsinore Valley: | 2.8% (816) |
| California: | 4.0% (594,953) |
Federal government workers:
| Elsinore Valley: | 1.9% (559) |
| California: | 2.3% (344,354) |
Self-employed workers in own not incorporated business:
| Elsinore Valley: | 7.9% (2,284) |
| California: | 8.5% (1,249,530) |
Unpaid family workers:
| Elsinore Valley: | 0.4% (122) |
| California: | 0.4% (53,934) |

Employee of private company - Males:
| Elsinore Valley: | 78.4% (13,109) |
| California: | 71.1% (5,716,697) |
Self-employed in own incorporated business - Males:
| Elsinore Valley: | 1.8% (307) |
| California: | 3.6% (290,657) |
Private not-for-profit wage and salary workers - Males:
| Elsinore Valley: | 1.7% (286) |
| California: | 3.8% (303,997) |
Local government workers - Males:
| Elsinore Valley: | 5.6% (933) |
| California: | 6.2% (495,927) |
State government workers - Males:
| Elsinore Valley: | 1.7% (286) |
| California: | 3.2% (255,434) |
Federal government workers - Males:
| Elsinore Valley: | 1.8% (298) |
| California: | 2.5% (198,555) |
Self-employed workers in own not incorporated business - Males:
| Elsinore Valley: | 8.7% (1,453) |
| California: | 9.5% (760,853) |
Unpaid family workers - Males:
| Elsinore Valley: | 0.2% (41) |
| California: | 0.3% (23,230) |

Employee of private company - Females:
| Elsinore Valley: | 69.2% (8,494) |
| California: | 64.3% (4,292,768) |
Self-employed in own incorporated business - Females:
| Elsinore Valley: | 1.6% (191) |
| California: | 1.7% (111,735) |
Private not-for-profit wage and salary workers - Females:
| Elsinore Valley: | 5.7% (697) |
| California: | 8.1% (541,539) |
Local government workers - Females:
| Elsinore Valley: | 9.7% (1,186) |
| California: | 10.8% (722,837) |
State government workers - Females:
| Elsinore Valley: | 4.3% (530) |
| California: | 5.1% (339,519) |
Federal government workers - Females:
| Elsinore Valley: | 2.1% (261) |
| California: | 2.2% (145,799) |
Self-employed workers in own not incorporated business - Females:
| Elsinore Valley: | 6.8% (831) |
| California: | 7.3% (488,677) |
Unpaid family workers - Females:
| Elsinore Valley: | 0.7% (81) |
| California: | 0.5% (30,704) |