Work and Jobs in East Haven, Vermont (VT) Detailed Stats
Occupations, Industries, Unemployment, Workers, Commute

Discuss East Haven, Vermont work on our local forum with over 2,400,000 registered users
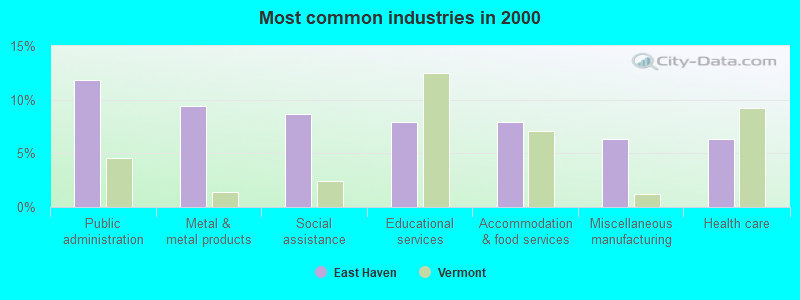
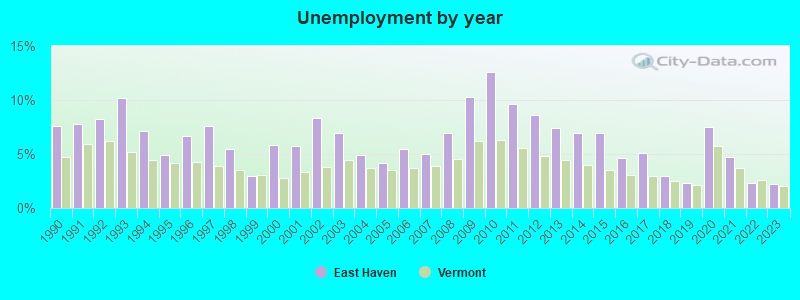
The unemployment rate in 2023 in East Haven, VT was 2.2%, which was 9.1% greater than the unemployment rate of 2.0% across the entire state of Vermont. Compared to the unemployment rate of 7.4% in 2013, this represents a decrease of 236.4%. The most common industries in East Haven are: Public administration (11.8% of civilian employees), Metal & metal products (9.4% of civilian employees), Social assistance (8.7% of civilian employees). 66.9% of workers are employees of private companies, which is 10.5% greater than the rate of 59.9% across the entire state of Vermont.
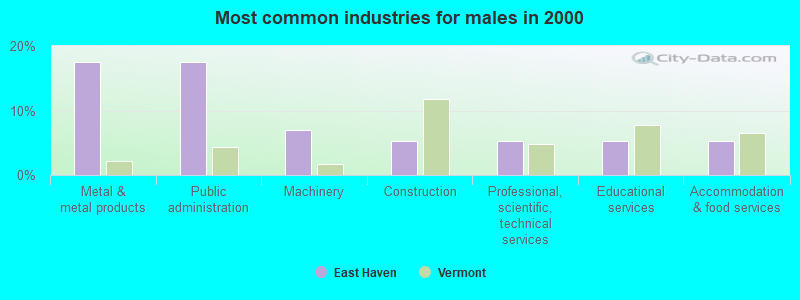
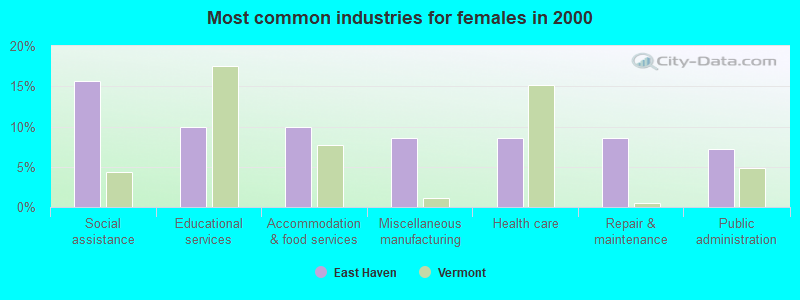
Most common industries
Most common industries | |||
|---|---|---|---|
Industry | All | Males | Females |
| Public administration | 11.8% (15) | 17.5% (10) | 7.1% (5) |
| Metal and metal products | 9.4% (12) | 17.5% (10) | 2.9% (2) |
| Social assistance | 8.7% (11) | 0.0% (0) | 15.7% (11) |
| Educational services | 7.9% (10) | 5.3% (3) | 10.0% (7) |
| Accommodation and food services | 7.9% (10) | 5.3% (3) | 10.0% (7) |
| Miscellaneous manufacturing | 6.3% (8) | 3.5% (2) | 8.6% (6) |
| Health care | 6.3% (8) | 3.5% (2) | 8.6% (6) |
| Repair and maintenance | 6.3% (8) | 3.5% (2) | 8.6% (6) |
| Electrical equipment, appliances, and components | 4.7% (6) | 3.5% (2) | 5.7% (4) |
| Machinery | 3.1% (4) | 7.0% (4) | 0.0% (0) |
| Truck transportation | 3.1% (4) | 3.5% (2) | 2.9% (2) |
| Construction | 2.4% (3) | 5.3% (3) | 0.0% (0) |
| Food and beverage stores | 2.4% (3) | 0.0% (0) | 4.3% (3) |
| Professional, scientific, and technical services | 2.4% (3) | 5.3% (3) | 0.0% (0) |
| Department and other general merchandise stores | 1.6% (2) | 0.0% (0) | 2.9% (2) |
| Mining, quarrying, and oil and gas extraction | 1.6% (2) | 3.5% (2) | 0.0% (0) |
| Food | 1.6% (2) | 3.5% (2) | 0.0% (0) |
| Furniture and related product manufacturing | 1.6% (2) | 3.5% (2) | 0.0% (0) |
| Textile mills and textile products | 1.6% (2) | 0.0% (0) | 2.9% (2) |
| Wood products | 1.6% (2) | 3.5% (2) | 0.0% (0) |
| Paper | 1.6% (2) | 3.5% (2) | 0.0% (0) |
| U. S. Postal service | 1.6% (2) | 0.0% (0) | 2.9% (2) |
| Private households | 1.6% (2) | 0.0% (0) | 2.9% (2) |
| Pharmacies and drug stores | 0.8% (1) | 0.0% (0) | 1.4% (1) |
| Sporting goods, camera, and hobby and toy stores | 0.8% (1) | 0.0% (0) | 1.4% (1) |
| Other direct selling establishments | 0.8% (1) | 1.8% (1) | 0.0% (0) |
| Finance and insurance | 0.8% (1) | 0.0% (0) | 1.4% (1) |
Unemployment in East Haven
- Unemployment by race in 2000
- Unemployment rate for White non-Hispanic residents
- 6.6%Males
- 2.8%Females
Unemployment in 2023:
| East Haven: | 2.2% |
| Vermont: | 2.0% |
Unemployment in 2022:
| East Haven: | 2.3% |
| Vermont: | 2.6% |
Unemployment in 2021:
| East Haven: | 4.7% |
| Vermont: | 3.7% |
Unemployment in 2020:
| East Haven: | 7.5% |
| Vermont: | 5.7% |
Unemployment in 2019:
| East Haven: | 2.3% |
| Vermont: | 2.1% |
Unemployment in 2018:
| East Haven: | 3.0% |
| Vermont: | 2.5% |
Unemployment in 2017:
| East Haven: | 5.1% |
| Vermont: | 3.0% |
Unemployment in 2016:
| East Haven: | 4.6% |
| Vermont: | 3.1% |
Unemployment in 2015:
| East Haven: | 6.9% |
| Vermont: | 3.5% |
Unemployment in 2014:
| East Haven: | 6.9% |
| Vermont: | 4.0% |
Unemployment in 2013:
| East Haven: | 7.4% |
| Vermont: | 4.4% |
Unemployment in 2012:
| East Haven: | 8.6% |
| Vermont: | 4.8% |
Unemployment in 2011:
| East Haven: | 9.6% |
| Vermont: | 5.6% |
Unemployment in 2010:
| East Haven: | 12.6% |
| Vermont: | 6.3% |
Unemployment in 2009:
| East Haven: | 10.3% |
| Vermont: | 6.2% |
Unemployment in 2008:
| East Haven: | 6.9% |
| Vermont: | 4.5% |
Unemployment in 2007:
| East Haven: | 5.0% |
| Vermont: | 3.9% |
Unemployment in 2006:
| East Haven: | 5.5% |
| Vermont: | 3.7% |
Unemployment in 2005:
| East Haven: | 4.2% |
| Vermont: | 3.5% |
Unemployment in 2004:
| East Haven: | 4.9% |
| Vermont: | 3.7% |
Unemployment in 2003:
| East Haven: | 6.9% |
| Vermont: | 4.4% |
Unemployment in 2002:
| East Haven: | 8.3% |
| Vermont: | 3.8% |
Unemployment in 2001:
| East Haven: | 5.7% |
| Vermont: | 3.3% |
Unemployment in 2000:
| East Haven: | 5.8% |
| Vermont: | 2.8% |
Unemployment in 1999:
| East Haven: | 3.0% |
| Vermont: | 3.1% |
Unemployment in 1998:
| East Haven: | 5.5% |
| Vermont: | 3.5% |
Unemployment in 1997:
| East Haven: | 7.6% |
| Vermont: | 3.9% |
Unemployment in 1996:
| East Haven: | 6.7% |
| Vermont: | 4.3% |
Unemployment in 1995:
| East Haven: | 4.9% |
| Vermont: | 4.2% |
Unemployment in 1994:
| East Haven: | 7.1% |
| Vermont: | 4.4% |
Unemployment in 1993:
| East Haven: | 10.2% |
| Vermont: | 5.2% |
Unemployment in 1992:
| East Haven: | 8.2% |
| Vermont: | 6.2% |
Unemployment in 1991:
| East Haven: | 7.8% |
| Vermont: | 5.9% |
Unemployment in 1990:
| East Haven: | 7.6% |
| Vermont: | 4.7% |
Time leaving home to go to work

<5am:
| East Haven: | 8.8% (11) |
| Vermont: | 3.1% (9,660) |
5:30am:
| East Haven: | 3.2% (4) |
| Vermont: | 2.4% (7,330) |
6am:
| East Haven: | 13.6% (17) |
| Vermont: | 4.0% (12,509) |
6:30am:
| East Haven: | 20.0% (25) |
| Vermont: | 7.8% (24,450) |
7am:
| East Haven: | 4.0% (5) |
| Vermont: | 11.1% (34,572) |
7:30am:
| East Haven: | 8.8% (11) |
| Vermont: | 14.8% (46,249) |
8am:
| East Haven: | 8.8% (11) |
| Vermont: | 16.2% (50,397) |
8:30am:
| East Haven: | 1.6% (2) |
| Vermont: | 10.7% (33,273) |
11am:
| East Haven: | 3.2% (4) |
| Vermont: | 1.8% (5,484) |
4pm:
| East Haven: | 8.8% (11) |
| Vermont: | 6.7% (20,897) |
>4pm:
| East Haven: | 9.6% (12) |
| Vermont: | 5.7% (17,633) |
Travel time to work


5 to 9 minutes:
| East Haven: | 12.0% (15) |
| Vermont: | 14.2% (44,253) |
10 to 14 minutes:
| East Haven: | 8.8% (11) |
| Vermont: | 16.1% (50,133) |
15 to 19 minutes:
| East Haven: | 2.4% (3) |
| Vermont: | 14.9% (46,609) |
20 to 24 minutes:
| East Haven: | 11.2% (14) |
| Vermont: | 12.8% (39,922) |
25 to 29 minutes:
| East Haven: | 3.2% (4) |
| Vermont: | 5.4% (16,919) |
30 to 34 minutes:
| East Haven: | 35.2% (44) |
| Vermont: | 10.1% (31,641) |
35 to 39 minutes:
| East Haven: | 1.6% (2) |
| Vermont: | 2.2% (6,974) |
40 to 44 minutes:
| East Haven: | 4.0% (5) |
| Vermont: | 2.7% (8,296) |
45 to 59 minutes:
| East Haven: | 4.0% (5) |
| Vermont: | 5.3% (16,427) |
60 to 89 minutes:
| East Haven: | 5.6% (7) |
| Vermont: | 2.9% (9,137) |
90 or more minutes:
| East Haven: | 2.4% (3) |
| Vermont: | 1.8% (5,668) |
Means of transportation to work

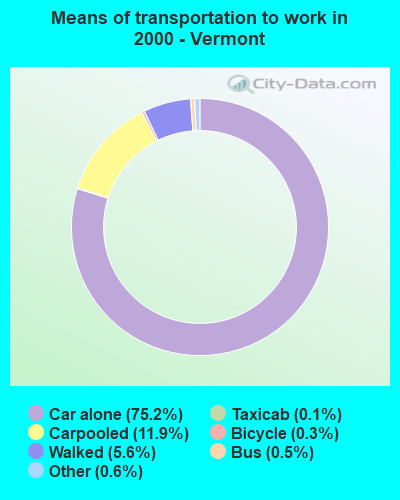
Drove car alone:
| East Haven: | 77.6% (97) |
| Vermont: | 75.2% (234,388) |
Carpooled:
| East Haven: | 11.2% (14) |
| Vermont: | 11.9% (37,191) |
Other means:
| East Haven: | 1.6% (2) |
| Vermont: | 0.6% (1,734) |
Private vehicle occupancy

Drove alone:
| East Haven: | 87.4% (97) |
| Vermont: | 86.3% (234,388) |
In 2 person carpool:
| East Haven: | 10.8% (12) |
| Vermont: | 11.4% (30,882) |
In 3 person carpool:
| East Haven: | 1.8% (2) |
| Vermont: | 1.6% (4,340) |
Class of workers

Employee of private company:
| East Haven: | 66.9% (85) |
| Vermont: | 59.9% (189,982) |
Self-employed in own incorporated business:
| East Haven: | 0.8% (1) |
| Vermont: | 3.8% (12,027) |
Private not-for-profit wage and salary workers:
| East Haven: | 1.6% (2) |
| Vermont: | 11.6% (36,669) |
Local government workers:
| East Haven: | 12.6% (16) |
| Vermont: | 7.6% (24,003) |
State government workers:
| East Haven: | 7.9% (10) |
| Vermont: | 4.3% (13,652) |
Federal government workers:
| East Haven: | 3.1% (4) |
| Vermont: | 2.3% (7,355) |
Self-employed workers in own not incorporated business:
| East Haven: | 7.1% (9) |
| Vermont: | 10.3% (32,546) |

Employee of private company - Males:
| East Haven: | 63.2% (36) |
| Vermont: | 64.5% (106,173) |
Private not-for-profit wage and salary workers - Males:
| East Haven: | 3.5% (2) |
| Vermont: | 6.8% (11,234) |
Local government workers - Males:
| East Haven: | 10.5% (6) |
| Vermont: | 5.0% (8,286) |
State government workers - Males:
| East Haven: | 17.5% (10) |
| Vermont: | 3.9% (6,384) |
Self-employed workers in own not incorporated business - Males:
| East Haven: | 5.3% (3) |
| Vermont: | 12.1% (19,879) |

Employee of private company - Females:
| East Haven: | 70.0% (49) |
| Vermont: | 55.0% (83,809) |
Self-employed in own incorporated business - Females:
| East Haven: | 1.4% (1) |
| Vermont: | 2.3% (3,433) |
Local government workers - Females:
| East Haven: | 14.3% (10) |
| Vermont: | 10.3% (15,717) |
Federal government workers - Females:
| East Haven: | 5.7% (4) |
| Vermont: | 2.4% (3,648) |
Self-employed workers in own not incorporated business - Females:
| East Haven: | 8.6% (6) |
| Vermont: | 8.3% (12,667) |