Work and Jobs in Davenport, Iowa (IA) Detailed Stats
Occupations, Industries, Unemployment, Workers, Commute
Settings
X


Recent posts about work in Davenport, Iowa on our local forum with over 2,400,000 registered users:
 | Trying to decide to move our 4 kids to davenport iowa or spokane wa. Due to job transfer. (2 replies) |
| davenport jobs (7 replies) |
| Quad City Photo Thread (80 replies) |
| Best areas in Davenport, close to schools,stores, jobs (10 replies) |
| Possible move to Davenport (48 replies) |
| Do You Think Davenport Might Work For Me? (8 replies) |
Latest news about work in Davenport, IA collected exclusively by city-data.com from local newspapers, TV, and radio stations
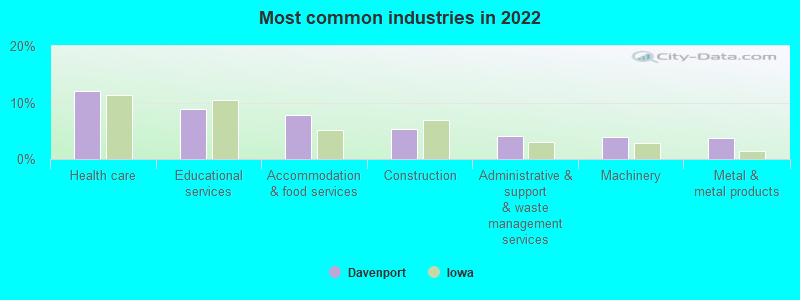
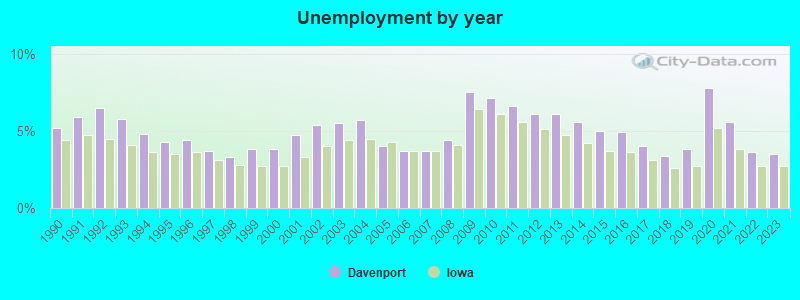
The unemployment rate in 2023 in Davenport, IA was 3.5%, which was 22.9% greater than the unemployment rate of 2.7% across the entire state of Iowa. Compared to the unemployment rate of 6.1% in 2013, this represents a decrease of 74.3%. According to 2022 data, the most common industries in Davenport are: Health care (12.1% of civilian employees), Educational services (8.8% of civilian employees), Accommodation & food services (7.8% of civilian employees). 80.7% of workers work in Scott County and 7.7% of all workers work at home. 68.9% of workers are employees of private companies, which is 4.1% greater than the rate of 66.1% across the entire state of Iowa.
Whole page based on the data from 2000 / 2022 when the population of Davenport, Iowa was 98,359 / 100,491
Whole page based on the data from 2000 / 2022 when the population of Davenport, Iowa was 98,359 / 100,491
Most common industries


Most common industries | Most common industries | |||||
|---|---|---|---|---|---|---|
Industry | All | Males | Females | All | Males | Females |
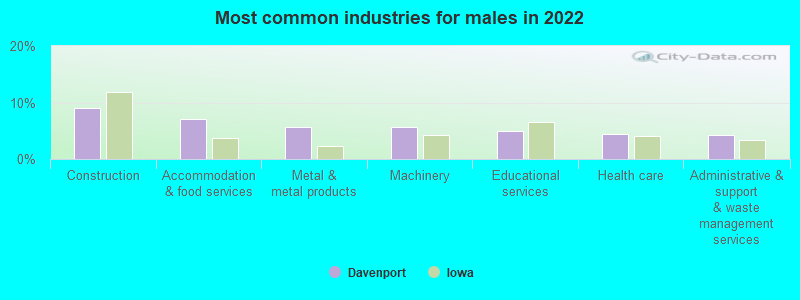
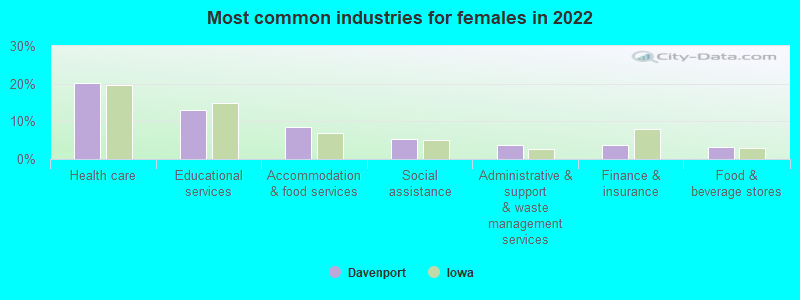
| Health care | 12.1% (6,034) | 4.3% (1,105) | 20.2% (4,929) | 9.7% (4,654) | 3.7% (882) | 16.0% (3,772) |
| Educational services | 8.8% (4,384) | 4.9% (1,238) | 12.9% (3,146) | 8.3% (3,962) | 5.5% (1,325) | 11.2% (2,637) |
| Accommodation and food services | 7.8% (3,882) | 7.1% (1,806) | 8.5% (2,076) | 7.9% (3,782) | 7.5% (1,819) | 8.3% (1,963) |
| Construction | 5.4% (2,666) | 9.1% (2,312) | 1.5% (354) | 5.6% (2,691) | 9.5% (2,303) | 1.6% (388) |
| Administrative and support and waste management services | 4.0% (1,998) | 4.3% (1,095) | 3.7% (903) | 3.6% (1,720) | 3.7% (887) | 3.5% (833) |
| Machinery | 3.8% (1,899) | 5.6% (1,419) | 2.0% (480) | 2.9% (1,402) | 4.3% (1,048) | 1.5% (354) |
| Metal and metal products | 3.7% (1,827) | 5.6% (1,421) | 1.7% (406) | 4.4% (2,087) | 7.6% (1,836) | 1.1% (251) |
| Public administration | 3.5% (1,746) | 4.0% (1,028) | 2.9% (718) | 4.2% (2,009) | 4.3% (1,039) | 4.1% (970) |
| Professional, scientific, and technical services | 3.5% (1,720) | 4.2% (1,061) | 2.7% (659) | 3.8% (1,797) | 3.5% (852) | 4.0% (945) |
| Food and beverage stores | 3.3% (1,652) | 3.3% (846) | 3.3% (806) | 2.9% (1,382) | 2.8% (678) | 3.0% (704) |
| Social assistance | 3.0% (1,499) | 0.9% (232) | 5.2% (1,267) | 2.9% (1,379) | 0.9% (216) | 4.9% (1,163) |
| Finance and insurance | 2.7% (1,362) | 1.9% (488) | 3.6% (874) | 3.7% (1,785) | 2.6% (620) | 4.9% (1,165) |
| Food | 2.7% (1,346) | 3.2% (824) | 2.1% (522) | 3.3% (1,564) | 4.0% (966) | 2.5% (598) |
| Truck transportation | 2.0% (992) | 3.2% (803) | 0.8% (189) | 1.5% (719) | 2.7% (655) | 0.3% (64) |
| Arts, entertainment, and recreation | 2.0% (981) | 2.1% (524) | 1.9% (457) | 2.6% (1,222) | 2.5% (603) | 2.6% (619) |
| Department and other general merchandise stores | 1.8% (892) | 0.5% (116) | 3.2% (776) | 2.6% (1,224) | 1.6% (377) | 3.6% (847) |
| Other transportation, and support activities, and couriers | 1.6% (797) | 2.2% (571) | 0.9% (226) | 1.2% (584) | 1.6% (394) | 0.8% (190) |
| Real estate and rental and leasing | 1.5% (769) | 1.6% (395) | 1.5% (374) | 1.6% (752) | 1.4% (333) | 1.8% (419) |
| Personal and laundry services | 1.4% (718) | 1.0% (251) | 1.9% (467) | 1.2% (590) | 0.4% (96) | 2.1% (494) |
| Broadcasting and telecommunications | 1.4% (701) | 1.7% (427) | 1.1% (274) | 1.1% (528) | 1.0% (251) | 1.2% (277) |
| Miscellaneous manufacturing | 1.4% (686) | 2.3% (593) | 0.4% (93) | 0.7% (350) | 0.9% (220) | 0.6% (130) |
| Motor vehicle and parts dealers | 1.3% (639) | 2.2% (548) | 0.4% (91) | 1.6% (757) | 2.6% (634) | 0.5% (123) |
| Religious, grantmaking, civic, professional, and similar organizations | 1.3% (637) | 1.2% (301) | 1.4% (336) | 1.3% (610) | 0.7% (159) | 1.9% (451) |
| Repair and maintenance | 1.1% (565) | 2.0% (506) | 0.2% (59) | 1.8% (871) | 3.0% (731) | 0.6% (140) |
| Utilities | 1.1% (551) | 1.2% (311) | 1.0% (240) | 1.1% (506) | 1.2% (284) | 0.9% (222) |
| Pharmacies and drug stores | 1.0% (506) | 0.5% (137) | 1.5% (369) | 0.5% (233) | 0.2% (45) | 0.8% (188) |
| Building material and garden equipment and supplies dealers | 1.0% (505) | 1.2% (294) | 0.9% (211) | 1.0% (478) | 1.4% (334) | 0.6% (144) |
| Gasoline stations | 0.9% (465) | 0.2% (41) | 1.7% (424) | 0.4% (198) | 0.3% (63) | 0.6% (135) |
| Clothing and accessories, including shoe, stores | 0.9% (452) | 0.3% (68) | 1.6% (384) | 0.7% (320) | 0.4% (89) | 1.0% (231) |
| Radio, TV, and computer stores | 0.8% (393) | 1.0% (256) | 0.6% (137) | 0.5% (245) | 0.5% (126) | 0.5% (119) |
| Transportation equipment | 0.8% (377) | 1.0% (256) | 0.5% (121) | 1.0% (487) | 1.3% (325) | 0.7% (162) |
| Nonmetallic mineral products | 0.7% (359) | 1.0% (245) | 0.5% (114) | 0.5% (229) | 0.8% (184) | 0.2% (45) |
| Chemicals | 0.7% (347) | 1.1% (279) | 0.3% (68) | 0.3% (126) | 0.3% (64) | 0.3% (62) |
| Agriculture, forestry, fishing and hunting | 0.7% (331) | 1.3% (320) | 0.0% (11) | 0.1% (67) | 0.2% (54) | 0.1% (13) |
| Groceries and related products merchant wholesalers | 0.7% (328) | 1.2% (300) | 0.1% (28) | 0.7% (344) | 1.1% (262) | 0.3% (82) |
| Publishing, and motion picture and sound recording industries | 0.7% (328) | 0.6% (147) | 0.7% (181) | 0.9% (444) | 0.9% (216) | 1.0% (228) |
| Used merchandise, gift, novelty, and souvenir, and other miscellaneous stores | 0.6% (285) | 0.5% (134) | 0.6% (151) | 0.6% (272) | 0.5% (125) | 0.6% (147) |
| Computer and electronic products | 0.5% (266) | 1.0% (258) | 0.0% (8) | 0.1% (69) | 0.2% (43) | 0.1% (26) |
| Furniture and related product manufacturing | 0.5% (241) | 0.7% (189) | 0.2% (52) | 0.5% (237) | 0.7% (169) | 0.3% (68) |
| Private households | 0.4% (216) | 0.1% (16) | 0.8% (200) | 0.3% (138) | 0.1% (17) | 0.5% (121) |
| Machinery, equipment, and supplies merchant wholesalers | 0.4% (206) | 0.8% (206) | 0.0% (0) | 0.7% (358) | 1.2% (280) | 0.3% (78) |
| Other direct selling establishments | 0.4% (193) | 0.5% (123) | 0.3% (70) | 0.6% (265) | 0.3% (84) | 0.8% (181) |
| U. S. Postal service | 0.4% (190) | 0.2% (48) | 0.6% (142) | 0.7% (317) | 0.8% (186) | 0.6% (131) |
| Printing and related support activities | 0.4% (175) | 0.5% (121) | 0.2% (54) | 1.1% (514) | 1.2% (289) | 1.0% (225) |
| Plastics and rubber products | 0.3% (171) | 0.6% (141) | 0.1% (30) | 0.6% (282) | 0.8% (197) | 0.4% (85) |
| Retail florists | 0.3% (157) | 0.2% (47) | 0.5% (110) | 0.1% (39) | 0.0% (4) | 0.1% (35) |
| Sporting goods, camera, and hobby and toy stores | 0.3% (140) | 0.1% (31) | 0.4% (109) | 0.6% (283) | 0.4% (103) | 0.8% (180) |
| Miscellaneous nondurable goods merchant wholesalers | 0.3% (135) | 0.5% (115) | 0.1% (20) | 0.3% (162) | 0.4% (94) | 0.3% (68) |
| Electrical equipment, appliances, and components | 0.2% (123) | 0.3% (75) | 0.2% (48) | 0.1% (52) | 0.1% (15) | 0.2% (37) |
| Recyclable material merchant wholesalers | 0.2% (122) | 0.5% (122) | 0.0% (0) | 0.2% (89) | 0.3% (76) | 0.1% (13) |
| Warehousing and storage | 0.2% (116) | 0.4% (98) | 0.1% (18) | 0.3% (157) | 0.4% (102) | 0.2% (55) |
| Motor vehicles, parts and supplies merchant wholesalers | 0.2% (116) | 0.3% (81) | 0.1% (35) | 0.2% (101) | 0.4% (94) | 0.0% (7) |
| Furniture and home furnishings, and household appliance stores | 0.2% (111) | 0.3% (83) | 0.1% (28) | 0.7% (312) | 0.7% (164) | 0.6% (148) |
| Metals and minerals, except petroleum, merchant wholesalers | 0.2% (102) | 0.3% (88) | 0.1% (14) | 0.1% (48) | 0.2% (48) | 0.0% (0) |
| Wood products | 0.2% (92) | 0.3% (74) | 0.1% (18) | 0.1% (37) | 0.2% (37) | 0.0% (0) |
| Music stores | 0.2% (91) | 0.2% (62) | 0.1% (29) | 0.1% (45) | 0.1% (18) | 0.1% (27) |
| Vending machine operators | 0.2% (90) | 0.0% (0) | 0.4% (90) | 0.1% (43) | 0.1% (22) | 0.1% (21) |
| Air transportation | 0.2% (84) | 0.3% (70) | 0.1% (14) | 0.1% (42) | 0.2% (39) | 0.0% (3) |
| Farm product raw materials merchant wholesalers | 0.2% (81) | 0.3% (81) | 0.0% (0) | 0.1% (29) | 0.1% (22) | 0.0% (7) |
| Hardware, plumbing and heating equipment, and supplies merchant wholesalers | 0.2% (75) | 0.3% (64) | 0.0% (11) | 0.2% (88) | 0.3% (72) | 0.1% (16) |
| Petroleum and petroleum products merchant wholesalers | 0.1% (71) | 0.3% (71) | 0.0% (0) | 0.0% (23) | 0.1% (23) | 0.0% (0) |
| Drugs, sundries, and chemical and allied products merchant wholesalers | 0.1% (68) | 0.0% (0) | 0.3% (68) | 0.0% (16) | 0.0% (0) | 0.1% (16) |
| Health and personal care, except drug, stores | 0.1% (60) | 0.0% (0) | 0.2% (60) | 0.3% (151) | 0.0% (0) | 0.6% (151) |
| Data processing, libraries, and other information services | 0.1% (56) | 0.1% (20) | 0.1% (36) | 0.3% (146) | 0.2% (54) | 0.4% (92) |
| Mining, quarrying, and oil and gas extraction | 0.1% (49) | 0.1% (21) | 0.1% (28) | 0.1% (42) | 0.2% (42) | 0.0% (0) |
| Rail transportation | 0.1% (47) | 0.2% (47) | 0.0% (0) | 0.2% (95) | 0.3% (84) | 0.0% (11) |
| Alcoholic beverages merchant wholesalers | 0.1% (43) | 0.2% (43) | 0.0% (0) | 0.1% (47) | 0.2% (41) | 0.0% (6) |
| Farm supplies merchant wholesalers | 0.1% (39) | 0.2% (39) | 0.0% (0) | 0.0% (0) | 0.0% (0) | 0.0% (0) |
| Office supplies and stationery stores | 0.1% (38) | 0.1% (38) | 0.0% (0) | 0.3% (135) | 0.3% (78) | 0.2% (57) |
| Electrical and electronic goods merchant wholesalers | 0.1% (38) | 0.0% (8) | 0.1% (30) | 0.5% (249) | 0.6% (149) | 0.4% (100) |
| Professional and commercial equipment and supplies merchant wholesalers | 0.1% (37) | 0.1% (37) | 0.0% (0) | 0.2% (104) | 0.3% (69) | 0.1% (35) |
| Paper | 0.1% (36) | 0.1% (36) | 0.0% (0) | 0.3% (129) | 0.4% (91) | 0.2% (38) |
| Fuel dealers | 0.1% (27) | 0.1% (27) | 0.0% (0) | 0.0% (0) | 0.0% (0) | 0.0% (0) |
| Apparel | 0.0% (3) | 0.0% (0) | 0.0% (3) | 0.1% (60) | 0.0% (6) | 0.2% (54) |
| Book stores and news dealers | 0.0% (0) | 0.0% (0) | 0.0% (0) | 0.1% (53) | 0.0% (8) | 0.2% (45) |
| Miscellaneous durable goods merchant wholesalers | 0.0% (0) | 0.0% (0) | 0.0% (0) | 0.1% (57) | 0.2% (43) | 0.1% (14) |
| Furniture and home furnishing merchant wholesalers | 0.0% (0) | 0.0% (0) | 0.0% (0) | 0.1% (27) | 0.1% (27) | 0.0% (0) |
| Petroleum and coal products | 0.0% (0) | 0.0% (0) | 0.0% (0) | 0.1% (42) | 0.2% (42) | 0.0% (0) |
Unemployment in Davenport
- Unemployment by race in 2022
- Unemployment rate for White non-Hispanic residents
- 4.8%Males
- 1.9%Females
- Unemployment rate for Black residents
- 13.0%Males
- 10.1%Females
- Unemployment rate for American Indian and Alaska Native residents
- 10.4%Females
- Unemployment rate for Asian residents
- 2.9%Males
- Unemployment rate for other race residents
- 1.2%Males
- 2.3%Females
- Unemployment rate for two or more race residents
- 6.6%Males
- 6.1%Females
- Unemployment rate for Hispanic or Latino residents
- 3.2%Males
- 0.7%Females
- Unemployment by race in 2000
- Unemployment rate for White non-Hispanic residents
- 5.5%Males
- 4.2%Females
- Unemployment rate for Black residents
- 20.2%Males
- 12.2%Females
- Unemployment rate for American Indian and Alaska Native residents
- 14.1%Males
- Unemployment rate for Asian residents
- 4.5%Males
- 8.9%Females
- Unemployment rate for other race residents
- 12.8%Males
- 10.7%Females
- Unemployment rate for two or more race residents
- 12.6%Males
- 9.0%Females
- Unemployment rate for Hispanic or Latino residents
- 12.3%Males
- 14.8%Females
Unemployment in 2023:
| Davenport: | 3.5% |
| Iowa: | 2.7% |
Unemployment in 2022:
| Davenport: | 3.6% |
| Iowa: | 2.7% |
Unemployment in 2021:
| Davenport: | 5.6% |
| Iowa: | 3.8% |
Unemployment in 2020:
| Davenport: | 7.8% |
| Iowa: | 5.2% |
Unemployment in 2019:
| Davenport: | 3.8% |
| Iowa: | 2.7% |
Unemployment in 2018:
| Davenport: | 3.4% |
| Iowa: | 2.6% |
Unemployment in 2017:
| Davenport: | 4.0% |
| Iowa: | 3.1% |
Unemployment in 2016:
| Davenport: | 4.9% |
| Iowa: | 3.6% |
Unemployment in 2015:
| Davenport: | 5.0% |
| Iowa: | 3.7% |
Unemployment in 2014:
| Davenport: | 5.6% |
| Iowa: | 4.2% |
Unemployment in 2013:
| Davenport: | 6.1% |
| Iowa: | 4.7% |
Unemployment in 2012:
| Davenport: | 6.1% |
| Iowa: | 5.1% |
Unemployment in 2011:
| Davenport: | 6.6% |
| Iowa: | 5.6% |
Unemployment in 2010:
| Davenport: | 7.1% |
| Iowa: | 6.1% |
Unemployment in 2009:
| Davenport: | 7.5% |
| Iowa: | 6.4% |
Unemployment in 2008:
| Davenport: | 4.4% |
| Iowa: | 4.1% |
Unemployment in 2007:
| Davenport: | 3.7% |
| Iowa: | 3.7% |
Unemployment in 2006:
| Davenport: | 3.7% |
| Iowa: | 3.7% |
Unemployment in 2005:
| Davenport: | 4.0% |
| Iowa: | 4.3% |
Unemployment in 2004:
| Davenport: | 5.7% |
| Iowa: | 4.5% |
Unemployment in 2003:
| Davenport: | 5.5% |
| Iowa: | 4.4% |
Unemployment in 2002:
| Davenport: | 5.4% |
| Iowa: | 4.0% |
Unemployment in 2001:
| Davenport: | 4.7% |
| Iowa: | 3.3% |
Unemployment in 2000:
| Davenport: | 3.8% |
| Iowa: | 2.7% |
Unemployment in 1999:
| Davenport: | 3.8% |
| Iowa: | 2.7% |
Unemployment in 1998:
| Davenport: | 3.3% |
| Iowa: | 2.8% |
Unemployment in 1997:
| Davenport: | 3.7% |
| Iowa: | 3.1% |
Unemployment in 1996:
| Davenport: | 4.4% |
| Iowa: | 3.6% |
Unemployment in 1995:
| Davenport: | 4.3% |
| Iowa: | 3.5% |
Unemployment in 1994:
| Davenport: | 4.8% |
| Iowa: | 3.6% |
Unemployment in 1993:
| Davenport: | 5.8% |
| Iowa: | 4.1% |
Unemployment in 1992:
| Davenport: | 6.5% |
| Iowa: | 4.5% |
Unemployment in 1991:
| Davenport: | 5.9% |
| Iowa: | 4.7% |
Unemployment in 1990:
| Davenport: | 5.2% |
| Iowa: | 4.4% |
Time leaving home to go to work
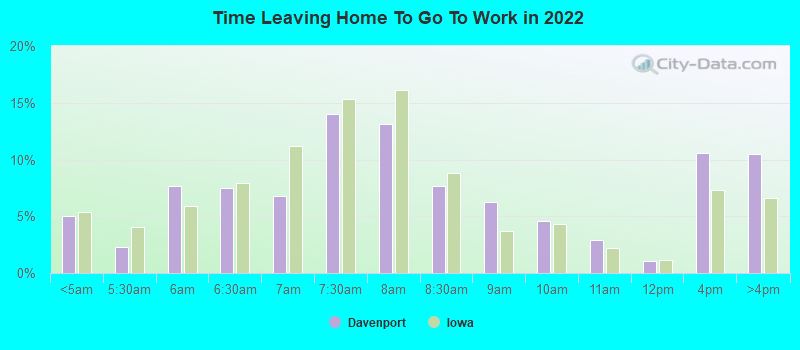
12:00 a.m. to 4:59 a.m.:
| Davenport: | 5.0% (2,252) |
| Iowa: | 5.4% (78,069) |
5:00 a.m. to 5:29 a.m.:
| Davenport: | 2.3% (1,038) |
| Iowa: | 4.1% (59,137) |
5:30 a.m. to 5:59 a.m.:
| Davenport: | 7.7% (3,425) |
| Iowa: | 5.9% (85,191) |
6:00 a.m. to 6:29 a.m.:
| Davenport: | 7.5% (3,332) |
| Iowa: | 7.9% (115,215) |
6:30 a.m. to 6:59 a.m.:
| Davenport: | 6.8% (3,029) |
| Iowa: | 11.2% (163,096) |
7:00 a.m. to 7:29 a.m.:
| Davenport: | 14.0% (6,266) |
| Iowa: | 15.3% (222,036) |
7:30 a.m. to 7:59 a.m.:
| Davenport: | 13.1% (5,846) |
| Iowa: | 16.1% (233,545) |
8:00 a.m. to 8:29 a.m.:
| Davenport: | 7.6% (3,403) |
| Iowa: | 8.8% (128,101) |
8:30 a.m. to 8:59 a.m.:
| Davenport: | 6.3% (2,799) |
| Iowa: | 3.7% (54,230) |
9:00 a.m. to 9:59 a.m.:
| Davenport: | 4.6% (2,053) |
| Iowa: | 4.4% (63,292) |
10:00 a.m. to 10:59 a.m.:
| Davenport: | 2.9% (1,295) |
| Iowa: | 2.2% (31,476) |
11:00 a.m. to 11:59 a.m.:
| Davenport: | 1.1% (485) |
| Iowa: | 1.1% (16,255) |
12:00 p.m. to 3:59 p.m.:
| Davenport: | 10.6% (4,735) |
| Iowa: | 7.3% (106,198) |
4:00 p.m. to 11:59 p.m.:
| Davenport: | 10.5% (4,668) |
| Iowa: | 6.6% (96,179) |

<5am:
| Davenport: | 3.7% (1,731) |
| Iowa: | 3.2% (47,736) |
5:30am:
| Davenport: | 2.6% (1,210) |
| Iowa: | 2.9% (42,797) |
6am:
| Davenport: | 4.3% (2,040) |
| Iowa: | 4.6% (68,195) |
6:30am:
| Davenport: | 7.5% (3,516) |
| Iowa: | 7.5% (110,529) |
7am:
| Davenport: | 11.2% (5,275) |
| Iowa: | 11.2% (164,470) |
7:30am:
| Davenport: | 12.4% (5,819) |
| Iowa: | 14.2% (208,547) |
8am:
| Davenport: | 16.8% (7,919) |
| Iowa: | 17.7% (260,172) |
8:30am:
| Davenport: | 8.0% (3,757) |
| Iowa: | 8.3% (121,843) |
9am:
| Davenport: | 4.2% (1,954) |
| Iowa: | 3.6% (53,363) |
10am:
| Davenport: | 3.9% (1,852) |
| Iowa: | 3.6% (53,533) |
11am:
| Davenport: | 2.2% (1,013) |
| Iowa: | 1.7% (25,691) |
12pm:
| Davenport: | 1.1% (532) |
| Iowa: | 0.9% (13,464) |
4pm:
| Davenport: | 9.6% (4,537) |
| Iowa: | 8.0% (117,038) |
>4pm:
| Davenport: | 10.0% (4,724) |
| Iowa: | 7.7% (112,601) |

12:00 a.m. to 4:59 a.m. - Males:
| Davenport: | 8.0% (1,887) |
| Iowa: | 7.0% (54,907) |
5:00 a.m. to 5:29 a.m. - Males:
| Davenport: | 2.5% (581) |
| Iowa: | 5.0% (38,853) |
5:30 a.m. to 5:59 a.m. - Males:
| Davenport: | 8.8% (2,085) |
| Iowa: | 6.9% (54,231) |
6:00 a.m. to 6:29 a.m. - Males:
| Davenport: | 10.0% (2,349) |
| Iowa: | 9.7% (76,023) |
6:30 a.m. to 6:59 a.m. - Males:
| Davenport: | 7.3% (1,728) |
| Iowa: | 12.3% (95,751) |
7:00 a.m. to 7:29 a.m. - Males:
| Davenport: | 11.0% (2,589) |
| Iowa: | 14.1% (110,477) |
7:30 a.m. to 7:59 a.m. - Males:
| Davenport: | 9.9% (2,331) |
| Iowa: | 13.3% (103,974) |
8:00 a.m. to 8:29 a.m. - Males:
| Davenport: | 6.5% (1,538) |
| Iowa: | 8.0% (62,850) |
8:30 a.m. to 8:59 a.m. - Males:
| Davenport: | 6.2% (1,454) |
| Iowa: | 3.0% (23,631) |
9:00 a.m. to 9:59 a.m. - Males:
| Davenport: | 4.1% (963) |
| Iowa: | 3.8% (29,331) |
10:00 a.m. to 10:59 a.m. - Males:
| Davenport: | 2.1% (495) |
| Iowa: | 1.8% (14,356) |
11:00 a.m. to 11:59 a.m. - Males:
| Davenport: | 1.4% (333) |
| Iowa: | 1.0% (7,664) |
12:00 p.m. to 3:59 p.m. - Males:
| Davenport: | 8.9% (2,092) |
| Iowa: | 7.3% (57,343) |
4:00 p.m. to 11:59 p.m. - Males:
| Davenport: | 13.4% (3,172) |
| Iowa: | 6.7% (51,988) |

12:00 a.m. to 4:59 a.m. - Females:
| Davenport: | 1.7% (365) |
| Iowa: | 3.5% (23,162) |
5:00 a.m. to 5:29 a.m. - Females:
| Davenport: | 2.2% (457) |
| Iowa: | 3.0% (20,284) |
5:30 a.m. to 5:59 a.m. - Females:
| Davenport: | 6.4% (1,340) |
| Iowa: | 4.6% (30,960) |
6:00 a.m. to 6:29 a.m. - Females:
| Davenport: | 4.7% (983) |
| Iowa: | 5.8% (39,192) |
6:30 a.m. to 6:59 a.m. - Females:
| Davenport: | 6.2% (1,301) |
| Iowa: | 10.0% (67,345) |
7:00 a.m. to 7:29 a.m. - Females:
| Davenport: | 17.5% (3,677) |
| Iowa: | 16.6% (111,559) |
7:30 a.m. to 7:59 a.m. - Females:
| Davenport: | 16.7% (3,515) |
| Iowa: | 19.3% (129,571) |
8:00 a.m. to 8:29 a.m. - Females:
| Davenport: | 8.9% (1,865) |
| Iowa: | 9.7% (65,251) |
8:30 a.m. to 8:59 a.m. - Females:
| Davenport: | 6.4% (1,345) |
| Iowa: | 4.6% (30,599) |
9:00 a.m. to 9:59 a.m. - Females:
| Davenport: | 5.2% (1,090) |
| Iowa: | 5.1% (33,961) |
10:00 a.m. to 10:59 a.m. - Females:
| Davenport: | 3.8% (800) |
| Iowa: | 2.6% (17,120) |
11:00 a.m. to 11:59 a.m. - Females:
| Davenport: | 0.7% (152) |
| Iowa: | 1.3% (8,591) |
12:00 p.m. to 3:59 p.m. - Females:
| Davenport: | 12.6% (2,643) |
| Iowa: | 7.3% (48,855) |
4:00 p.m. to 11:59 p.m. - Females:
| Davenport: | 7.1% (1,496) |
| Iowa: | 6.6% (44,191) |
Travel time to work
Percentage of workers working in this county: 80.7%
Number of people working at home: 3,885 (7.7% of all workers)
Daytime population change due to commuting: +10,887 (+11.1%)
Workers who live and work in this city: 30,505 (64.8%)
Number of people working at home: 3,885 (7.7% of all workers)
Daytime population change due to commuting: +10,887 (+11.1%)
Workers who live and work in this city: 30,505 (64.8%)

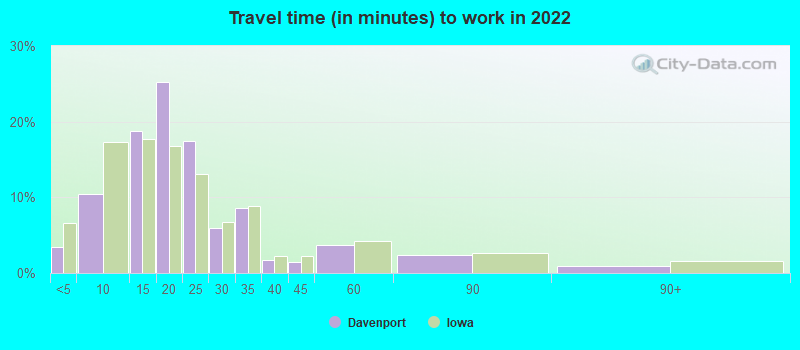

Less than 5 minutes:
| Davenport: | 3.4% (1,844) |
| Iowa: | 6.6% (95,496) |
5 to 9 minutes:
| Davenport: | 10.5% (5,601) |
| Iowa: | 17.3% (250,741) |
10 to 14 minutes:
| Davenport: | 18.8% (10,082) |
| Iowa: | 17.7% (257,557) |
15 to 19 minutes:
| Davenport: | 25.3% (13,535) |
| Iowa: | 16.8% (243,839) |
20 to 24 minutes:
| Davenport: | 17.5% (9,363) |
| Iowa: | 13.1% (190,675) |
25 to 29 minutes:
| Davenport: | 5.9% (3,155) |
| Iowa: | 6.7% (97,304) |
30 to 34 minutes:
| Davenport: | 8.6% (4,613) |
| Iowa: | 8.9% (129,029) |
35 to 39 minutes:
| Davenport: | 1.7% (926) |
| Iowa: | 2.2% (32,071) |
40 to 44 minutes:
| Davenport: | 1.4% (769) |
| Iowa: | 2.3% (33,530) |
45 to 59 minutes:
| Davenport: | 3.7% (1,971) |
| Iowa: | 4.2% (60,805) |
60 to 89 minutes:
| Davenport: | 2.3% (1,249) |
| Iowa: | 2.6% (37,616) |
90 or more minutes:
| Davenport: | 0.9% (460) |
| Iowa: | 1.6% (22,955) |


Less than 5 minutes:
| Davenport: | 3.2% (1,510) |
| Iowa: | 6.8% (100,616) |
5 to 9 minutes:
| Davenport: | 15.5% (7,288) |
| Iowa: | 18.5% (271,589) |
10 to 14 minutes:
| Davenport: | 25.1% (11,804) |
| Iowa: | 19.3% (283,804) |
15 to 19 minutes:
| Davenport: | 22.0% (10,373) |
| Iowa: | 16.0% (234,745) |
20 to 24 minutes:
| Davenport: | 15.4% (7,258) |
| Iowa: | 12.5% (183,539) |
25 to 29 minutes:
| Davenport: | 4.2% (1,958) |
| Iowa: | 4.6% (67,775) |
30 to 34 minutes:
| Davenport: | 5.3% (2,494) |
| Iowa: | 7.6% (111,454) |
35 to 39 minutes:
| Davenport: | 0.6% (271) |
| Iowa: | 1.5% (22,220) |
40 to 44 minutes:
| Davenport: | 0.9% (415) |
| Iowa: | 1.7% (24,880) |
45 to 59 minutes:
| Davenport: | 2.4% (1,125) |
| Iowa: | 3.4% (49,913) |
60 to 89 minutes:
| Davenport: | 1.6% (776) |
| Iowa: | 2.0% (28,703) |
90 or more minutes:
| Davenport: | 1.3% (607) |
| Iowa: | 1.4% (20,741) |

Less than 5 minutes - Males:
| Davenport: | 3.5% (904) |
| Iowa: | 6.6% (51,625) |
5 to 9 minutes - Males:
| Davenport: | 8.1% (2,130) |
| Iowa: | 16.0% (124,588) |
10 to 14 minutes - Males:
| Davenport: | 12.7% (3,309) |
| Iowa: | 16.9% (131,859) |
15 to 19 minutes - Males:
| Davenport: | 29.7% (7,778) |
| Iowa: | 16.5% (128,726) |
20 to 24 minutes - Males:
| Davenport: | 16.3% (4,251) |
| Iowa: | 13.7% (107,194) |
25 to 29 minutes - Males:
| Davenport: | 4.1% (1,081) |
| Iowa: | 6.2% (48,704) |
30 to 34 minutes - Males:
| Davenport: | 12.3% (3,212) |
| Iowa: | 10.1% (78,492) |
35 to 39 minutes - Males:
| Davenport: | 2.3% (590) |
| Iowa: | 2.2% (17,505) |
40 to 44 minutes - Males:
| Davenport: | 1.1% (282) |
| Iowa: | 2.5% (19,340) |
45 to 59 minutes - Males:
| Davenport: | 4.8% (1,253) |
| Iowa: | 4.2% (32,880) |
60 to 89 minutes - Males:
| Davenport: | 4.1% (1,065) |
| Iowa: | 3.2% (24,911) |
90 or more minutes - Males:
| Davenport: | 1.1% (293) |
| Iowa: | 1.9% (14,756) |

Less than 5 minutes - Females:
| Davenport: | 3.4% (940) |
| Iowa: | 6.5% (43,871) |
5 to 9 minutes - Females:
| Davenport: | 12.7% (3,471) |
| Iowa: | 18.8% (126,153) |
10 to 14 minutes - Females:
| Davenport: | 24.7% (6,773) |
| Iowa: | 18.7% (125,698) |
15 to 19 minutes - Females:
| Davenport: | 21.0% (5,757) |
| Iowa: | 17.2% (115,113) |
20 to 24 minutes - Females:
| Davenport: | 18.6% (5,112) |
| Iowa: | 12.4% (83,481) |
25 to 29 minutes - Females:
| Davenport: | 7.6% (2,074) |
| Iowa: | 7.2% (48,600) |
30 to 34 minutes - Females:
| Davenport: | 5.1% (1,401) |
| Iowa: | 7.5% (50,537) |
35 to 39 minutes - Females:
| Davenport: | 1.2% (336) |
| Iowa: | 2.2% (14,566) |
40 to 44 minutes - Females:
| Davenport: | 1.8% (487) |
| Iowa: | 2.1% (14,190) |
45 to 59 minutes - Females:
| Davenport: | 2.6% (718) |
| Iowa: | 4.2% (27,925) |
60 to 89 minutes - Females:
| Davenport: | 0.7% (184) |
| Iowa: | 1.9% (12,705) |
90 or more minutes - Females:
| Davenport: | 0.6% (167) |
| Iowa: | 1.2% (8,199) |
Means of transportation to work
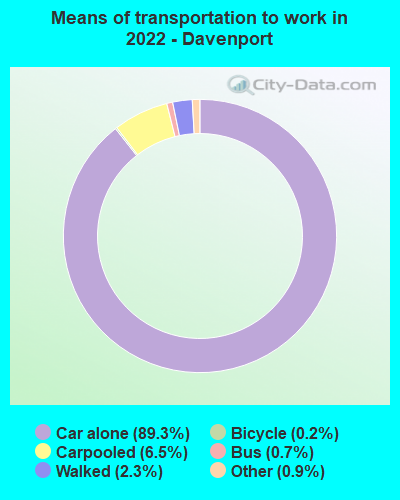
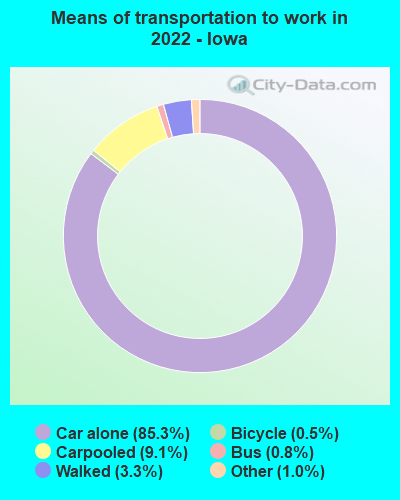
Drove car alone:
| Davenport: | 89.3% (51,666) |
| Iowa: | 85.3% (570,774) |
Carpooled:
| Davenport: | 6.5% (3,787) |
| Iowa: | 9.1% (65,446) |
Bus:
| Davenport: | 0.7% (407) |
| Iowa: | 0.8% (5,487) |
Subway or elevated rail:
| Davenport: | 0.0% (10) |
| Iowa: | 0.0% (22) |
Long-distance train or commuter rail:
| Davenport: | 0.1% (38) |
| Iowa: | 0.0% (0) |
Ferryboat:
| Davenport: | 0.0% (6) |
| Iowa: | 0.0% (67) |
Bicycle:
| Davenport: | 0.2% (97) |
| Iowa: | 0.5% (1,516) |
Walked:
| Davenport: | 2.3% (1,325) |
| Iowa: | 3.3% (21,070) |
Other means:
| Davenport: | 0.9% (544) |
| Iowa: | 1.0% (6,656) |

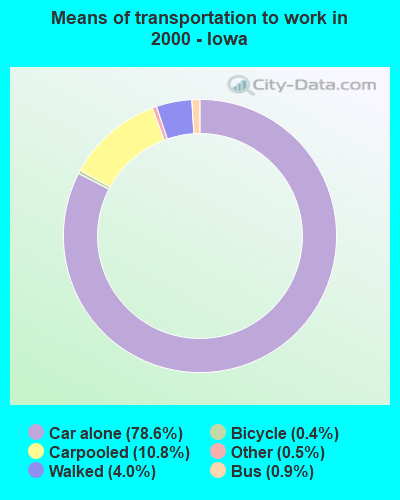
Drove car alone:
| Davenport: | 83.6% (39,353) |
| Iowa: | 78.6% (1,155,008) |
Carpooled:
| Davenport: | 9.7% (4,554) |
| Iowa: | 10.8% (158,699) |
Bus or trolley bus:
| Davenport: | 1.0% (486) |
| Iowa: | 0.9% (13,917) |
Railroad:
| Davenport: | 0.0% (11) |
| Iowa: | 0.0% (49) |
Taxicab:
| Davenport: | 0.0% (4) |
| Iowa: | 0.0% (730) |
Motorcycle:
| Davenport: | 0.0% (10) |
| Iowa: | 0.1% (766) |
Bicycle:
| Davenport: | 0.2% (90) |
| Iowa: | 0.4% (5,244) |
Walked:
| Davenport: | 2.2% (1,038) |
| Iowa: | 4.0% (58,088) |
Other means:
| Davenport: | 0.7% (333) |
| Iowa: | 0.5% (7,153) |


Drove car alone - Males:
| Davenport: | 88.6% (25,079) |
| Iowa: | 85.5% (570,774) |
Carpooled - Males:
| Davenport: | 6.7% (1,892) |
| Iowa: | 8.6% (65,446) |
Bus - Males:
| Davenport: | 0.7% (206) |
| Iowa: | 0.9% (5,487) |
Subway or elevated rail - Males:
| Davenport: | 0.0% (10) |
| Iowa: | 0.0% (22) |
Long-distance train or commuter rail - Males:
| Davenport: | 0.1% (36) |
| Iowa: | 0.0% (0) |
Ferryboat - Males:
| Davenport: | 0.0% (3) |
| Iowa: | 0.0% (67) |
Bicycle - Males:
| Davenport: | 0.3% (92) |
| Iowa: | 0.6% (1,516) |
Walked - Males:
| Davenport: | 2.7% (763) |
| Iowa: | 3.4% (21,070) |
Other means - Males:
| Davenport: | 0.8% (233) |
| Iowa: | 1.0% (6,656) |

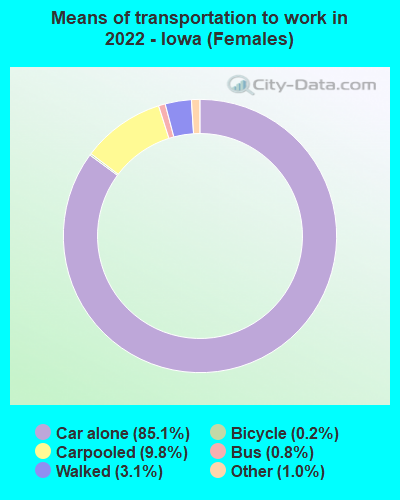
Drove car alone - Females:
| Davenport: | 90.0% (26,639) |
| Iowa: | 85.1% (570,774) |
Carpooled - Females:
| Davenport: | 6.4% (1,894) |
| Iowa: | 9.8% (65,446) |
Bus - Females:
| Davenport: | 0.7% (200) |
| Iowa: | 0.8% (5,487) |
Ferryboat - Females:
| Davenport: | 0.0% (3) |
| Iowa: | 0.0% (67) |
Walked - Females:
| Davenport: | 1.9% (551) |
| Iowa: | 3.1% (21,070) |
Other means - Females:
| Davenport: | 1.1% (315) |
| Iowa: | 1.0% (6,656) |
Private vehicle occupancy

Drove alone:
| Davenport: | 90.6% (39,804) |
| Iowa: | 90.5% (1,240,859) |
In 2 person carpool:
| Davenport: | 6.8% (3,001) |
| Iowa: | 6.9% (94,195) |
In 3 person carpool:
| Davenport: | 0.9% (405) |
| Iowa: | 1.4% (19,770) |
In 4 person carpool:
| Davenport: | 0.9% (374) |
| Iowa: | 0.7% (10,059) |
In 5-6 person carpool:
| Davenport: | 0.7% (304) |
| Iowa: | 0.3% (4,603) |
In 7+ person carpool:
| Davenport: | 0.1% (52) |
| Iowa: | 0.2% (2,104) |

Drove alone:
| Davenport: | 89.6% (39,353) |
| Iowa: | 87.9% (1,155,008) |
In 2 person carpool:
| Davenport: | 8.7% (3,798) |
| Iowa: | 9.8% (128,891) |
In 3 person carpool:
| Davenport: | 1.0% (449) |
| Iowa: | 1.4% (18,510) |
In 4 person carpool:
| Davenport: | 0.4% (171) |
| Iowa: | 0.5% (6,602) |
In 5-6 person carpool:
| Davenport: | 0.2% (79) |
| Iowa: | 0.2% (2,434) |
In 7+ person carpool:
| Davenport: | 0.1% (57) |
| Iowa: | 0.2% (2,262) |
Class of workers
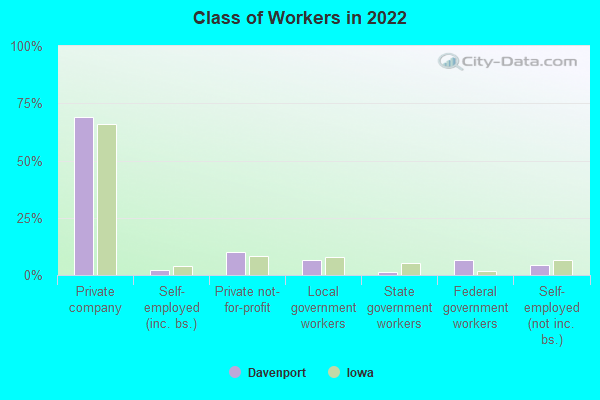
Employee of private company:
| Davenport: | 68.9% (35,624) |
| Iowa: | 66.1% (1,096,595) |
Self-employed in own incorporated business:
| Davenport: | 2.2% (1,127) |
| Iowa: | 4.1% (67,511) |
Private not-for-profit wage and salary workers:
| Davenport: | 10.1% (5,239) |
| Iowa: | 8.5% (140,926) |
Local government workers:
| Davenport: | 6.4% (3,286) |
| Iowa: | 7.8% (129,397) |
State government workers:
| Davenport: | 1.4% (742) |
| Iowa: | 5.2% (86,770) |
Federal government workers:
| Davenport: | 6.6% (3,430) |
| Iowa: | 1.7% (28,231) |
Self-employed workers in own not incorporated business:
| Davenport: | 4.2% (2,148) |
| Iowa: | 6.3% (105,099) |
Unpaid family workers:
| Davenport: | 0.2% (94) |
| Iowa: | 0.2% (4,078) |

Employee of private company:
| Davenport: | 72.7% (34,700) |
| Iowa: | 66.6% (992,122) |
Self-employed in own incorporated business:
| Davenport: | 2.1% (1,021) |
| Iowa: | 3.0% (44,330) |
Private not-for-profit wage and salary workers:
| Davenport: | 9.3% (4,424) |
| Iowa: | 8.2% (121,940) |
Local government workers:
| Davenport: | 5.1% (2,440) |
| Iowa: | 6.1% (90,430) |
State government workers:
| Davenport: | 2.2% (1,034) |
| Iowa: | 5.8% (85,726) |
Federal government workers:
| Davenport: | 3.7% (1,761) |
| Iowa: | 1.8% (27,176) |
Self-employed workers in own not incorporated business:
| Davenport: | 4.9% (2,320) |
| Iowa: | 8.2% (121,579) |
Unpaid family workers:
| Davenport: | 0.1% (37) |
| Iowa: | 0.4% (6,513) |

Employee of private company - Males:
| Davenport: | 77.1% (20,659) |
| Iowa: | 70.3% (615,735) |
Self-employed in own incorporated business - Males:
| Davenport: | 2.6% (694) |
| Iowa: | 5.3% (46,477) |
Private not-for-profit wage and salary workers - Males:
| Davenport: | 8.0% (2,142) |
| Iowa: | 5.1% (44,923) |
Local government workers - Males:
| Davenport: | 3.2% (845) |
| Iowa: | 5.7% (49,834) |
State government workers - Males:
| Davenport: | 0.3% (88) |
| Iowa: | 4.4% (38,327) |
Federal government workers - Males:
| Davenport: | 5.0% (1,336) |
| Iowa: | 1.7% (14,570) |
Self-employed workers in own not incorporated business - Males:
| Davenport: | 3.7% (1,004) |
| Iowa: | 7.4% (64,591) |
Unpaid family workers - Males:
| Davenport: | 0.2% (42) |
| Iowa: | 0.2% (1,932) |

Employee of private company - Females:
| Davenport: | 60.1% (14,965) |
| Iowa: | 61.5% (480,860) |
Self-employed in own incorporated business - Females:
| Davenport: | 1.7% (433) |
| Iowa: | 2.7% (21,034) |
Private not-for-profit wage and salary workers - Females:
| Davenport: | 12.4% (3,097) |
| Iowa: | 12.3% (96,003) |
Local government workers - Females:
| Davenport: | 9.8% (2,441) |
| Iowa: | 10.2% (79,563) |
State government workers - Females:
| Davenport: | 2.6% (654) |
| Iowa: | 6.2% (48,443) |
Federal government workers - Females:
| Davenport: | 8.4% (2,094) |
| Iowa: | 1.7% (13,661) |
Self-employed workers in own not incorporated business - Females:
| Davenport: | 4.6% (1,144) |
| Iowa: | 5.2% (40,508) |
Unpaid family workers - Females:
| Davenport: | 0.2% (52) |
| Iowa: | 0.3% (2,146) |