Work and Jobs in Damon, Texas (TX) Detailed Stats
Occupations, Industries, Unemployment, Workers, Commute
Settings
X


Recent posts about work in Damon, Texas on our local forum with over 2,400,000 registered users:
 | North Frisco, TX./Field's Project & PGA Frisco HQ (94 replies) |
| Coronavirus in DFW - News & Discussion (3109 replies) |
| historic house (37 replies) |
| A movie for those who work in the Oil and Gas industry... (57 replies) |
| Famous and Infamous People from Tiny Floyd County Texas (9 replies) |
| Anyone remember Darlie Routier murder case? (33 replies) |
Latest news about work in Damon, TX collected exclusively by city-data.com from local newspapers, TV, and radio stations
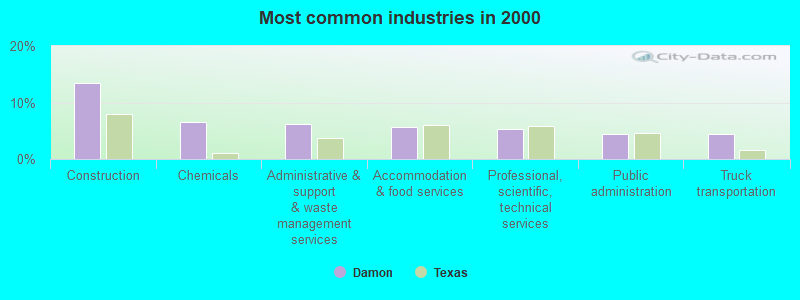
The most common industries in Damon are: Construction (13.5% of civilian employees), Chemicals (6.6% of civilian employees), Administrative & support & waste management services (6.1% of civilian employees). 100.0% of workers work in Brazoria County and 54.5% of all workers work at home. 45.5% of workers are employees of private companies, which is 53.0% less than the rate of 69.6% across the entire state of Texas.
Whole page based on the data from 2000 / 2022 when the population of Damon, Texas was 535 / 112
Whole page based on the data from 2000 / 2022 when the population of Damon, Texas was 535 / 112
Most common industries

Most common industries | |||
|---|---|---|---|
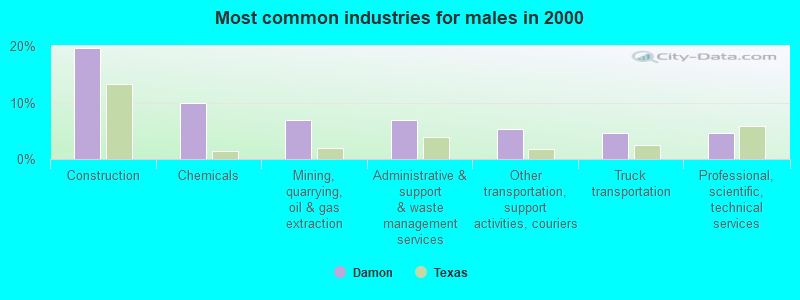
Industry | All | Males | Females |
| Construction | 13.5% (31) | 19.7% (26) | 5.2% (5) |
| Chemicals | 6.6% (15) | 9.8% (13) | 2.1% (2) |
| Administrative and support and waste management services | 6.1% (14) | 6.8% (9) | 5.2% (5) |
| Accommodation and food services | 5.7% (13) | 0.8% (1) | 12.4% (12) |
| Professional, scientific, and technical services | 5.2% (12) | 4.5% (6) | 6.2% (6) |
| Public administration | 4.4% (10) | 1.5% (2) | 8.2% (8) |
| Truck transportation | 4.4% (10) | 4.5% (6) | 4.1% (4) |
| Mining, quarrying, and oil and gas extraction | 3.9% (9) | 6.8% (9) | 0.0% (0) |
| Health care | 3.5% (8) | 1.5% (2) | 6.2% (6) |
| Department and other general merchandise stores | 3.5% (8) | 0.0% (0) | 8.2% (8) |
| Food and beverage stores | 3.5% (8) | 1.5% (2) | 6.2% (6) |
| Educational services | 3.1% (7) | 0.0% (0) | 7.2% (7) |
| Other transportation, and support activities, and couriers | 3.1% (7) | 5.3% (7) | 0.0% (0) |
| Other direct selling establishments | 3.1% (7) | 0.0% (0) | 7.2% (7) |
| Petroleum and petroleum products merchant wholesalers | 2.6% (6) | 3.0% (4) | 2.1% (2) |
| Broadcasting and telecommunications | 2.6% (6) | 4.5% (6) | 0.0% (0) |
| Religious, grantmaking, civic, professional, and similar organizations | 2.2% (5) | 3.8% (5) | 0.0% (0) |
| Agriculture, forestry, fishing and hunting | 1.7% (4) | 1.5% (2) | 2.1% (2) |
| Personal and laundry services | 1.7% (4) | 0.0% (0) | 4.1% (4) |
| Motor vehicle and parts dealers | 1.7% (4) | 3.0% (4) | 0.0% (0) |
| Metal and metal products | 1.7% (4) | 3.0% (4) | 0.0% (0) |
| Petroleum and coal products | 1.7% (4) | 3.0% (4) | 0.0% (0) |
| Machinery, equipment, and supplies merchant wholesalers | 1.3% (3) | 2.3% (3) | 0.0% (0) |
| Fuel dealers | 1.3% (3) | 2.3% (3) | 0.0% (0) |
| Real estate and rental and leasing | 1.3% (3) | 2.3% (3) | 0.0% (0) |
| Building material and garden equipment and supplies dealers | 1.3% (3) | 2.3% (3) | 0.0% (0) |
| Computer and electronic products | 0.9% (2) | 0.0% (0) | 2.1% (2) |
| Miscellaneous manufacturing | 0.9% (2) | 1.5% (2) | 0.0% (0) |
| Gasoline stations | 0.9% (2) | 0.0% (0) | 2.1% (2) |
| Machinery | 0.9% (2) | 1.5% (2) | 0.0% (0) |
| Miscellaneous nondurable goods merchant wholesalers | 0.9% (2) | 1.5% (2) | 0.0% (0) |
| Utilities | 0.9% (2) | 0.0% (0) | 2.1% (2) |
| Finance and insurance | 0.9% (2) | 0.0% (0) | 2.1% (2) |
| Social assistance | 0.9% (2) | 0.0% (0) | 2.1% (2) |
| Arts, entertainment, and recreation | 0.9% (2) | 0.0% (0) | 2.1% (2) |
| Food | 0.4% (1) | 0.8% (1) | 0.0% (0) |
| Used merchandise, gift, novelty, and souvenir, and other miscellaneous stores | 0.4% (1) | 0.0% (0) | 1.0% (1) |
| Radio, TV, and computer stores | 0.4% (1) | 0.8% (1) | 0.0% (0) |
Unemployment in Damon
- Unemployment by race in 2022
- Unemployment rate for other race residents
- 100.0%Females
- Unemployment rate for Hispanic or Latino residents
- 100.0%Females
- Unemployment by race in 2000
- Unemployment rate for White non-Hispanic residents
- 6.8%Males
- 4.8%Females
- Unemployment rate for other race residents
- 13.6%Males
- 50.0%Females
- Unemployment rate for Hispanic or Latino residents
- 12.2%Males
- 21.7%Females
Time leaving home to go to work
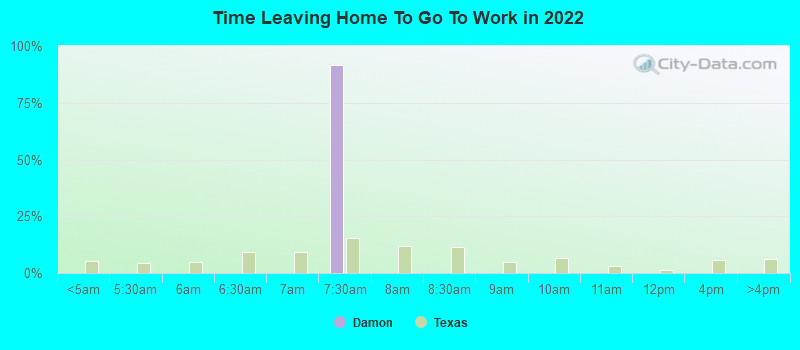
7:00 a.m. to 7:29 a.m.:
| Damon: | 91.8% (9) |
| Texas: | 15.3% (1,885,477) |

<5am:
| Damon: | 6.6% (15) |
| Texas: | 3.1% (281,361) |
5:30am:
| Damon: | 10.2% (23) |
| Texas: | 2.9% (262,060) |
6am:
| Damon: | 3.5% (8) |
| Texas: | 4.4% (403,423) |
6:30am:
| Damon: | 12.4% (28) |
| Texas: | 8.8% (808,876) |
7am:
| Damon: | 13.3% (30) |
| Texas: | 10.7% (976,557) |
7:30am:
| Damon: | 21.2% (48) |
| Texas: | 16.4% (1,500,904) |
8am:
| Damon: | 6.6% (15) |
| Texas: | 16.8% (1,536,308) |
8:30am:
| Damon: | 6.2% (14) |
| Texas: | 10.0% (913,601) |
10am:
| Damon: | 7.5% (17) |
| Texas: | 5.2% (472,592) |
4pm:
| Damon: | 4.9% (11) |
| Texas: | 5.5% (503,565) |
>4pm:
| Damon: | 6.6% (15) |
| Texas: | 6.1% (563,107) |

7:00 a.m. to 7:29 a.m. - Males:
| Damon: | 82.2% (8) |
| Texas: | 14.1% (970,598) |

Travel time to work
Percentage of workers working in this county: 100.0%
Number of people working at home: 12 (54.5% of all workers)
Number of people working at home: 12 (54.5% of all workers)


Less than 5 minutes:
| Damon: | 2.2% (5) |
| Texas: | 3.0% (277,642) |
5 to 9 minutes:
| Damon: | 7.5% (17) |
| Texas: | 10.3% (942,891) |
10 to 14 minutes:
| Damon: | 7.5% (17) |
| Texas: | 14.4% (1,317,555) |
15 to 19 minutes:
| Damon: | 6.2% (14) |
| Texas: | 16.0% (1,467,945) |
20 to 24 minutes:
| Damon: | 8.4% (19) |
| Texas: | 13.9% (1,276,781) |
25 to 29 minutes:
| Damon: | 1.8% (4) |
| Texas: | 5.3% (482,838) |
30 to 34 minutes:
| Damon: | 19.5% (44) |
| Texas: | 14.3% (1,309,699) |
35 to 39 minutes:
| Damon: | 5.8% (13) |
| Texas: | 2.4% (219,873) |
40 to 44 minutes:
| Damon: | 8.4% (19) |
| Texas: | 3.1% (280,916) |
45 to 59 minutes:
| Damon: | 14.2% (32) |
| Texas: | 7.6% (692,006) |
60 to 89 minutes:
| Damon: | 13.3% (30) |
| Texas: | 4.6% (418,905) |
90 or more minutes:
| Damon: | 4.4% (10) |
| Texas: | 2.4% (218,800) |
Means of transportation to work


Drove car alone:
| Damon: | 70.8% (160) |
| Texas: | 77.7% (7,115,590) |
Carpooled:
| Damon: | 25.7% (58) |
| Texas: | 14.5% (1,326,012) |
Walked:
| Damon: | 2.7% (6) |
| Texas: | 1.9% (173,670) |
Private vehicle occupancy

Drove alone:
| Damon: | 99.0% (10) |
| Texas: | 87.6% (10,283,021) |

Drove alone:
| Damon: | 73.4% (160) |
| Texas: | 84.3% (7,115,590) |
In 2 person carpool:
| Damon: | 18.3% (40) |
| Texas: | 11.6% (982,994) |
In 3 person carpool:
| Damon: | 7.3% (16) |
| Texas: | 2.4% (201,602) |
In 4 person carpool:
| Damon: | 0.9% (2) |
| Texas: | 1.0% (83,518) |
Class of workers
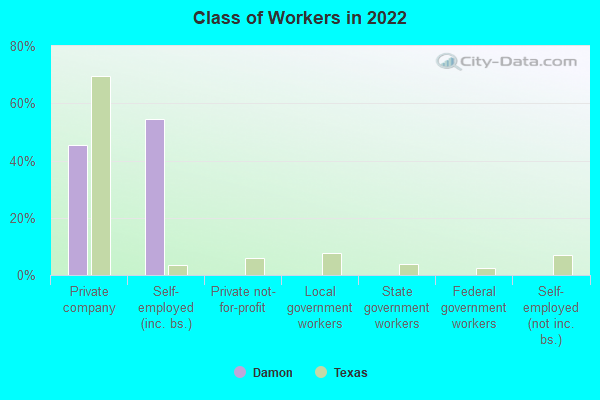
Employee of private company:
| Damon: | 45.5% (10) |
| Texas: | 69.6% (10,139,666) |
Self-employed in own incorporated business:
| Damon: | 54.5% (13) |
| Texas: | 3.5% (516,446) |

Employee of private company:
| Damon: | 72.1% (165) |
| Texas: | 69.6% (6,425,274) |
Self-employed in own incorporated business:
| Damon: | 2.6% (6) |
| Texas: | 2.7% (250,864) |
Private not-for-profit wage and salary workers:
| Damon: | 2.2% (5) |
| Texas: | 5.7% (526,631) |
Local government workers:
| Damon: | 7.9% (18) |
| Texas: | 6.6% (608,479) |
State government workers:
| Damon: | 3.9% (9) |
| Texas: | 5.4% (501,082) |
Self-employed workers in own not incorporated business:
| Damon: | 11.4% (26) |
| Texas: | 7.1% (653,527) |

Employee of private company - Males:
| Damon: | 45.5% (10) |
| Texas: | 73.1% (5,788,450) |
Self-employed in own incorporated business - Males:
| Damon: | 54.5% (13) |
| Texas: | 4.2% (332,655) |
