Work and Jobs in Canton, Ohio (OH) Detailed Stats
Occupations, Industries, Unemployment, Workers, Commute
Settings
X


Recent posts about work in Canton, Ohio on our local forum with over 2,400,000 registered users:
 | What do you LIKE about living in Akron-Canton? (22 replies) |
| Is Stark County fast-growing at all? (2 replies) |
| Safest Canton Neighborhoods (9 replies) |
| Canton, OH- Jobs? (3 replies) |
| 20 Something Looking for a Good Area to Live in Akron & Reasonable Commute to North Canton **Advice Wanted** (3 replies) |
| Tell me about Akron area (17 replies) |
Latest news about work in Canton, OH collected exclusively by city-data.com from local newspapers, TV, and radio stations
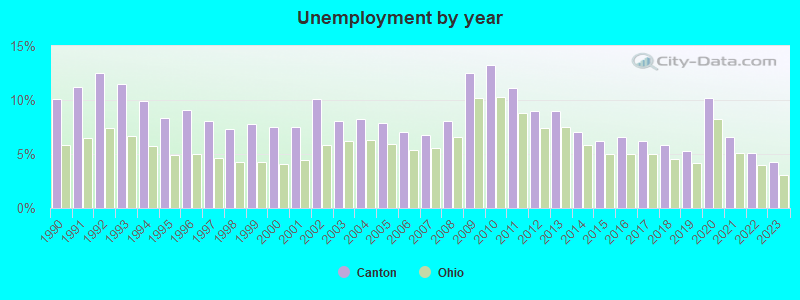
The unemployment rate in 2023 in Canton, OH was 4.3%, which was 27.9% greater than the unemployment rate of 3.1% across the entire state of Ohio. Compared to the unemployment rate of 9.0% in 2013, this represents a decrease of 109.3%. The most common industries in Canton are: Health care (11.2% of civilian employees), Accommodation & food services (8.5% of civilian employees), Metal & metal products (7.2% of civilian employees). 86.6% of workers work in Stark County and 5.9% of all workers work at home. 72.9% of workers are employees of private companies, which is 5.8% greater than the rate of 68.7% across the entire state of Ohio.
Whole page based on the data from 2000 / 2022 when the population of Canton, Ohio was 80,806 / 69,666
Whole page based on the data from 2000 / 2022 when the population of Canton, Ohio was 80,806 / 69,666
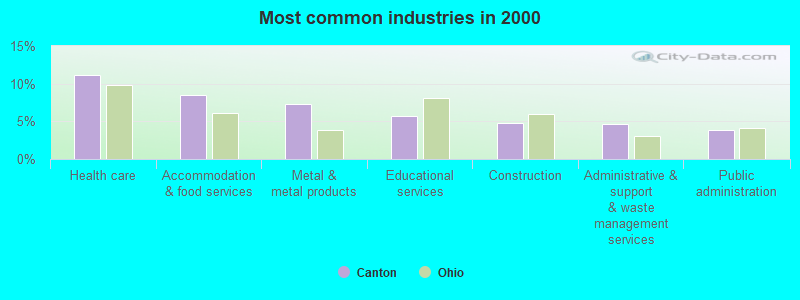
Most common industries
Most common industries | |||
|---|---|---|---|
Industry | All | Males | Females |
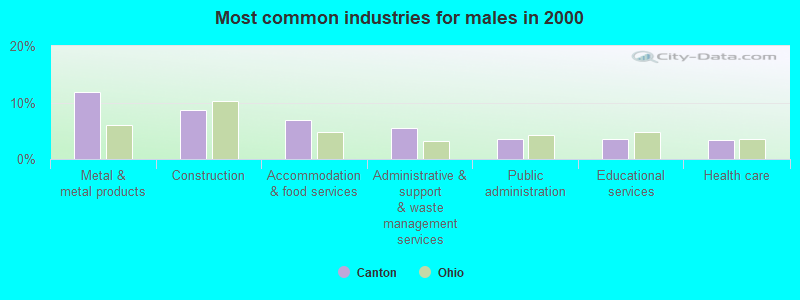
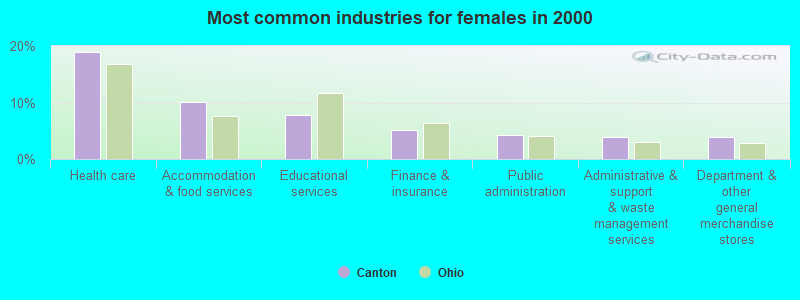
| Health care | 11.2% (3,850) | 3.4% (586) | 18.9% (3,264) |
| Accommodation and food services | 8.5% (2,922) | 6.8% (1,175) | 10.1% (1,747) |
| Metal and metal products | 7.2% (2,499) | 11.9% (2,038) | 2.7% (461) |
| Educational services | 5.7% (1,951) | 3.5% (609) | 7.8% (1,342) |
| Construction | 4.8% (1,662) | 8.6% (1,485) | 1.0% (177) |
| Administrative and support and waste management services | 4.7% (1,619) | 5.5% (941) | 3.9% (678) |
| Public administration | 3.9% (1,339) | 3.6% (618) | 4.2% (721) |
| Finance and insurance | 3.4% (1,176) | 1.8% (303) | 5.1% (873) |
| Plastics and rubber products | 2.8% (963) | 3.3% (562) | 2.3% (401) |
| Professional, scientific, and technical services | 2.5% (867) | 2.5% (428) | 2.5% (439) |
| Food and beverage stores | 2.5% (866) | 1.9% (327) | 3.1% (539) |
| Department and other general merchandise stores | 2.3% (804) | 0.8% (144) | 3.8% (660) |
| Social assistance | 2.3% (798) | 1.1% (186) | 3.5% (612) |
| Personal and laundry services | 2.1% (708) | 1.3% (221) | 2.8% (487) |
| Electrical equipment, appliances, and components | 2.0% (700) | 2.3% (387) | 1.8% (313) |
| Food | 2.0% (673) | 2.4% (407) | 1.5% (266) |
| Religious, grantmaking, civic, professional, and similar organizations | 1.9% (664) | 1.7% (292) | 2.2% (372) |
| Repair and maintenance | 1.6% (567) | 3.1% (527) | 0.2% (40) |
| Miscellaneous manufacturing | 1.6% (544) | 1.9% (320) | 1.3% (224) |
| Truck transportation | 1.5% (534) | 2.8% (489) | 0.3% (45) |
| Machinery | 1.4% (482) | 2.1% (361) | 0.7% (121) |
| Motor vehicle and parts dealers | 1.4% (479) | 2.4% (410) | 0.4% (69) |
| Transportation equipment | 1.1% (395) | 2.0% (339) | 0.3% (56) |
| Real estate and rental and leasing | 1.1% (393) | 1.2% (208) | 1.1% (185) |
| Arts, entertainment, and recreation | 1.1% (384) | 1.3% (221) | 0.9% (163) |
| Other transportation, and support activities, and couriers | 1.0% (356) | 1.3% (231) | 0.7% (125) |
| Printing and related support activities | 1.0% (338) | 1.4% (244) | 0.5% (94) |
| Publishing, and motion picture and sound recording industries | 0.8% (261) | 0.6% (99) | 0.9% (162) |
| Building material and garden equipment and supplies dealers | 0.8% (260) | 1.1% (195) | 0.4% (65) |
| Pharmacies and drug stores | 0.7% (251) | 0.3% (48) | 1.2% (203) |
| U. S. Postal service | 0.7% (241) | 1.0% (170) | 0.4% (71) |
| Clothing and accessories, including shoe, stores | 0.7% (239) | 0.1% (14) | 1.3% (225) |
| Furniture and home furnishings, and household appliance stores | 0.7% (232) | 0.7% (127) | 0.6% (105) |
| Broadcasting and telecommunications | 0.7% (227) | 0.8% (131) | 0.6% (96) |
| Other direct selling establishments | 0.6% (209) | 0.4% (65) | 0.8% (144) |
| Utilities | 0.6% (208) | 0.7% (123) | 0.5% (85) |
| Nonmetallic mineral products | 0.6% (202) | 1.0% (170) | 0.2% (32) |
| Groceries and related products merchant wholesalers | 0.6% (196) | 0.7% (117) | 0.5% (79) |
| Data processing, libraries, and other information services | 0.6% (196) | 0.4% (72) | 0.7% (124) |
| Used merchandise, gift, novelty, and souvenir, and other miscellaneous stores | 0.5% (173) | 0.3% (50) | 0.7% (123) |
| Radio, TV, and computer stores | 0.5% (171) | 0.5% (84) | 0.5% (87) |
| Chemicals | 0.5% (168) | 0.7% (112) | 0.3% (56) |
| Electronic shopping and mail-order houses | 0.5% (162) | 0.3% (58) | 0.6% (104) |
| Machinery, equipment, and supplies merchant wholesalers | 0.4% (138) | 0.6% (108) | 0.2% (30) |
| Computer and electronic products | 0.4% (134) | 0.2% (27) | 0.6% (107) |
| Sporting goods, camera, and hobby and toy stores | 0.4% (131) | 0.2% (37) | 0.5% (94) |
| Gasoline stations | 0.4% (126) | 0.2% (35) | 0.5% (91) |
| Paper | 0.4% (123) | 0.6% (108) | 0.1% (15) |
| Office supplies and stationery stores | 0.4% (121) | 0.3% (50) | 0.4% (71) |
| Miscellaneous nondurable goods merchant wholesalers | 0.3% (120) | 0.6% (99) | 0.1% (21) |
| Health and personal care, except drug, stores | 0.3% (116) | 0.1% (25) | 0.5% (91) |
| Professional and commercial equipment and supplies merchant wholesalers | 0.3% (114) | 0.6% (99) | 0.1% (15) |
| Textile mills and textile products | 0.3% (107) | 0.3% (52) | 0.3% (55) |
| Wood products | 0.3% (104) | 0.4% (73) | 0.2% (31) |
| Lumber and other construction materials merchant wholesalers | 0.3% (88) | 0.5% (88) | 0.0% (0) |
| Recyclable material merchant wholesalers | 0.2% (85) | 0.5% (78) | 0.0% (7) |
| Private households | 0.2% (81) | 0.0% (0) | 0.5% (81) |
| Music stores | 0.2% (79) | 0.2% (40) | 0.2% (39) |
| Electrical and electronic goods merchant wholesalers | 0.2% (77) | 0.4% (64) | 0.1% (13) |
| Alcoholic beverages merchant wholesalers | 0.2% (63) | 0.2% (41) | 0.1% (22) |
| Mining, quarrying, and oil and gas extraction | 0.2% (59) | 0.2% (38) | 0.1% (21) |
| Petroleum and coal products | 0.2% (58) | 0.3% (50) | 0.0% (8) |
| Motor vehicles, parts and supplies merchant wholesalers | 0.2% (56) | 0.3% (48) | 0.0% (8) |
| Agriculture, forestry, fishing and hunting | 0.2% (54) | 0.3% (45) | 0.1% (9) |
| Jewelry, luggage, and leather goods stores | 0.2% (52) | 0.0% (7) | 0.3% (45) |
| Hardware, plumbing and heating equipment, and supplies merchant wholesalers | 0.1% (45) | 0.1% (24) | 0.1% (21) |
| Furniture and related product manufacturing | 0.1% (43) | 0.2% (32) | 0.1% (11) |
| Paper and paper products merchant wholesalers | 0.1% (40) | 0.2% (33) | 0.0% (7) |
| Apparel | 0.1% (38) | 0.1% (18) | 0.1% (20) |
| Metals and minerals, except petroleum, merchant wholesalers | 0.1% (36) | 0.1% (17) | 0.1% (19) |
| Book stores and news dealers | 0.1% (34) | 0.1% (22) | 0.1% (12) |
| Rail transportation | 0.1% (21) | 0.1% (21) | 0.0% (0) |
| Furniture and home furnishing merchant wholesalers | 0.1% (19) | 0.1% (19) | 0.0% (0) |
Unemployment in Canton
- Unemployment by race in 2022
- Unemployment rate for White non-Hispanic residents
- 4.2%Males
- 0.8%Females
- Unemployment rate for Black residents
- 14.9%Males
- 16.4%Females
- Unemployment rate for Asian residents
- 21.2%Males
- 5.9%Females
- Unemployment rate for other race residents
- 18.6%Males
- 11.8%Females
- Unemployment rate for two or more race residents
- 10.2%Males
- 7.0%Females
- Unemployment rate for Hispanic or Latino residents
- 9.1%Males
- 4.9%Females
- Unemployment by race in 2000
- Unemployment rate for White non-Hispanic residents
- 6.3%Males
- 5.7%Females
- Unemployment rate for Black residents
- 15.8%Males
- 11.7%Females
- Unemployment rate for American Indian and Alaska Native residents
- 22.0%Males
- 14.3%Females
- Unemployment rate for Asian residents
- 35.8%Females
- Unemployment rate for other race residents
- 11.1%Males
- 23.6%Females
- Unemployment rate for two or more race residents
- 23.8%Males
- 9.2%Females
- Unemployment rate for Hispanic or Latino residents
- 11.5%Males
- 20.8%Females
Unemployment in 2023:
| Canton: | 4.3% |
| Ohio: | 3.1% |
Unemployment in 2022:
| Canton: | 5.1% |
| Ohio: | 4.0% |
Unemployment in 2021:
| Canton: | 6.6% |
| Ohio: | 5.1% |
Unemployment in 2020:
| Canton: | 10.2% |
| Ohio: | 8.2% |
Unemployment in 2019:
| Canton: | 5.3% |
| Ohio: | 4.2% |
Unemployment in 2018:
| Canton: | 5.8% |
| Ohio: | 4.5% |
Unemployment in 2017:
| Canton: | 6.2% |
| Ohio: | 5.0% |
Unemployment in 2016:
| Canton: | 6.6% |
| Ohio: | 5.0% |
Unemployment in 2015:
| Canton: | 6.2% |
| Ohio: | 5.0% |
Unemployment in 2014:
| Canton: | 7.0% |
| Ohio: | 5.8% |
Unemployment in 2013:
| Canton: | 9.0% |
| Ohio: | 7.5% |
Unemployment in 2012:
| Canton: | 9.0% |
| Ohio: | 7.4% |
Unemployment in 2011:
| Canton: | 11.1% |
| Ohio: | 8.8% |
Unemployment in 2010:
| Canton: | 13.2% |
| Ohio: | 10.3% |
Unemployment in 2009:
| Canton: | 12.5% |
| Ohio: | 10.2% |
Unemployment in 2008:
| Canton: | 8.1% |
| Ohio: | 6.6% |
Unemployment in 2007:
| Canton: | 6.8% |
| Ohio: | 5.6% |
Unemployment in 2006:
| Canton: | 7.0% |
| Ohio: | 5.4% |
Unemployment in 2005:
| Canton: | 7.9% |
| Ohio: | 5.9% |
Unemployment in 2004:
| Canton: | 8.2% |
| Ohio: | 6.3% |
Unemployment in 2003:
| Canton: | 8.1% |
| Ohio: | 6.2% |
Unemployment in 2002:
| Canton: | 10.1% |
| Ohio: | 5.8% |
Unemployment in 2001:
| Canton: | 7.5% |
| Ohio: | 4.4% |
Unemployment in 2000:
| Canton: | 7.5% |
| Ohio: | 4.1% |
Unemployment in 1999:
| Canton: | 7.8% |
| Ohio: | 4.3% |
Unemployment in 1998:
| Canton: | 7.3% |
| Ohio: | 4.3% |
Unemployment in 1997:
| Canton: | 8.1% |
| Ohio: | 4.6% |
Unemployment in 1996:
| Canton: | 9.1% |
| Ohio: | 5.0% |
Unemployment in 1995:
| Canton: | 8.3% |
| Ohio: | 4.9% |
Unemployment in 1994:
| Canton: | 9.9% |
| Ohio: | 5.7% |
Unemployment in 1993:
| Canton: | 11.5% |
| Ohio: | 6.7% |
Unemployment in 1992:
| Canton: | 12.5% |
| Ohio: | 7.4% |
Unemployment in 1991:
| Canton: | 11.2% |
| Ohio: | 6.5% |
Unemployment in 1990:
| Canton: | 10.1% |
| Ohio: | 5.8% |
Time leaving home to go to work
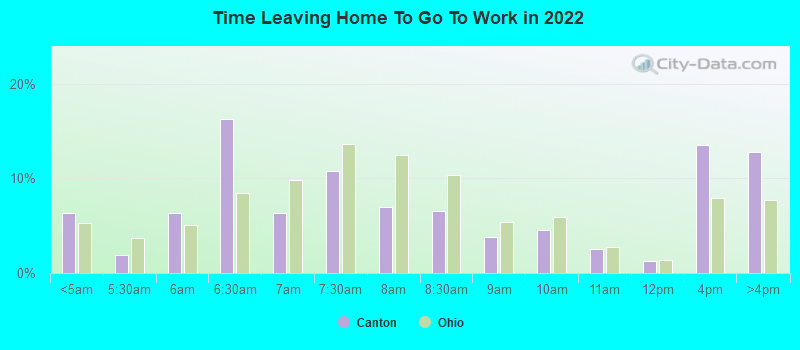
12:00 a.m. to 4:59 a.m.:
| Canton: | 6.4% (1,754) |
| Ohio: | 5.3% (258,840) |
5:00 a.m. to 5:29 a.m.:
| Canton: | 1.9% (519) |
| Ohio: | 3.7% (180,829) |
5:30 a.m. to 5:59 a.m.:
| Canton: | 6.3% (1,731) |
| Ohio: | 5.1% (251,854) |
6:00 a.m. to 6:29 a.m.:
| Canton: | 16.2% (4,461) |
| Ohio: | 8.5% (417,801) |
6:30 a.m. to 6:59 a.m.:
| Canton: | 6.3% (1,738) |
| Ohio: | 9.9% (486,025) |
7:00 a.m. to 7:29 a.m.:
| Canton: | 10.8% (2,953) |
| Ohio: | 13.7% (672,711) |
7:30 a.m. to 7:59 a.m.:
| Canton: | 7.0% (1,922) |
| Ohio: | 12.5% (613,737) |
8:00 a.m. to 8:29 a.m.:
| Canton: | 6.6% (1,814) |
| Ohio: | 10.4% (512,581) |
8:30 a.m. to 8:59 a.m.:
| Canton: | 3.8% (1,049) |
| Ohio: | 5.3% (263,044) |
9:00 a.m. to 9:59 a.m.:
| Canton: | 4.6% (1,255) |
| Ohio: | 5.9% (291,432) |
10:00 a.m. to 10:59 a.m.:
| Canton: | 2.5% (691) |
| Ohio: | 2.8% (135,735) |
11:00 a.m. to 11:59 a.m.:
| Canton: | 1.2% (335) |
| Ohio: | 1.4% (69,215) |
12:00 p.m. to 3:59 p.m.:
| Canton: | 13.5% (3,707) |
| Ohio: | 7.9% (388,951) |
4:00 p.m. to 11:59 p.m.:
| Canton: | 12.8% (3,525) |
| Ohio: | 7.7% (380,332) |

<5am:
| Canton: | 3.1% (1,047) |
| Ohio: | 3.1% (165,876) |
5:30am:
| Canton: | 2.2% (734) |
| Ohio: | 2.6% (138,561) |
6am:
| Canton: | 3.9% (1,302) |
| Ohio: | 4.4% (233,427) |
6:30am:
| Canton: | 7.6% (2,553) |
| Ohio: | 7.9% (418,394) |
7am:
| Canton: | 10.9% (3,669) |
| Ohio: | 10.7% (567,735) |
7:30am:
| Canton: | 11.5% (3,856) |
| Ohio: | 13.7% (729,122) |
8am:
| Canton: | 15.2% (5,131) |
| Ohio: | 15.2% (806,468) |
8:30am:
| Canton: | 9.3% (3,123) |
| Ohio: | 9.8% (518,682) |
9am:
| Canton: | 4.0% (1,330) |
| Ohio: | 5.1% (271,364) |
10am:
| Canton: | 4.8% (1,624) |
| Ohio: | 5.0% (262,742) |
11am:
| Canton: | 2.3% (771) |
| Ohio: | 2.1% (114,110) |
12pm:
| Canton: | 1.6% (529) |
| Ohio: | 1.1% (57,549) |
4pm:
| Canton: | 11.4% (3,827) |
| Ohio: | 8.2% (433,530) |
>4pm:
| Canton: | 10.9% (3,685) |
| Ohio: | 8.4% (443,689) |

12:00 a.m. to 4:59 a.m. - Males:
| Canton: | 4.5% (621) |
| Ohio: | 6.6% (173,940) |
5:00 a.m. to 5:29 a.m. - Males:
| Canton: | 3.8% (519) |
| Ohio: | 4.8% (124,892) |
5:30 a.m. to 5:59 a.m. - Males:
| Canton: | 6.4% (884) |
| Ohio: | 6.4% (166,812) |
6:00 a.m. to 6:29 a.m. - Males:
| Canton: | 18.7% (2,579) |
| Ohio: | 9.6% (251,733) |
6:30 a.m. to 6:59 a.m. - Males:
| Canton: | 7.1% (983) |
| Ohio: | 10.1% (265,336) |
7:00 a.m. to 7:29 a.m. - Males:
| Canton: | 12.1% (1,667) |
| Ohio: | 13.0% (341,660) |
7:30 a.m. to 7:59 a.m. - Males:
| Canton: | 5.9% (810) |
| Ohio: | 11.1% (291,258) |
8:00 a.m. to 8:29 a.m. - Males:
| Canton: | 6.0% (831) |
| Ohio: | 9.5% (249,714) |
8:30 a.m. to 8:59 a.m. - Males:
| Canton: | 2.5% (344) |
| Ohio: | 4.5% (117,235) |
9:00 a.m. to 9:59 a.m. - Males:
| Canton: | 4.2% (583) |
| Ohio: | 5.1% (134,576) |
10:00 a.m. to 10:59 a.m. - Males:
| Canton: | 2.6% (361) |
| Ohio: | 2.3% (61,636) |
11:00 a.m. to 11:59 a.m. - Males:
| Canton: | 1.5% (201) |
| Ohio: | 1.3% (34,272) |
12:00 p.m. to 3:59 p.m. - Males:
| Canton: | 14.2% (1,961) |
| Ohio: | 8.0% (209,869) |
4:00 p.m. to 11:59 p.m. - Males:
| Canton: | 10.7% (1,481) |
| Ohio: | 7.7% (202,249) |

12:00 a.m. to 4:59 a.m. - Females:
| Canton: | 8.3% (1,133) |
| Ohio: | 3.7% (84,900) |
5:30 a.m. to 5:59 a.m. - Females:
| Canton: | 6.2% (847) |
| Ohio: | 3.7% (85,042) |
6:00 a.m. to 6:29 a.m. - Females:
| Canton: | 13.8% (1,882) |
| Ohio: | 7.2% (166,068) |
6:30 a.m. to 6:59 a.m. - Females:
| Canton: | 5.5% (755) |
| Ohio: | 9.6% (220,689) |
7:00 a.m. to 7:29 a.m. - Females:
| Canton: | 9.4% (1,286) |
| Ohio: | 14.4% (331,051) |
7:30 a.m. to 7:59 a.m. - Females:
| Canton: | 8.2% (1,112) |
| Ohio: | 14.0% (322,479) |
8:00 a.m. to 8:29 a.m. - Females:
| Canton: | 7.2% (983) |
| Ohio: | 11.4% (262,867) |
8:30 a.m. to 8:59 a.m. - Females:
| Canton: | 5.2% (705) |
| Ohio: | 6.3% (145,809) |
9:00 a.m. to 9:59 a.m. - Females:
| Canton: | 4.9% (672) |
| Ohio: | 6.8% (156,856) |
10:00 a.m. to 10:59 a.m. - Females:
| Canton: | 2.4% (330) |
| Ohio: | 3.2% (74,099) |
11:00 a.m. to 11:59 a.m. - Females:
| Canton: | 1.0% (134) |
| Ohio: | 1.5% (34,943) |
12:00 p.m. to 3:59 p.m. - Females:
| Canton: | 12.8% (1,746) |
| Ohio: | 7.8% (179,082) |
4:00 p.m. to 11:59 p.m. - Females:
| Canton: | 15.0% (2,044) |
| Ohio: | 7.7% (178,083) |
Travel time to work
Percentage of workers working in this county: 86.6%
Number of people working at home: 1,713 (5.9% of all workers)
Daytime population change due to commuting: +15,655 (+19.4%)
Workers who live and work in this city: 14,254 (42.3%)
Number of people working at home: 1,713 (5.9% of all workers)
Daytime population change due to commuting: +15,655 (+19.4%)
Workers who live and work in this city: 14,254 (42.3%)

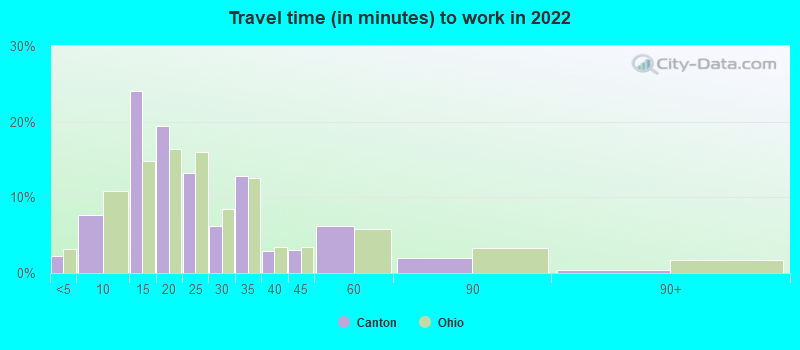

Less than 5 minutes:
| Canton: | 2.3% (870) |
| Ohio: | 3.2% (157,818) |
5 to 9 minutes:
| Canton: | 7.6% (2,913) |
| Ohio: | 10.8% (535,351) |
10 to 14 minutes:
| Canton: | 24.0% (9,205) |
| Ohio: | 14.8% (729,147) |
15 to 19 minutes:
| Canton: | 19.5% (7,458) |
| Ohio: | 16.4% (809,217) |
20 to 24 minutes:
| Canton: | 13.2% (5,045) |
| Ohio: | 16.0% (789,250) |
25 to 29 minutes:
| Canton: | 6.2% (2,370) |
| Ohio: | 8.5% (419,749) |
30 to 34 minutes:
| Canton: | 12.8% (4,897) |
| Ohio: | 12.5% (618,678) |
35 to 39 minutes:
| Canton: | 2.9% (1,109) |
| Ohio: | 3.5% (172,226) |
40 to 44 minutes:
| Canton: | 3.1% (1,180) |
| Ohio: | 3.4% (168,310) |
45 to 59 minutes:
| Canton: | 6.2% (2,365) |
| Ohio: | 5.8% (284,736) |
60 to 89 minutes:
| Canton: | 2.0% (751) |
| Ohio: | 3.3% (165,199) |
90 or more minutes:
| Canton: | 0.5% (174) |
| Ohio: | 1.8% (86,931) |


Less than 5 minutes:
| Canton: | 3.7% (1,260) |
| Ohio: | 3.5% (187,324) |
5 to 9 minutes:
| Canton: | 14.5% (4,889) |
| Ohio: | 11.5% (611,242) |
10 to 14 minutes:
| Canton: | 24.9% (8,386) |
| Ohio: | 15.4% (816,266) |
15 to 19 minutes:
| Canton: | 20.2% (6,800) |
| Ohio: | 16.3% (867,583) |
20 to 24 minutes:
| Canton: | 14.4% (4,850) |
| Ohio: | 16.0% (851,177) |
25 to 29 minutes:
| Canton: | 4.1% (1,389) |
| Ohio: | 7.0% (370,059) |
30 to 34 minutes:
| Canton: | 6.8% (2,301) |
| Ohio: | 11.9% (630,615) |
35 to 39 minutes:
| Canton: | 1.3% (432) |
| Ohio: | 2.6% (137,481) |
40 to 44 minutes:
| Canton: | 1.5% (510) |
| Ohio: | 2.8% (150,288) |
45 to 59 minutes:
| Canton: | 3.2% (1,068) |
| Ohio: | 5.4% (286,488) |
60 to 89 minutes:
| Canton: | 2.6% (860) |
| Ohio: | 2.9% (155,240) |
90 or more minutes:
| Canton: | 1.3% (436) |
| Ohio: | 1.8% (97,486) |

Less than 5 minutes - Males:
| Canton: | 2.2% (470) |
| Ohio: | 3.1% (82,204) |
5 to 9 minutes - Males:
| Canton: | 6.8% (1,431) |
| Ohio: | 9.7% (254,581) |
10 to 14 minutes - Males:
| Canton: | 26.0% (5,491) |
| Ohio: | 13.6% (357,799) |
15 to 19 minutes - Males:
| Canton: | 19.4% (4,106) |
| Ohio: | 15.5% (409,120) |
20 to 24 minutes - Males:
| Canton: | 14.2% (3,005) |
| Ohio: | 15.9% (418,553) |
25 to 29 minutes - Males:
| Canton: | 5.4% (1,137) |
| Ohio: | 8.5% (225,266) |
30 to 34 minutes - Males:
| Canton: | 10.3% (2,171) |
| Ohio: | 13.3% (349,788) |
35 to 39 minutes - Males:
| Canton: | 2.3% (487) |
| Ohio: | 3.8% (100,272) |
40 to 44 minutes - Males:
| Canton: | 3.6% (759) |
| Ohio: | 3.8% (100,495) |
45 to 59 minutes - Males:
| Canton: | 7.2% (1,512) |
| Ohio: | 6.5% (172,183) |
60 to 89 minutes - Males:
| Canton: | 2.1% (446) |
| Ohio: | 4.1% (107,683) |
90 or more minutes - Males:
| Canton: | 0.5% (108) |
| Ohio: | 2.2% (59,260) |

Less than 5 minutes - Females:
| Canton: | 2.3% (400) |
| Ohio: | 3.3% (75,614) |
5 to 9 minutes - Females:
| Canton: | 8.6% (1,482) |
| Ohio: | 12.2% (280,770) |
10 to 14 minutes - Females:
| Canton: | 21.6% (3,714) |
| Ohio: | 16.1% (371,348) |
15 to 19 minutes - Females:
| Canton: | 19.5% (3,352) |
| Ohio: | 17.4% (400,097) |
20 to 24 minutes - Females:
| Canton: | 11.9% (2,040) |
| Ohio: | 16.1% (370,697) |
25 to 29 minutes - Females:
| Canton: | 7.2% (1,233) |
| Ohio: | 8.5% (194,483) |
30 to 34 minutes - Females:
| Canton: | 15.8% (2,726) |
| Ohio: | 11.7% (268,890) |
35 to 39 minutes - Females:
| Canton: | 3.6% (622) |
| Ohio: | 3.1% (71,954) |
40 to 44 minutes - Females:
| Canton: | 2.4% (421) |
| Ohio: | 2.9% (67,815) |
45 to 59 minutes - Females:
| Canton: | 5.0% (853) |
| Ohio: | 4.9% (112,553) |
60 to 89 minutes - Females:
| Canton: | 1.8% (305) |
| Ohio: | 2.5% (57,516) |
90 or more minutes - Females:
| Canton: | 0.4% (66) |
| Ohio: | 1.2% (27,671) |
Means of transportation to work
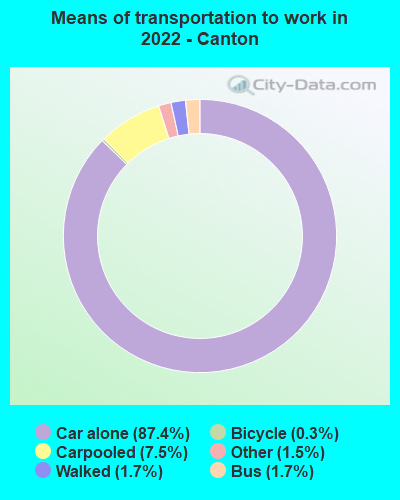

Drove car alone:
| Canton: | 87.4% (33,336) |
| Ohio: | 86.0% (1,967,976) |
Carpooled:
| Canton: | 7.5% (2,842) |
| Ohio: | 9.0% (218,683) |
Bus:
| Canton: | 1.7% (637) |
| Ohio: | 1.1% (25,725) |
Bicycle:
| Canton: | 0.3% (95) |
| Ohio: | 0.3% (5,284) |
Walked:
| Canton: | 1.7% (654) |
| Ohio: | 2.2% (52,105) |
Other means:
| Canton: | 1.5% (558) |
| Ohio: | 1.4% (28,711) |

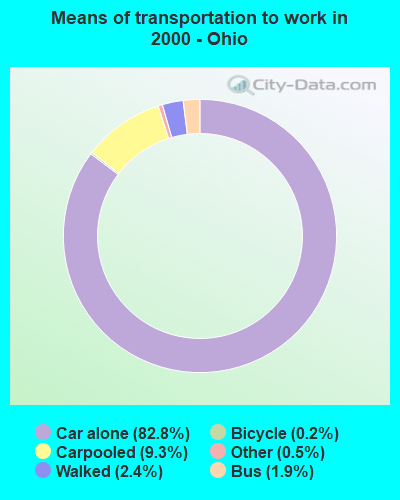
Drove car alone:
| Canton: | 80.1% (26,950) |
| Ohio: | 82.8% (4,392,059) |
Carpooled:
| Canton: | 11.8% (3,959) |
| Ohio: | 9.3% (494,602) |
Bus or trolley bus:
| Canton: | 2.6% (863) |
| Ohio: | 1.9% (99,481) |
Subway or elevated:
| Canton: | 0.0% (7) |
| Ohio: | 0.1% (3,351) |
Railroad:
| Canton: | 0.0% (8) |
| Ohio: | 0.0% (870) |
Taxicab:
| Canton: | 0.1% (25) |
| Ohio: | 0.1% (4,815) |
Motorcycle:
| Canton: | 0.0% (10) |
| Ohio: | 0.0% (2,369) |
Bicycle:
| Canton: | 0.2% (82) |
| Ohio: | 0.2% (9,535) |
Walked:
| Canton: | 3.2% (1,077) |
| Ohio: | 2.4% (125,882) |
Other means:
| Canton: | 0.6% (200) |
| Ohio: | 0.5% (26,528) |


Drove car alone - Males:
| Canton: | 87.4% (16,548) |
| Ohio: | 86.3% (1,967,976) |
Carpooled - Males:
| Canton: | 6.9% (1,310) |
| Ohio: | 8.5% (218,683) |
Bus - Males:
| Canton: | 2.0% (387) |
| Ohio: | 1.1% (25,725) |
Bicycle - Males:
| Canton: | 0.3% (64) |
| Ohio: | 0.4% (5,284) |
Walked - Males:
| Canton: | 2.4% (453) |
| Ohio: | 2.2% (52,105) |
Other means - Males:
| Canton: | 0.9% (168) |
| Ohio: | 1.4% (28,711) |

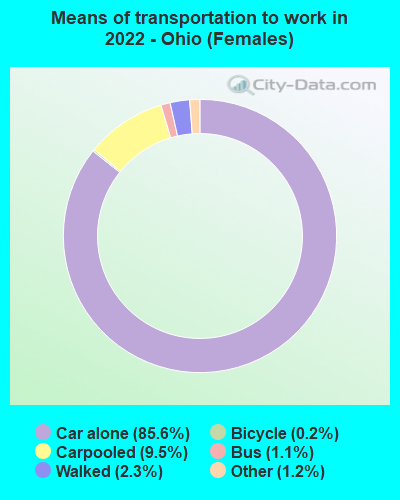
Drove car alone - Females:
| Canton: | 87.5% (16,792) |
| Ohio: | 85.6% (1,967,976) |
Carpooled - Females:
| Canton: | 8.0% (1,538) |
| Ohio: | 9.5% (218,683) |
Bus - Females:
| Canton: | 1.3% (247) |
| Ohio: | 1.1% (25,725) |
Bicycle - Females:
| Canton: | 0.2% (30) |
| Ohio: | 0.2% (5,284) |
Walked - Females:
| Canton: | 1.0% (195) |
| Ohio: | 2.3% (52,105) |
Other means - Females:
| Canton: | 2.1% (395) |
| Ohio: | 1.2% (28,711) |
Private vehicle occupancy

Drove alone:
| Canton: | 90.0% (22,075) |
| Ohio: | 90.6% (4,234,485) |
In 2 person carpool:
| Canton: | 8.2% (2,012) |
| Ohio: | 7.2% (337,005) |
In 3 person carpool:
| Canton: | 1.2% (290) |
| Ohio: | 1.2% (57,538) |
In 4 person carpool:
| Canton: | 0.5% (116) |
| Ohio: | 0.6% (26,474) |
In 5-6 person carpool:
| Canton: | 0.1% (20) |
| Ohio: | 0.3% (13,901) |
In 7+ person carpool:
| Canton: | 0.1% (24) |
| Ohio: | 0.1% (4,936) |

Drove alone:
| Canton: | 87.2% (26,950) |
| Ohio: | 89.9% (4,392,059) |
In 2 person carpool:
| Canton: | 10.4% (3,200) |
| Ohio: | 8.4% (410,255) |
In 3 person carpool:
| Canton: | 1.5% (455) |
| Ohio: | 1.1% (54,916) |
In 4 person carpool:
| Canton: | 0.5% (164) |
| Ohio: | 0.4% (17,290) |
In 5-6 person carpool:
| Canton: | 0.2% (74) |
| Ohio: | 0.2% (7,498) |
In 7+ person carpool:
| Canton: | 0.2% (66) |
| Ohio: | 0.1% (4,643) |
Class of workers
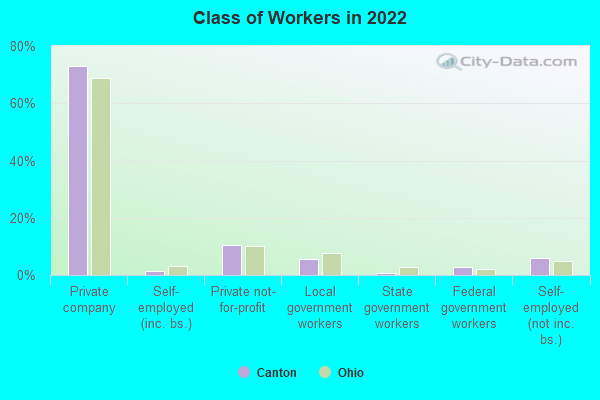
Employee of private company:
| Canton: | 72.9% (22,868) |
| Ohio: | 68.7% (3,956,340) |
Self-employed in own incorporated business:
| Canton: | 1.5% (479) |
| Ohio: | 3.1% (178,089) |
Private not-for-profit wage and salary workers:
| Canton: | 10.3% (3,240) |
| Ohio: | 10.3% (592,258) |
Local government workers:
| Canton: | 5.6% (1,772) |
| Ohio: | 7.8% (451,488) |
State government workers:
| Canton: | 0.9% (271) |
| Ohio: | 2.9% (168,641) |
Federal government workers:
| Canton: | 3.0% (928) |
| Ohio: | 2.1% (118,956) |
Self-employed workers in own not incorporated business:
| Canton: | 5.8% (1,810) |
| Ohio: | 5.0% (288,846) |

Employee of private company:
| Canton: | 75.4% (25,985) |
| Ohio: | 71.7% (3,871,510) |
Self-employed in own incorporated business:
| Canton: | 1.4% (480) |
| Ohio: | 2.5% (137,721) |
Private not-for-profit wage and salary workers:
| Canton: | 8.9% (3,065) |
| Ohio: | 7.8% (422,430) |
Local government workers:
| Canton: | 7.5% (2,601) |
| Ohio: | 7.1% (382,502) |
State government workers:
| Canton: | 1.4% (493) |
| Ohio: | 3.3% (176,542) |
Federal government workers:
| Canton: | 1.4% (474) |
| Ohio: | 1.9% (102,527) |
Self-employed workers in own not incorporated business:
| Canton: | 3.8% (1,326) |
| Ohio: | 5.5% (295,088) |
Unpaid family workers:
| Canton: | 0.1% (51) |
| Ohio: | 0.3% (13,855) |

Employee of private company - Males:
| Canton: | 75.8% (11,761) |
| Ohio: | 72.8% (2,192,687) |
Self-employed in own incorporated business - Males:
| Canton: | 1.5% (226) |
| Ohio: | 3.9% (118,807) |
Private not-for-profit wage and salary workers - Males:
| Canton: | 6.2% (967) |
| Ohio: | 6.6% (198,057) |
Local government workers - Males:
| Canton: | 3.8% (590) |
| Ohio: | 6.0% (180,747) |
State government workers - Males:
| Canton: | 0.3% (39) |
| Ohio: | 2.5% (74,268) |
Federal government workers - Males:
| Canton: | 3.0% (469) |
| Ohio: | 2.2% (66,143) |
Self-employed workers in own not incorporated business - Males:
| Canton: | 9.5% (1,474) |
| Ohio: | 5.8% (175,472) |

Employee of private company - Females:
| Canton: | 70.1% (11,107) |
| Ohio: | 64.1% (1,763,653) |
Self-employed in own incorporated business - Females:
| Canton: | 1.6% (253) |
| Ohio: | 2.2% (59,282) |
Private not-for-profit wage and salary workers - Females:
| Canton: | 14.3% (2,273) |
| Ohio: | 14.3% (394,201) |
Local government workers - Females:
| Canton: | 7.5% (1,182) |
| Ohio: | 9.8% (270,741) |
State government workers - Females:
| Canton: | 1.5% (232) |
| Ohio: | 3.4% (94,373) |
Federal government workers - Females:
| Canton: | 2.9% (459) |
| Ohio: | 1.9% (52,813) |
Self-employed workers in own not incorporated business - Females:
| Canton: | 2.1% (336) |
| Ohio: | 4.1% (113,374) |