Work and Jobs in Boston, Kentucky (KY) Detailed Stats
Occupations, Industries, Unemployment, Workers, Commute
Settings
X


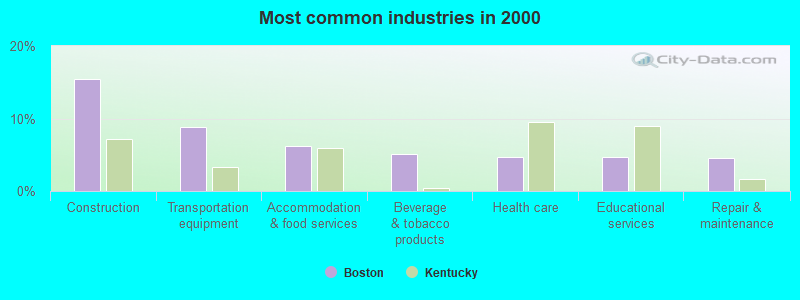
The most common industries in Boston are: Construction (15.5% of civilian employees), Transportation equipment (8.8% of civilian employees), Accommodation & food services (6.2% of civilian employees). 72.9% of workers are employees of private companies, which is 5.8% greater than the rate of 68.7% across the entire state of Kentucky.
Most common industries
Most common industries | |||
|---|---|---|---|
Industry | All | Males | Females |
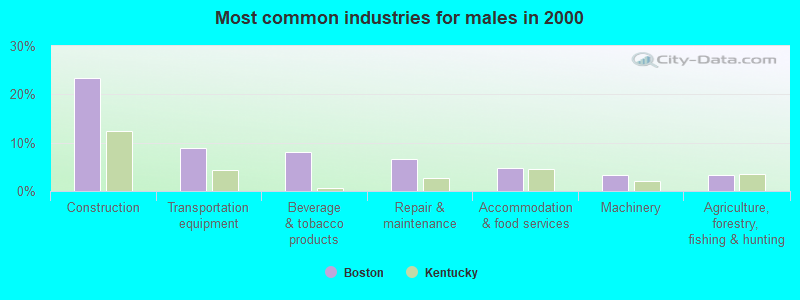
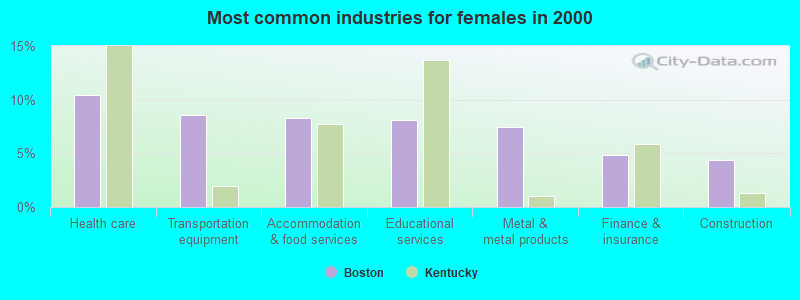
| Construction | 15.5% (221) | 23.4% (195) | 4.4% (26) |
| Transportation equipment | 8.8% (126) | 9.0% (75) | 8.6% (51) |
| Accommodation and food services | 6.2% (88) | 4.7% (39) | 8.3% (49) |
| Beverage and tobacco products | 5.1% (73) | 8.2% (68) | 0.8% (5) |
| Health care | 4.6% (66) | 0.5% (4) | 10.5% (62) |
| Educational services | 4.6% (66) | 2.2% (18) | 8.1% (48) |
| Repair and maintenance | 4.5% (64) | 6.7% (56) | 1.3% (8) |
| Publishing, and motion picture and sound recording industries | 3.4% (49) | 3.2% (27) | 3.7% (22) |
| Metal and metal products | 3.1% (44) | 0.0% (0) | 7.4% (44) |
| Other transportation, and support activities, and couriers | 3.0% (43) | 2.0% (17) | 4.4% (26) |
| Arts, entertainment, and recreation | 2.2% (32) | 2.2% (18) | 2.4% (14) |
| U. S. Postal service | 2.2% (31) | 1.4% (12) | 3.2% (19) |
| Printing and related support activities | 2.1% (30) | 1.9% (16) | 2.4% (14) |
| Plastics and rubber products | 2.1% (30) | 2.3% (19) | 1.9% (11) |
| Public administration | 2.1% (30) | 1.9% (16) | 2.4% (14) |
| Professional, scientific, and technical services | 2.0% (29) | 1.6% (13) | 2.7% (16) |
| Finance and insurance | 2.0% (29) | 0.0% (0) | 4.9% (29) |
| Machinery | 2.0% (28) | 3.4% (28) | 0.0% (0) |
| Agriculture, forestry, fishing and hunting | 1.9% (27) | 3.2% (27) | 0.0% (0) |
| Department and other general merchandise stores | 1.7% (24) | 0.7% (6) | 3.0% (18) |
| Gasoline stations | 1.5% (21) | 0.0% (0) | 3.5% (21) |
| Wood products | 1.4% (20) | 2.4% (20) | 0.0% (0) |
| Religious, grantmaking, civic, professional, and similar organizations | 1.4% (20) | 0.8% (7) | 2.2% (13) |
| Motor vehicle and parts dealers | 1.3% (19) | 1.3% (11) | 1.3% (8) |
| Groceries and related products merchant wholesalers | 1.3% (19) | 1.7% (14) | 0.8% (5) |
| Personal and laundry services | 1.3% (18) | 1.4% (12) | 1.0% (6) |
| Electrical equipment, appliances, and components | 1.1% (15) | 1.3% (11) | 0.7% (4) |
| Used merchandise, gift, novelty, and souvenir, and other miscellaneous stores | 1.0% (14) | 0.0% (0) | 2.4% (14) |
| Social assistance | 1.0% (14) | 0.0% (0) | 2.4% (14) |
| Pharmacies and drug stores | 1.0% (14) | 1.7% (14) | 0.0% (0) |
| Furniture and related product manufacturing | 0.9% (13) | 1.6% (13) | 0.0% (0) |
| Food and beverage stores | 0.8% (11) | 1.3% (11) | 0.0% (0) |
| Computer and electronic products | 0.7% (10) | 1.2% (10) | 0.0% (0) |
| Textile mills and textile products | 0.6% (8) | 0.0% (0) | 1.3% (8) |
| Machinery, equipment, and supplies merchant wholesalers | 0.6% (8) | 1.0% (8) | 0.0% (0) |
| Real estate and rental and leasing | 0.6% (8) | 1.0% (8) | 0.0% (0) |
| Sporting goods, camera, and hobby and toy stores | 0.5% (7) | 0.0% (0) | 1.2% (7) |
| Chemicals | 0.4% (6) | 0.7% (6) | 0.0% (0) |
| Truck transportation | 0.4% (6) | 0.7% (6) | 0.0% (0) |
| Broadcasting and telecommunications | 0.4% (6) | 0.0% (0) | 1.0% (6) |
| Paper | 0.4% (6) | 0.7% (6) | 0.0% (0) |
| Apparel | 0.4% (6) | 0.0% (0) | 1.0% (6) |
| Farm product raw materials merchant wholesalers | 0.4% (6) | 0.7% (6) | 0.0% (0) |
| Fuel dealers | 0.4% (6) | 0.7% (6) | 0.0% (0) |
| Utilities | 0.4% (5) | 0.6% (5) | 0.0% (0) |
| Administrative and support and waste management services | 0.4% (5) | 0.6% (5) | 0.0% (0) |
| Air transportation | 0.4% (5) | 0.0% (0) | 0.8% (5) |
Unemployment in Boston
- Unemployment by race in 2000
- Unemployment rate for White non-Hispanic residents
- 4.5%Males
- 2.5%Females
Time leaving home to go to work

<5am:
| Boston: | 1.5% (21) |
| Kentucky: | 3.7% (65,918) |
5:30am:
| Boston: | 5.2% (73) |
| Kentucky: | 3.1% (55,792) |
6am:
| Boston: | 5.8% (81) |
| Kentucky: | 4.7% (84,161) |
6:30am:
| Boston: | 15.5% (215) |
| Kentucky: | 8.8% (156,072) |
7am:
| Boston: | 11.5% (160) |
| Kentucky: | 10.8% (191,924) |
7:30am:
| Boston: | 13.2% (183) |
| Kentucky: | 14.4% (256,256) |
8am:
| Boston: | 10.9% (152) |
| Kentucky: | 15.6% (277,275) |
8:30am:
| Boston: | 2.8% (39) |
| Kentucky: | 8.8% (156,855) |
9am:
| Boston: | 3.0% (42) |
| Kentucky: | 4.2% (75,532) |
10am:
| Boston: | 2.9% (40) |
| Kentucky: | 4.4% (77,954) |
11am:
| Boston: | 1.7% (24) |
| Kentucky: | 1.9% (33,406) |
12pm:
| Boston: | 0.6% (8) |
| Kentucky: | 1.0% (17,303) |
4pm:
| Boston: | 7.9% (110) |
| Kentucky: | 7.6% (135,045) |
>4pm:
| Boston: | 13.1% (182) |
| Kentucky: | 8.4% (150,096) |
Travel time to work


Less than 5 minutes:
| Boston: | 0.5% (7) |
| Kentucky: | 3.8% (67,210) |
5 to 9 minutes:
| Boston: | 4.4% (61) |
| Kentucky: | 11.8% (210,440) |
10 to 14 minutes:
| Boston: | 6.8% (94) |
| Kentucky: | 16.3% (290,128) |
15 to 19 minutes:
| Boston: | 12.7% (176) |
| Kentucky: | 16.9% (301,009) |
20 to 24 minutes:
| Boston: | 16.8% (233) |
| Kentucky: | 14.7% (262,418) |
25 to 29 minutes:
| Boston: | 11.3% (157) |
| Kentucky: | 5.7% (101,130) |
30 to 34 minutes:
| Boston: | 11.6% (161) |
| Kentucky: | 11.7% (208,362) |
35 to 39 minutes:
| Boston: | 2.4% (34) |
| Kentucky: | 2.3% (40,576) |
40 to 44 minutes:
| Boston: | 6.8% (94) |
| Kentucky: | 2.5% (44,172) |
45 to 59 minutes:
| Boston: | 13.0% (181) |
| Kentucky: | 5.8% (102,842) |
60 to 89 minutes:
| Boston: | 7.7% (107) |
| Kentucky: | 3.5% (61,841) |
90 or more minutes:
| Boston: | 1.8% (25) |
| Kentucky: | 2.4% (43,461) |
Means of transportation to work

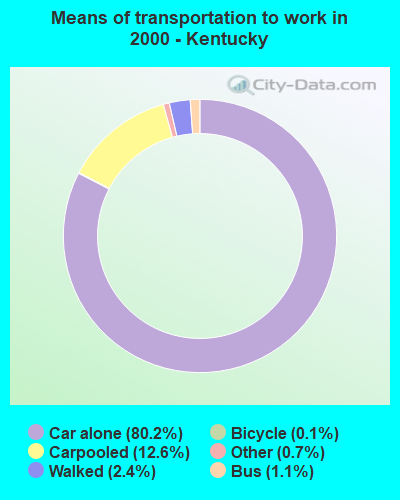
Drove car alone:
| Boston: | 82.7% (1,150) |
| Kentucky: | 80.2% (1,429,053) |
Carpooled:
| Boston: | 11.9% (166) |
| Kentucky: | 12.6% (224,643) |
Walked:
| Boston: | 1.0% (14) |
| Kentucky: | 2.4% (42,494) |
Private vehicle occupancy

Drove alone:
| Boston: | 87.4% (1,150) |
| Kentucky: | 86.4% (1,429,053) |
In 2 person carpool:
| Boston: | 9.8% (129) |
| Kentucky: | 10.8% (178,387) |
In 3 person carpool:
| Boston: | 2.8% (37) |
| Kentucky: | 1.8% (30,156) |
Class of workers

Employee of private company:
| Boston: | 72.9% (1,040) |
| Kentucky: | 68.7% (1,235,989) |
Self-employed in own incorporated business:
| Boston: | 1.3% (18) |
| Kentucky: | 3.0% (53,084) |
Private not-for-profit wage and salary workers:
| Boston: | 3.4% (48) |
| Kentucky: | 6.8% (121,764) |
Local government workers:
| Boston: | 2.2% (31) |
| Kentucky: | 5.6% (100,920) |
State government workers:
| Boston: | 4.8% (68) |
| Kentucky: | 6.4% (114,791) |
Federal government workers:
| Boston: | 3.0% (43) |
| Kentucky: | 2.5% (44,072) |
Self-employed workers in own not incorporated business:
| Boston: | 12.5% (178) |
| Kentucky: | 6.7% (120,288) |

Employee of private company - Males:
| Boston: | 77.2% (643) |
| Kentucky: | 72.0% (690,861) |
Self-employed in own incorporated business - Males:
| Boston: | 0.8% (7) |
| Kentucky: | 4.1% (39,506) |
Private not-for-profit wage and salary workers - Males:
| Boston: | 0.8% (7) |
| Kentucky: | 4.0% (37,911) |
State government workers - Males:
| Boston: | 4.6% (38) |
| Kentucky: | 4.5% (43,483) |
Federal government workers - Males:
| Boston: | 2.0% (17) |
| Kentucky: | 2.2% (21,587) |
Self-employed workers in own not incorporated business - Males:
| Boston: | 14.5% (121) |
| Kentucky: | 8.6% (82,249) |

Employee of private company - Females:
| Boston: | 66.9% (397) |
| Kentucky: | 65.0% (545,128) |
Self-employed in own incorporated business - Females:
| Boston: | 1.9% (11) |
| Kentucky: | 1.6% (13,578) |
Private not-for-profit wage and salary workers - Females:
| Boston: | 6.9% (41) |
| Kentucky: | 10.0% (83,853) |
Local government workers - Females:
| Boston: | 5.2% (31) |
| Kentucky: | 7.3% (60,952) |
State government workers - Females:
| Boston: | 5.1% (30) |
| Kentucky: | 8.5% (71,308) |
Federal government workers - Females:
| Boston: | 4.4% (26) |
| Kentucky: | 2.7% (22,485) |
Self-employed workers in own not incorporated business - Females:
| Boston: | 9.6% (57) |
| Kentucky: | 4.5% (38,039) |