Work and Jobs in Appleton, Wisconsin (WI) Detailed Stats
Occupations, Industries, Unemployment, Workers, Commute
Settings
X


Recent posts about work in Appleton, Wisconsin on our local forum with over 2,400,000 registered users:
 | Jobs in Appleton, Wisconsin (3 replies) |
| How does school system work in Appleton, WI? (2 replies) |
| State of the State - Appleton Area? (7 replies) |
| Peeed in appleton (6 replies) |
| Considering relocating to Appleton for work (14 replies) |
| CNA Job availability in Appleton ( or surrounding ) (2 replies) |
Latest news about work in Appleton, WI collected exclusively by city-data.com from local newspapers, TV, and radio stations
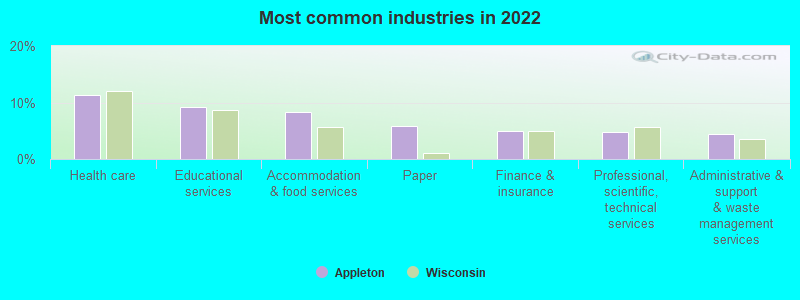
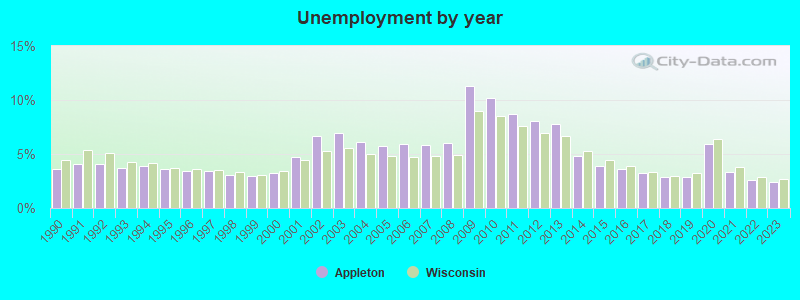
The unemployment rate in 2023 in Appleton, WI was 2.4%, which was 12.5% less than the unemployment rate of 2.7% across the entire state of Wisconsin. Compared to the unemployment rate of 7.8% in 2013, this represents a decrease of 225.0%. According to 2022 data, the most common industries in Appleton are: Health care (11.3% of civilian employees), Educational services (9.3% of civilian employees), Accommodation & food services (8.4% of civilian employees). 65.9% of workers work in Outagamie County and 14.8% of all workers work at home. 72.4% of workers are employees of private companies, which is 5.5% greater than the rate of 68.4% across the entire state of Wisconsin.
Whole page based on the data from 2000 / 2022 when the population of Appleton, Wisconsin was 70,087 / 75,018
Whole page based on the data from 2000 / 2022 when the population of Appleton, Wisconsin was 70,087 / 75,018
Most common industries


Most common industries | Most common industries | |||||
|---|---|---|---|---|---|---|
Industry | All | Males | Females | All | Males | Females |
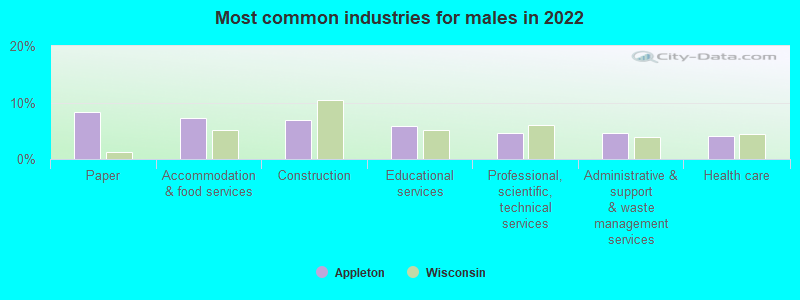
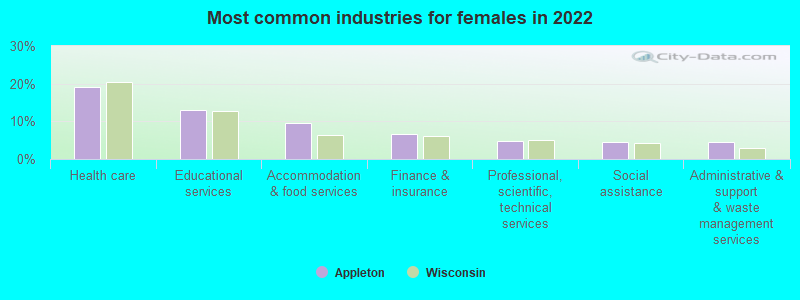
| Health care | 11.3% (4,559) | 4.1% (855) | 19.1% (3,704) | 8.7% (3,237) | 3.2% (619) | 14.9% (2,618) |
| Educational services | 9.3% (3,740) | 5.8% (1,223) | 13.0% (2,517) | 8.8% (3,244) | 5.9% (1,137) | 12.0% (2,107) |
| Accommodation and food services | 8.4% (3,382) | 7.2% (1,506) | 9.7% (1,876) | 5.9% (2,182) | 5.3% (1,030) | 6.6% (1,152) |
| Paper | 5.9% (2,368) | 8.2% (1,729) | 3.3% (639) | 9.5% (3,501) | 13.0% (2,532) | 5.5% (969) |
| Finance and insurance | 5.0% (2,021) | 3.4% (715) | 6.7% (1,306) | 7.3% (2,716) | 3.8% (742) | 11.2% (1,974) |
| Professional, scientific, and technical services | 4.7% (1,910) | 4.6% (970) | 4.8% (940) | 4.1% (1,530) | 4.7% (907) | 3.5% (623) |
| Administrative and support and waste management services | 4.5% (1,802) | 4.5% (951) | 4.4% (851) | 3.0% (1,094) | 2.3% (455) | 3.6% (639) |
| Construction | 3.9% (1,594) | 7.0% (1,463) | 0.7% (131) | 5.1% (1,887) | 8.5% (1,649) | 1.4% (238) |
| Food | 2.7% (1,079) | 3.4% (723) | 1.8% (356) | 2.1% (776) | 1.9% (378) | 2.3% (398) |
| Department and other general merchandise stores | 2.5% (1,015) | 2.1% (436) | 3.0% (579) | 1.6% (597) | 1.0% (202) | 2.2% (395) |
| Social assistance | 2.3% (948) | 0.3% (64) | 4.6% (884) | 1.8% (679) | 0.7% (143) | 3.0% (536) |
| Public administration | 2.3% (922) | 2.0% (427) | 2.6% (495) | 1.9% (713) | 2.0% (383) | 1.9% (330) |
| Metal and metal products | 1.8% (744) | 3.2% (672) | 0.4% (72) | 1.3% (492) | 2.3% (453) | 0.2% (39) |
| Food and beverage stores | 1.7% (695) | 1.5% (305) | 2.0% (390) | 2.2% (826) | 1.8% (348) | 2.7% (478) |
| Printing and related support activities | 1.7% (674) | 2.2% (469) | 1.1% (205) | 2.0% (738) | 2.5% (491) | 1.4% (247) |
| Religious, grantmaking, civic, professional, and similar organizations | 1.7% (667) | 1.7% (357) | 1.6% (310) | 1.6% (604) | 1.6% (305) | 1.7% (299) |
| Machinery | 1.6% (659) | 2.6% (536) | 0.6% (123) | 2.7% (1,001) | 4.0% (768) | 1.3% (233) |
| Real estate and rental and leasing | 1.6% (656) | 1.8% (388) | 1.4% (268) | 0.9% (324) | 0.7% (127) | 1.1% (197) |
| Truck transportation | 1.6% (644) | 2.7% (561) | 0.4% (83) | 1.1% (406) | 1.8% (350) | 0.3% (56) |
| Transportation equipment | 1.3% (537) | 2.3% (477) | 0.3% (60) | 1.1% (417) | 1.9% (368) | 0.3% (49) |
| Computer and electronic products | 1.3% (532) | 1.6% (329) | 1.0% (203) | 1.4% (500) | 1.4% (278) | 1.3% (222) |
| Publishing, and motion picture and sound recording industries | 1.2% (504) | 1.0% (219) | 1.5% (285) | 1.3% (465) | 1.3% (244) | 1.3% (221) |
| Miscellaneous manufacturing | 1.2% (503) | 1.8% (382) | 0.6% (121) | 1.2% (461) | 1.6% (320) | 0.8% (141) |
| Arts, entertainment, and recreation | 1.2% (480) | 0.9% (186) | 1.5% (294) | 1.6% (610) | 1.2% (224) | 2.2% (386) |
| Other transportation, and support activities, and couriers | 1.0% (424) | 1.7% (359) | 0.3% (65) | 1.0% (370) | 1.4% (278) | 0.5% (92) |
| Personal and laundry services | 1.0% (412) | 0.8% (159) | 1.3% (253) | 1.2% (434) | 0.5% (95) | 1.9% (339) |
| Motor vehicle and parts dealers | 1.0% (391) | 1.6% (332) | 0.3% (59) | 1.2% (453) | 2.0% (393) | 0.3% (60) |
| Repair and maintenance | 0.9% (381) | 1.7% (349) | 0.2% (32) | 1.6% (590) | 2.7% (525) | 0.4% (65) |
| Building material and garden equipment and supplies dealers | 0.9% (373) | 1.1% (240) | 0.7% (133) | 1.0% (376) | 1.4% (277) | 0.6% (99) |
| Used merchandise, gift, novelty, and souvenir, and other miscellaneous stores | 0.8% (326) | 0.7% (152) | 0.9% (174) | 0.8% (304) | 0.6% (123) | 1.0% (181) |
| Plastics and rubber products | 0.7% (301) | 1.0% (200) | 0.5% (101) | 1.2% (443) | 1.7% (324) | 0.7% (119) |
| Broadcasting and telecommunications | 0.6% (254) | 1.1% (239) | 0.1% (15) | 1.3% (467) | 1.3% (256) | 1.2% (211) |
| Utilities | 0.6% (252) | 1.1% (231) | 0.1% (21) | 0.3% (113) | 0.5% (104) | 0.1% (9) |
| Sporting goods, camera, and hobby and toy stores | 0.6% (230) | 0.2% (46) | 0.9% (184) | 0.4% (135) | 0.5% (105) | 0.2% (30) |
| Groceries and related products merchant wholesalers | 0.6% (223) | 0.9% (196) | 0.1% (27) | 0.4% (153) | 0.5% (90) | 0.4% (63) |
| Chemicals | 0.5% (218) | 0.7% (146) | 0.4% (72) | 0.4% (138) | 0.6% (124) | 0.1% (14) |
| Data processing, libraries, and other information services | 0.5% (218) | 0.1% (22) | 1.0% (196) | 0.4% (136) | 0.3% (53) | 0.5% (83) |
| Pharmacies and drug stores | 0.5% (213) | 0.5% (108) | 0.5% (105) | 0.5% (187) | 0.3% (61) | 0.7% (126) |
| Paper and paper products merchant wholesalers | 0.5% (206) | 0.9% (190) | 0.1% (16) | 0.3% (121) | 0.3% (59) | 0.4% (62) |
| Clothing and accessories, including shoe, stores | 0.5% (204) | 0.1% (30) | 0.9% (174) | 0.6% (235) | 0.2% (44) | 1.1% (191) |
| Radio, TV, and computer stores | 0.5% (198) | 0.8% (164) | 0.2% (34) | 0.7% (271) | 1.1% (220) | 0.3% (51) |
| Gasoline stations | 0.4% (180) | 0.7% (153) | 0.1% (27) | 0.2% (79) | 0.2% (33) | 0.3% (46) |
| Furniture and home furnishings, and household appliance stores | 0.4% (168) | 0.4% (76) | 0.5% (92) | 0.5% (199) | 0.7% (143) | 0.3% (56) |
| Textile mills and textile products | 0.4% (162) | 0.6% (116) | 0.2% (46) | 0.4% (151) | 0.5% (94) | 0.3% (57) |
| Agriculture, forestry, fishing and hunting | 0.4% (151) | 0.6% (129) | 0.1% (22) | 0.2% (58) | 0.2% (35) | 0.1% (23) |
| Electrical equipment, appliances, and components | 0.4% (148) | 0.3% (70) | 0.4% (78) | 0.3% (106) | 0.3% (58) | 0.3% (48) |
| Wood products | 0.4% (142) | 0.6% (117) | 0.1% (25) | 0.3% (123) | 0.4% (84) | 0.2% (39) |
| Metals and minerals, except petroleum, merchant wholesalers | 0.3% (132) | 0.3% (70) | 0.3% (62) | 0.1% (28) | 0.1% (18) | 0.1% (10) |
| Machinery, equipment, and supplies merchant wholesalers | 0.3% (122) | 0.4% (87) | 0.2% (35) | 0.7% (242) | 1.0% (201) | 0.2% (41) |
| Health and personal care, except drug, stores | 0.2% (96) | 0.1% (23) | 0.4% (73) | 0.1% (32) | 0.0% (3) | 0.2% (29) |
| Professional and commercial equipment and supplies merchant wholesalers | 0.2% (88) | 0.2% (43) | 0.2% (45) | 0.1% (52) | 0.1% (23) | 0.2% (29) |
| Office supplies and stationery stores | 0.2% (87) | 0.3% (73) | 0.1% (14) | 0.1% (39) | 0.2% (31) | 0.0% (8) |
| Rail transportation | 0.2% (86) | 0.4% (86) | 0.0% (0) | 0.0% (0) | 0.0% (0) | 0.0% (0) |
| Alcoholic beverages merchant wholesalers | 0.2% (85) | 0.4% (85) | 0.0% (0) | 0.1% (21) | 0.1% (16) | 0.0% (5) |
| Hardware, plumbing and heating equipment, and supplies merchant wholesalers | 0.2% (84) | 0.3% (67) | 0.1% (17) | 0.1% (51) | 0.3% (51) | 0.0% (0) |
| U. S. Postal service | 0.2% (81) | 0.1% (30) | 0.3% (51) | 0.1% (45) | 0.2% (38) | 0.0% (7) |
| Air transportation | 0.2% (81) | 0.2% (39) | 0.2% (42) | 0.4% (163) | 0.5% (100) | 0.4% (63) |
| Electronic shopping and mail-order houses | 0.2% (79) | 0.3% (69) | 0.1% (10) | 0.1% (50) | 0.1% (27) | 0.1% (23) |
| Miscellaneous nondurable goods merchant wholesalers | 0.2% (76) | 0.1% (19) | 0.3% (57) | 0.3% (113) | 0.4% (87) | 0.1% (26) |
| Electrical and electronic goods merchant wholesalers | 0.2% (74) | 0.3% (62) | 0.1% (12) | 0.4% (161) | 0.6% (108) | 0.3% (53) |
| Warehousing and storage | 0.2% (72) | 0.1% (21) | 0.3% (51) | 0.4% (140) | 0.4% (73) | 0.4% (67) |
| Nonmetallic mineral products | 0.2% (72) | 0.3% (72) | 0.0% (0) | 0.1% (54) | 0.3% (54) | 0.0% (0) |
| Music stores | 0.2% (64) | 0.2% (39) | 0.1% (25) | 0.2% (91) | 0.3% (50) | 0.2% (41) |
| Other direct selling establishments | 0.2% (62) | 0.1% (30) | 0.2% (32) | 0.5% (191) | 0.2% (45) | 0.8% (146) |
| Book stores and news dealers | 0.1% (58) | 0.1% (29) | 0.1% (29) | 0.3% (96) | 0.2% (34) | 0.4% (62) |
| Motor vehicles, parts and supplies merchant wholesalers | 0.1% (48) | 0.1% (23) | 0.1% (25) | 0.3% (104) | 0.4% (81) | 0.1% (23) |
| Furniture and related product manufacturing | 0.1% (47) | 0.1% (11) | 0.2% (36) | 0.2% (59) | 0.2% (47) | 0.1% (12) |
| Recyclable material merchant wholesalers | 0.1% (45) | 0.2% (45) | 0.0% (0) | 0.1% (21) | 0.1% (21) | 0.0% (0) |
| Lumber and other construction materials merchant wholesalers | 0.1% (32) | 0.2% (32) | 0.0% (0) | 0.0% (15) | 0.1% (10) | 0.0% (5) |
| Leather and allied products | 0.1% (32) | 0.2% (32) | 0.0% (0) | 0.0% (5) | 0.0% (5) | 0.0% (0) |
| Apparel | 0.1% (31) | 0.1% (14) | 0.1% (17) | 0.1% (40) | 0.1% (21) | 0.1% (19) |
| Miscellaneous durable goods merchant wholesalers | 0.1% (27) | 0.1% (27) | 0.0% (0) | 0.2% (63) | 0.2% (45) | 0.1% (18) |
| Private households | 0.1% (26) | 0.0% (0) | 0.1% (26) | 0.2% (62) | 0.0% (0) | 0.4% (62) |
| Retail florists | 0.1% (23) | 0.1% (13) | 0.1% (10) | 0.2% (87) | 0.1% (25) | 0.4% (62) |
| Drugs, sundries, and chemical and allied products merchant wholesalers | 0.0% (16) | 0.0% (0) | 0.1% (16) | 0.1% (31) | 0.2% (31) | 0.0% (0) |
| Jewelry, luggage, and leather goods stores | 0.0% (10) | 0.0% (0) | 0.1% (10) | 0.2% (59) | 0.2% (35) | 0.1% (24) |
| Vending machine operators | 0.0% (0) | 0.0% (0) | 0.0% (0) | 0.1% (49) | 0.2% (37) | 0.1% (12) |
| Management of companies and enterprises | 0.0% (0) | 0.0% (0) | 0.0% (0) | 0.1% (37) | 0.0% (0) | 0.2% (37) |
Unemployment in Appleton
- Unemployment by race in 2022
- Unemployment rate for White non-Hispanic residents
- 3.9%Males
- 0.9%Females
- Unemployment rate for Black residents
- 23.6%Males
- 6.8%Females
- Unemployment rate for American Indian and Alaska Native residents
- 12.7%Males
- Unemployment rate for Asian residents
- 5.0%Males
- 1.7%Females
- Unemployment rate for other race residents
- 5.8%Females
- Unemployment rate for two or more race residents
- 3.2%Males
- 1.8%Females
- Unemployment rate for Hispanic or Latino residents
- 3.8%Males
- 4.0%Females
- Unemployment by race in 2000
- Unemployment rate for White non-Hispanic residents
- 3.1%Males
- 2.9%Females
- Unemployment rate for Black residents
- 8.7%Males
- 4.7%Females
- Unemployment rate for American Indian and Alaska Native residents
- 2.0%Males
- 10.1%Females
- Unemployment rate for Asian residents
- 8.3%Males
- 9.3%Females
- Unemployment rate for two or more race residents
- 22.9%Females
- Unemployment rate for Hispanic or Latino residents
- 1.4%Males
- 10.5%Females
Unemployment in 2023:
| Appleton: | 2.4% |
| Wisconsin: | 2.7% |
Unemployment in 2022:
| Appleton: | 2.6% |
| Wisconsin: | 2.9% |
Unemployment in 2021:
| Appleton: | 3.3% |
| Wisconsin: | 3.8% |
Unemployment in 2020:
| Appleton: | 5.9% |
| Wisconsin: | 6.4% |
Unemployment in 2019:
| Appleton: | 2.9% |
| Wisconsin: | 3.2% |
Unemployment in 2018:
| Appleton: | 2.9% |
| Wisconsin: | 3.0% |
Unemployment in 2017:
| Appleton: | 3.2% |
| Wisconsin: | 3.3% |
Unemployment in 2016:
| Appleton: | 3.6% |
| Wisconsin: | 3.9% |
Unemployment in 2015:
| Appleton: | 3.9% |
| Wisconsin: | 4.4% |
Unemployment in 2014:
| Appleton: | 4.8% |
| Wisconsin: | 5.3% |
Unemployment in 2013:
| Appleton: | 7.8% |
| Wisconsin: | 6.7% |
Unemployment in 2012:
| Appleton: | 8.1% |
| Wisconsin: | 6.9% |
Unemployment in 2011:
| Appleton: | 8.7% |
| Wisconsin: | 7.6% |
Unemployment in 2010:
| Appleton: | 10.2% |
| Wisconsin: | 8.5% |
Unemployment in 2009:
| Appleton: | 11.3% |
| Wisconsin: | 9.0% |
Unemployment in 2008:
| Appleton: | 6.0% |
| Wisconsin: | 4.9% |
Unemployment in 2007:
| Appleton: | 5.8% |
| Wisconsin: | 4.8% |
Unemployment in 2006:
| Appleton: | 5.9% |
| Wisconsin: | 4.7% |
Unemployment in 2005:
| Appleton: | 5.7% |
| Wisconsin: | 4.8% |
Unemployment in 2004:
| Appleton: | 6.1% |
| Wisconsin: | 5.0% |
Unemployment in 2003:
| Appleton: | 6.9% |
| Wisconsin: | 5.6% |
Unemployment in 2002:
| Appleton: | 6.7% |
| Wisconsin: | 5.3% |
Unemployment in 2001:
| Appleton: | 4.7% |
| Wisconsin: | 4.4% |
Unemployment in 2000:
| Appleton: | 3.2% |
| Wisconsin: | 3.4% |
Unemployment in 1999:
| Appleton: | 3.0% |
| Wisconsin: | 3.1% |
Unemployment in 1998:
| Appleton: | 3.1% |
| Wisconsin: | 3.3% |
Unemployment in 1997:
| Appleton: | 3.4% |
| Wisconsin: | 3.5% |
Unemployment in 1996:
| Appleton: | 3.4% |
| Wisconsin: | 3.6% |
Unemployment in 1995:
| Appleton: | 3.6% |
| Wisconsin: | 3.7% |
Unemployment in 1994:
| Appleton: | 3.9% |
| Wisconsin: | 4.2% |
Unemployment in 1993:
| Appleton: | 3.7% |
| Wisconsin: | 4.3% |
Unemployment in 1992:
| Appleton: | 4.1% |
| Wisconsin: | 5.1% |
Unemployment in 1991:
| Appleton: | 4.1% |
| Wisconsin: | 5.4% |
Unemployment in 1990:
| Appleton: | 3.6% |
| Wisconsin: | 4.4% |
Time leaving home to go to work

12:00 a.m. to 4:59 a.m.:
| Appleton: | 5.3% (1,882) |
| Wisconsin: | 7.1% (183,932) |
5:00 a.m. to 5:29 a.m.:
| Appleton: | 4.1% (1,458) |
| Wisconsin: | 4.8% (125,293) |
5:30 a.m. to 5:59 a.m.:
| Appleton: | 2.3% (807) |
| Wisconsin: | 6.1% (158,537) |
6:00 a.m. to 6:29 a.m.:
| Appleton: | 7.2% (2,547) |
| Wisconsin: | 8.4% (217,665) |
6:30 a.m. to 6:59 a.m.:
| Appleton: | 12.2% (4,308) |
| Wisconsin: | 10.6% (275,304) |
7:00 a.m. to 7:29 a.m.:
| Appleton: | 10.4% (3,689) |
| Wisconsin: | 14.9% (388,183) |
7:30 a.m. to 7:59 a.m.:
| Appleton: | 16.4% (5,789) |
| Wisconsin: | 12.8% (333,706) |
8:00 a.m. to 8:29 a.m.:
| Appleton: | 9.4% (3,331) |
| Wisconsin: | 8.6% (222,710) |
8:30 a.m. to 8:59 a.m.:
| Appleton: | 4.8% (1,712) |
| Wisconsin: | 4.0% (103,334) |
9:00 a.m. to 9:59 a.m.:
| Appleton: | 3.7% (1,324) |
| Wisconsin: | 4.7% (123,131) |
10:00 a.m. to 10:59 a.m.:
| Appleton: | 1.8% (621) |
| Wisconsin: | 2.3% (59,068) |
11:00 a.m. to 11:59 a.m.:
| Appleton: | 1.5% (548) |
| Wisconsin: | 1.3% (34,018) |
12:00 p.m. to 3:59 p.m.:
| Appleton: | 10.3% (3,631) |
| Wisconsin: | 8.0% (208,210) |
4:00 p.m. to 11:59 p.m.:
| Appleton: | 10.6% (3,734) |
| Wisconsin: | 6.6% (170,847) |

<5am:
| Appleton: | 3.0% (1,087) |
| Wisconsin: | 4.1% (109,243) |
5:30am:
| Appleton: | 2.6% (944) |
| Wisconsin: | 3.6% (96,106) |
6am:
| Appleton: | 5.3% (1,939) |
| Wisconsin: | 5.7% (152,711) |
6:30am:
| Appleton: | 7.4% (2,711) |
| Wisconsin: | 8.6% (230,911) |
7am:
| Appleton: | 11.9% (4,350) |
| Wisconsin: | 11.2% (301,313) |
7:30am:
| Appleton: | 14.1% (5,124) |
| Wisconsin: | 13.7% (369,283) |
8am:
| Appleton: | 17.5% (6,394) |
| Wisconsin: | 15.1% (406,072) |
8:30am:
| Appleton: | 8.4% (3,072) |
| Wisconsin: | 7.7% (207,205) |
9am:
| Appleton: | 3.3% (1,218) |
| Wisconsin: | 3.6% (96,083) |
10am:
| Appleton: | 4.2% (1,546) |
| Wisconsin: | 3.7% (99,733) |
11am:
| Appleton: | 1.4% (515) |
| Wisconsin: | 1.7% (46,480) |
12pm:
| Appleton: | 1.4% (492) |
| Wisconsin: | 1.0% (27,021) |
4pm:
| Appleton: | 9.0% (3,262) |
| Wisconsin: | 8.7% (233,209) |
>4pm:
| Appleton: | 8.2% (3,000) |
| Wisconsin: | 7.8% (209,939) |

12:00 a.m. to 4:59 a.m. - Males:
| Appleton: | 5.9% (1,092) |
| Wisconsin: | 9.3% (129,855) |
5:00 a.m. to 5:29 a.m. - Males:
| Appleton: | 5.7% (1,054) |
| Wisconsin: | 6.4% (90,003) |
5:30 a.m. to 5:59 a.m. - Males:
| Appleton: | 2.2% (405) |
| Wisconsin: | 7.7% (107,821) |
6:00 a.m. to 6:29 a.m. - Males:
| Appleton: | 7.4% (1,359) |
| Wisconsin: | 9.6% (133,876) |
6:30 a.m. to 6:59 a.m. - Males:
| Appleton: | 11.6% (2,145) |
| Wisconsin: | 10.6% (148,251) |
7:00 a.m. to 7:29 a.m. - Males:
| Appleton: | 9.2% (1,700) |
| Wisconsin: | 13.2% (185,112) |
7:30 a.m. to 7:59 a.m. - Males:
| Appleton: | 14.4% (2,652) |
| Wisconsin: | 10.4% (145,986) |
8:00 a.m. to 8:29 a.m. - Males:
| Appleton: | 10.5% (1,928) |
| Wisconsin: | 7.3% (102,765) |
8:30 a.m. to 8:59 a.m. - Males:
| Appleton: | 5.9% (1,096) |
| Wisconsin: | 3.3% (46,739) |
9:00 a.m. to 9:59 a.m. - Males:
| Appleton: | 1.7% (314) |
| Wisconsin: | 3.9% (54,420) |
10:00 a.m. to 10:59 a.m. - Males:
| Appleton: | 1.7% (319) |
| Wisconsin: | 2.1% (29,728) |
11:00 a.m. to 11:59 a.m. - Males:
| Appleton: | 2.1% (392) |
| Wisconsin: | 1.2% (16,141) |
12:00 p.m. to 3:59 p.m. - Males:
| Appleton: | 10.8% (1,983) |
| Wisconsin: | 8.2% (114,590) |
4:00 p.m. to 11:59 p.m. - Males:
| Appleton: | 10.8% (1,991) |
| Wisconsin: | 6.7% (93,883) |

12:00 a.m. to 4:59 a.m. - Females:
| Appleton: | 4.7% (790) |
| Wisconsin: | 4.5% (54,077) |
5:00 a.m. to 5:29 a.m. - Females:
| Appleton: | 2.4% (404) |
| Wisconsin: | 2.9% (35,290) |
5:30 a.m. to 5:59 a.m. - Females:
| Appleton: | 2.4% (402) |
| Wisconsin: | 4.2% (50,716) |
6:00 a.m. to 6:29 a.m. - Females:
| Appleton: | 7.0% (1,188) |
| Wisconsin: | 7.0% (83,789) |
6:30 a.m. to 6:59 a.m. - Females:
| Appleton: | 12.8% (2,163) |
| Wisconsin: | 10.5% (127,053) |
7:00 a.m. to 7:29 a.m. - Females:
| Appleton: | 11.7% (1,989) |
| Wisconsin: | 16.9% (203,071) |
7:30 a.m. to 7:59 a.m. - Females:
| Appleton: | 18.5% (3,137) |
| Wisconsin: | 15.6% (187,720) |
8:00 a.m. to 8:29 a.m. - Females:
| Appleton: | 8.3% (1,403) |
| Wisconsin: | 10.0% (119,945) |
8:30 a.m. to 8:59 a.m. - Females:
| Appleton: | 3.6% (616) |
| Wisconsin: | 4.7% (56,595) |
9:00 a.m. to 9:59 a.m. - Females:
| Appleton: | 6.0% (1,010) |
| Wisconsin: | 5.7% (68,711) |
10:00 a.m. to 10:59 a.m. - Females:
| Appleton: | 1.8% (302) |
| Wisconsin: | 2.4% (29,340) |
11:00 a.m. to 11:59 a.m. - Females:
| Appleton: | 0.9% (156) |
| Wisconsin: | 1.5% (17,877) |
12:00 p.m. to 3:59 p.m. - Females:
| Appleton: | 9.7% (1,648) |
| Wisconsin: | 7.8% (93,620) |
4:00 p.m. to 11:59 p.m. - Females:
| Appleton: | 10.3% (1,743) |
| Wisconsin: | 6.4% (76,964) |
Travel time to work
Percentage of workers working in this county: 65.9%
Number of people working at home: 6,141 (14.8% of all workers)
Daytime population change due to commuting: +5,872 (+8.4%)
Workers who live and work in this city: 16,472 (45.2%)
Number of people working at home: 6,141 (14.8% of all workers)
Daytime population change due to commuting: +5,872 (+8.4%)
Workers who live and work in this city: 16,472 (45.2%)

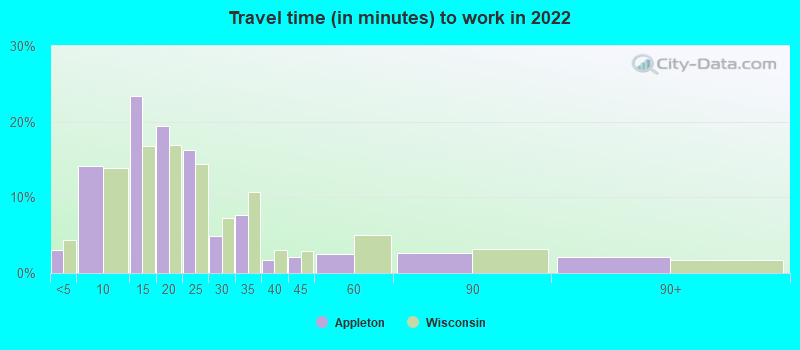

Less than 5 minutes:
| Appleton: | 3.0% (1,128) |
| Wisconsin: | 4.4% (113,686) |
5 to 9 minutes:
| Appleton: | 14.1% (5,305) |
| Wisconsin: | 13.8% (359,056) |
10 to 14 minutes:
| Appleton: | 23.4% (8,779) |
| Wisconsin: | 16.7% (434,072) |
15 to 19 minutes:
| Appleton: | 19.5% (7,293) |
| Wisconsin: | 16.9% (437,664) |
20 to 24 minutes:
| Appleton: | 16.2% (6,079) |
| Wisconsin: | 14.4% (373,281) |
25 to 29 minutes:
| Appleton: | 4.8% (1,811) |
| Wisconsin: | 7.3% (188,109) |
30 to 34 minutes:
| Appleton: | 7.7% (2,892) |
| Wisconsin: | 10.7% (277,572) |
35 to 39 minutes:
| Appleton: | 1.8% (667) |
| Wisconsin: | 3.0% (78,242) |
40 to 44 minutes:
| Appleton: | 2.1% (770) |
| Wisconsin: | 3.0% (76,637) |
45 to 59 minutes:
| Appleton: | 2.5% (943) |
| Wisconsin: | 5.0% (130,638) |
60 to 89 minutes:
| Appleton: | 2.7% (1,007) |
| Wisconsin: | 3.1% (80,568) |
90 or more minutes:
| Appleton: | 2.2% (818) |
| Wisconsin: | 1.7% (44,601) |


Less than 5 minutes:
| Appleton: | 4.0% (1,453) |
| Wisconsin: | 5.0% (135,194) |
5 to 9 minutes:
| Appleton: | 16.8% (6,139) |
| Wisconsin: | 14.8% (398,697) |
10 to 14 minutes:
| Appleton: | 25.7% (9,368) |
| Wisconsin: | 17.7% (476,569) |
15 to 19 minutes:
| Appleton: | 23.1% (8,428) |
| Wisconsin: | 16.4% (440,637) |
20 to 24 minutes:
| Appleton: | 13.3% (4,861) |
| Wisconsin: | 13.8% (372,180) |
25 to 29 minutes:
| Appleton: | 3.2% (1,158) |
| Wisconsin: | 5.9% (159,448) |
30 to 34 minutes:
| Appleton: | 5.6% (2,025) |
| Wisconsin: | 9.2% (248,714) |
35 to 39 minutes:
| Appleton: | 1.0% (376) |
| Wisconsin: | 2.2% (59,121) |
40 to 44 minutes:
| Appleton: | 1.0% (375) |
| Wisconsin: | 2.3% (61,540) |
45 to 59 minutes:
| Appleton: | 1.8% (674) |
| Wisconsin: | 4.5% (120,028) |
60 to 89 minutes:
| Appleton: | 1.1% (408) |
| Wisconsin: | 2.5% (68,071) |
90 or more minutes:
| Appleton: | 1.1% (389) |
| Wisconsin: | 1.7% (45,110) |

Less than 5 minutes - Males:
| Appleton: | 2.7% (512) |
| Wisconsin: | 4.3% (60,311) |
5 to 9 minutes - Males:
| Appleton: | 12.8% (2,381) |
| Wisconsin: | 12.8% (178,603) |
10 to 14 minutes - Males:
| Appleton: | 22.3% (4,165) |
| Wisconsin: | 15.5% (216,065) |
15 to 19 minutes - Males:
| Appleton: | 19.8% (3,700) |
| Wisconsin: | 16.2% (226,799) |
20 to 24 minutes - Males:
| Appleton: | 16.3% (3,038) |
| Wisconsin: | 14.9% (207,665) |
25 to 29 minutes - Males:
| Appleton: | 5.0% (926) |
| Wisconsin: | 7.2% (100,945) |
30 to 34 minutes - Males:
| Appleton: | 8.7% (1,613) |
| Wisconsin: | 11.2% (157,240) |
35 to 39 minutes - Males:
| Appleton: | 1.7% (316) |
| Wisconsin: | 3.3% (45,514) |
40 to 44 minutes - Males:
| Appleton: | 1.6% (298) |
| Wisconsin: | 3.1% (43,903) |
45 to 59 minutes - Males:
| Appleton: | 3.5% (652) |
| Wisconsin: | 5.7% (80,094) |
60 to 89 minutes - Males:
| Appleton: | 3.3% (607) |
| Wisconsin: | 3.7% (51,312) |
90 or more minutes - Males:
| Appleton: | 2.4% (439) |
| Wisconsin: | 2.1% (29,699) |

Less than 5 minutes - Females:
| Appleton: | 3.3% (616) |
| Wisconsin: | 4.5% (53,375) |
5 to 9 minutes - Females:
| Appleton: | 15.5% (2,924) |
| Wisconsin: | 15.1% (180,453) |
10 to 14 minutes - Females:
| Appleton: | 24.5% (4,614) |
| Wisconsin: | 18.2% (218,007) |
15 to 19 minutes - Females:
| Appleton: | 19.1% (3,593) |
| Wisconsin: | 17.6% (210,865) |
20 to 24 minutes - Females:
| Appleton: | 16.1% (3,041) |
| Wisconsin: | 13.8% (165,616) |
25 to 29 minutes - Females:
| Appleton: | 4.7% (885) |
| Wisconsin: | 7.3% (87,164) |
30 to 34 minutes - Females:
| Appleton: | 6.8% (1,279) |
| Wisconsin: | 10.1% (120,332) |
35 to 39 minutes - Females:
| Appleton: | 1.9% (351) |
| Wisconsin: | 2.7% (32,728) |
40 to 44 minutes - Females:
| Appleton: | 2.5% (472) |
| Wisconsin: | 2.7% (32,734) |
45 to 59 minutes - Females:
| Appleton: | 1.5% (291) |
| Wisconsin: | 4.2% (50,544) |
60 to 89 minutes - Females:
| Appleton: | 2.1% (400) |
| Wisconsin: | 2.4% (29,256) |
90 or more minutes - Females:
| Appleton: | 2.0% (379) |
| Wisconsin: | 1.2% (14,902) |
Means of transportation to work
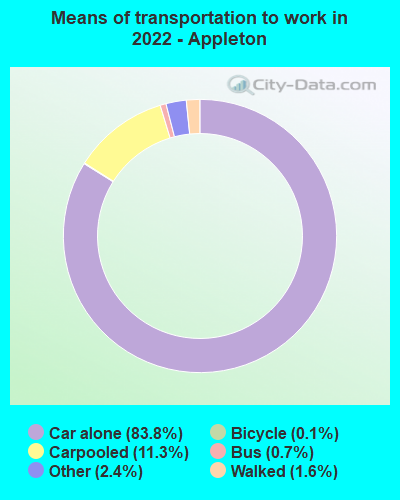
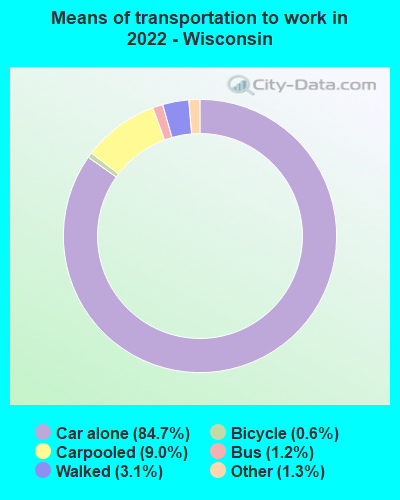
Drove car alone:
| Appleton: | 83.8% (31,434) |
| Wisconsin: | 84.7% (1,005,754) |
Carpooled:
| Appleton: | 11.3% (4,224) |
| Wisconsin: | 9.0% (118,118) |
Bus:
| Appleton: | 0.7% (274) |
| Wisconsin: | 1.2% (16,013) |
Bicycle:
| Appleton: | 0.1% (50) |
| Wisconsin: | 0.6% (4,164) |
Walked:
| Appleton: | 1.6% (610) |
| Wisconsin: | 3.1% (37,887) |
Other means:
| Appleton: | 2.4% (900) |
| Wisconsin: | 1.3% (13,766) |


Drove car alone:
| Appleton: | 83.5% (30,427) |
| Wisconsin: | 79.5% (2,138,832) |
Carpooled:
| Appleton: | 8.0% (2,925) |
| Wisconsin: | 9.9% (267,471) |
Bus or trolley bus:
| Appleton: | 1.1% (399) |
| Wisconsin: | 1.8% (49,121) |
Motorcycle:
| Appleton: | 0.1% (30) |
| Wisconsin: | 0.1% (1,823) |
Bicycle:
| Appleton: | 0.5% (197) |
| Wisconsin: | 0.4% (11,635) |
Walked:
| Appleton: | 4.3% (1,574) |
| Wisconsin: | 3.7% (100,301) |
Other means:
| Appleton: | 0.3% (102) |
| Wisconsin: | 0.4% (11,907) |

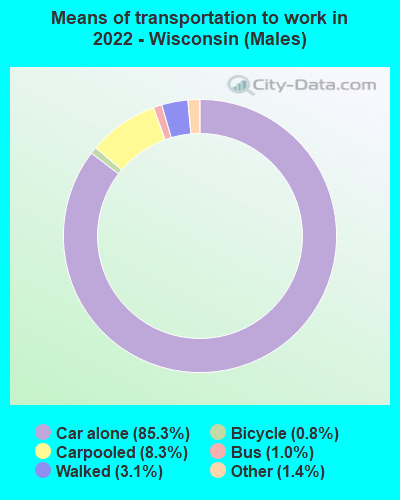
Drove car alone - Males:
| Appleton: | 83.7% (15,609) |
| Wisconsin: | 85.3% (1,005,754) |
Carpooled - Males:
| Appleton: | 11.2% (2,094) |
| Wisconsin: | 8.3% (118,118) |
Bus - Males:
| Appleton: | 0.5% (98) |
| Wisconsin: | 1.0% (16,013) |
Bicycle - Males:
| Appleton: | 0.3% (50) |
| Wisconsin: | 0.8% (4,164) |
Walked - Males:
| Appleton: | 1.3% (251) |
| Wisconsin: | 3.1% (37,887) |
Other means - Males:
| Appleton: | 2.9% (545) |
| Wisconsin: | 1.4% (13,766) |

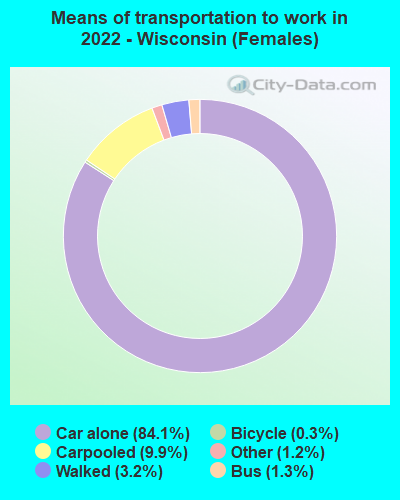
Drove car alone - Females:
| Appleton: | 84.0% (15,825) |
| Wisconsin: | 84.1% (1,005,754) |
Carpooled - Females:
| Appleton: | 11.3% (2,130) |
| Wisconsin: | 9.9% (118,118) |
Bus - Females:
| Appleton: | 0.9% (176) |
| Wisconsin: | 1.3% (16,013) |
Walked - Females:
| Appleton: | 1.9% (359) |
| Wisconsin: | 3.2% (37,887) |
Other means - Females:
| Appleton: | 1.9% (355) |
| Wisconsin: | 1.2% (13,766) |
Private vehicle occupancy

Drove alone:
| Appleton: | 88.6% (29,433) |
| Wisconsin: | 90.4% (2,211,143) |
In 2 person carpool:
| Appleton: | 9.2% (3,054) |
| Wisconsin: | 7.2% (176,420) |
In 3 person carpool:
| Appleton: | 1.9% (615) |
| Wisconsin: | 1.5% (36,257) |
In 4 person carpool:
| Appleton: | 0.3% (87) |
| Wisconsin: | 0.5% (11,427) |
In 5-6 person carpool:
| Appleton: | 0.0% (3) |
| Wisconsin: | 0.3% (6,215) |
In 7+ person carpool:
| Appleton: | 0.0% (11) |
| Wisconsin: | 0.1% (3,214) |

Drove alone:
| Appleton: | 91.2% (30,427) |
| Wisconsin: | 88.9% (2,138,832) |
In 2 person carpool:
| Appleton: | 7.5% (2,489) |
| Wisconsin: | 9.1% (217,793) |
In 3 person carpool:
| Appleton: | 1.0% (335) |
| Wisconsin: | 1.3% (32,067) |
In 4 person carpool:
| Appleton: | 0.2% (68) |
| Wisconsin: | 0.4% (10,058) |
In 5-6 person carpool:
| Appleton: | 0.1% (33) |
| Wisconsin: | 0.2% (4,267) |
Class of workers

Employee of private company:
| Appleton: | 72.4% (30,227) |
| Wisconsin: | 68.4% (2,077,928) |
Self-employed in own incorporated business:
| Appleton: | 3.7% (1,529) |
| Wisconsin: | 3.4% (103,807) |
Private not-for-profit wage and salary workers:
| Appleton: | 11.0% (4,574) |
| Wisconsin: | 10.0% (304,061) |
Local government workers:
| Appleton: | 7.1% (2,956) |
| Wisconsin: | 7.5% (227,235) |
State government workers:
| Appleton: | 1.8% (770) |
| Wisconsin: | 3.9% (116,951) |
Federal government workers:
| Appleton: | 0.7% (288) |
| Wisconsin: | 1.4% (43,590) |
Self-employed workers in own not incorporated business:
| Appleton: | 3.3% (1,362) |
| Wisconsin: | 5.2% (158,299) |
Unpaid family workers:
| Appleton: | 0.1% (34) |
| Wisconsin: | 0.2% (5,092) |

Employee of private company:
| Appleton: | 74.6% (27,588) |
| Wisconsin: | 70.2% (1,919,753) |
Self-employed in own incorporated business:
| Appleton: | 2.2% (815) |
| Wisconsin: | 2.8% (77,876) |
Private not-for-profit wage and salary workers:
| Appleton: | 11.4% (4,208) |
| Wisconsin: | 8.0% (219,861) |
Local government workers:
| Appleton: | 5.7% (2,122) |
| Wisconsin: | 6.9% (189,838) |
State government workers:
| Appleton: | 1.8% (657) |
| Wisconsin: | 4.1% (111,964) |
Federal government workers:
| Appleton: | 0.3% (129) |
| Wisconsin: | 1.4% (38,990) |
Self-employed workers in own not incorporated business:
| Appleton: | 3.8% (1,403) |
| Wisconsin: | 6.1% (167,248) |
Unpaid family workers:
| Appleton: | 0.2% (75) |
| Wisconsin: | 0.3% (9,395) |

Employee of private company - Males:
| Appleton: | 78.0% (17,173) |
| Wisconsin: | 74.1% (1,184,472) |
Self-employed in own incorporated business - Males:
| Appleton: | 3.3% (722) |
| Wisconsin: | 4.3% (69,227) |
Private not-for-profit wage and salary workers - Males:
| Appleton: | 10.0% (2,197) |
| Wisconsin: | 5.4% (86,208) |
Local government workers - Males:
| Appleton: | 4.0% (879) |
| Wisconsin: | 5.5% (87,738) |
State government workers - Males:
| Appleton: | 1.0% (226) |
| Wisconsin: | 3.2% (51,735) |
Federal government workers - Males:
| Appleton: | 0.6% (123) |
| Wisconsin: | 1.3% (21,174) |
Self-employed workers in own not incorporated business - Males:
| Appleton: | 3.2% (699) |
| Wisconsin: | 6.0% (95,685) |

Employee of private company - Females:
| Appleton: | 66.2% (13,054) |
| Wisconsin: | 62.1% (893,456) |
Self-employed in own incorporated business - Females:
| Appleton: | 4.1% (807) |
| Wisconsin: | 2.4% (34,580) |
Private not-for-profit wage and salary workers - Females:
| Appleton: | 12.1% (2,377) |
| Wisconsin: | 15.1% (217,853) |
Local government workers - Females:
| Appleton: | 10.5% (2,077) |
| Wisconsin: | 9.7% (139,497) |
State government workers - Females:
| Appleton: | 2.8% (544) |
| Wisconsin: | 4.5% (65,216) |
Federal government workers - Females:
| Appleton: | 0.8% (165) |
| Wisconsin: | 1.6% (22,416) |
Self-employed workers in own not incorporated business - Females:
| Appleton: | 3.4% (663) |
| Wisconsin: | 4.4% (62,614) |
Unpaid family workers - Females:
| Appleton: | 0.2% (34) |
| Wisconsin: | 0.2% (2,483) |