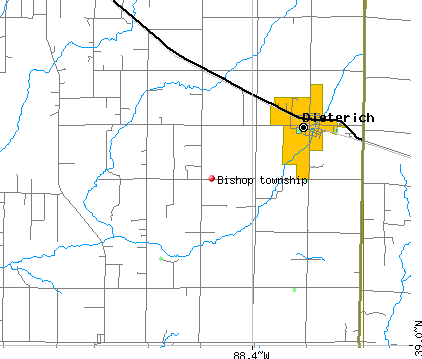
Bishop township, Effingham County, Illinois (IL) detailed profile
Number of foreign born residents: 0 (0% naturalized citizens)
| Bishop township: | 0.3% |
| Whole state: | 12.3% |
69% of Bishop township residents lived in the same house 5 years ago.
Out of people who lived in different houses, 72% lived in this county.
Out of people who lived in different counties, 87% lived in Illinois.
Place of birth for U.S.-born residents:
- This state: 1267
- Northeast: 1
- Midwest: 33
- South: 12
- West: 6
Percentage of households with unmarried partners: 4.2%
Likely homosexual households (counted as self-reported same-sex unmarried-partner households)
- Lesbian couples: 0.0% of all households
- Gay men: 0.2% of all households
Housing units in structures:
- One, detached: 408
- One, attached: 4
- Two: 10
- 5 to 9: 5
- Mobile homes: 35
- Boats, RVs, vans, etc.: 4
Median worth of mobile homes: $23,900
Housing units in Bishop township with a mortgage: 152 (5 second mortgage, 2 home equity loan, 0 both second mortgage and home equity loan)
Houses without a mortgage: 138
- Agriculture, forestry, fishing and hunting (15%)
- Construction (15%)
- Printing and related support activities (12%)
- Accommodation and food services (8%)
- Furniture and related product manufacturing (4%)
- Food and beverage stores (3%)
- Educational services (3%)
- Educational services (15%)
- Printing and related support activities (10%)
- Accommodation and food services (10%)
- Health care (9%)
- Finance and insurance (8%)
- Publishing, and motion picture and sound recording industries (7%)
- Social assistance (7%)
- Farmers and farm managers (10%)
- Electrical equipment mechanics and other installation, maintenance, and repair occupations including supervisors (8%)
- Printing workers (7%)
- Other production occupations including supervisors (6%)
- Vehicle and mobile equipment mechanics, installers, and repairers (5%)
- Cooks and food preparation workers (5%)
- Driver/sales workers and truck drivers (5%)
- Other food preparation and serving workers including supervisors (7%)
- Preschool, kindergarten, elementary and middle school teachers (7%)
- Child care workers (7%)
- Other office and administrative support workers including supervisors (7%)
- Bookkeeping, accounting, and auditing clerks (6%)
- Customer service representatives (6%)
- Secretaries and administrative assistants (4%)
Most common first ancestries reported in Bishop township:
- German (68.1%)
- United States or American (18.5%)
- English (4.2%)
- Irish (2.4%)
- Swedish (1.6%)
- Dutch (1.1%)
- Czechoslovakian (0.7%)
Most common places of birth for the foreign-born residents:
- Sweden (50%)
- Australia (50%)
Means of transportation to work:
- Drove a car alone: 542 (81%)
- Carpooled: 55 (8%)
- Bus or trolley bus: 6 (1%)
- Walked: 6 (1%)
- Other means: 13 (2%)
- Worked at home: 48 (7%)
Most commonly used house heating fuel:
- Utility gas (50%)
- Bottled, tank, or LP gas (27%)
- Wood (11%)
- Electricity (10%)
- Fuel oil, kerosene, etc. (2%)
98.4% of residents of Bishop township speak English at home.
0.7% of residents speak Spanish at home (100% speak English very well).
0.9% of residents speak other Indo-European language at home (45% speak English very well, 55% speak English well).
Household type by relationship:
Households: 1,324- In family households: 1,214 (281 male householders, 56 female householders)
281 spouses, 537 children (519 natural, 2 adopted, 16 stepchildren), 14 grandchildren, 0 brothers or sisters, 0 parents, 6 other relatives, 39 non-relatives
- In nonfamily households: 110 (55 male householders (41 living alone)), 43 female householders (43 living alone)), 12 nonrelatives
Size of family households: 114 2-persons, 54 3-persons, 74 4-persons, 67 5-persons, 15 6-persons, 13 7-or-more-persons,
Size of nonfamily households: 84 1-person, 14 2-persons,
418 married couples with children.
73 single-parent households (18 men, 55 women).
Private vs. public school enrollment:
Students in private schools in grades 1 to 8 (elementary and middle school): 0
| Here: | 0.0% |
| Illinois: | 13.4% |
Students in private schools in grades 9 to 12 (high school): 0
| Here: | 0.0% |
| Illinois: | 11.1% |
Students in private undergraduate colleges: 3
| Here: | 12.5% |
| Illinois: | 25.8% |