Races in Woodmere, New York (NY) Detailed Stats
Data:
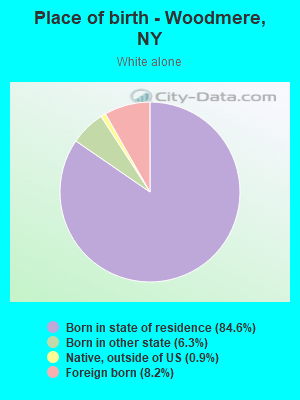
Races - White alone (%)
Races - White alone (% change since 2000)
Races - Black alone (%)
Races - Black alone (% change since 2000)
Races - American Indian alone (%)
Races - American Indian alone (% change since 2000)
Races - Asian alone (%)
Races - Asian alone (% change since 2000)
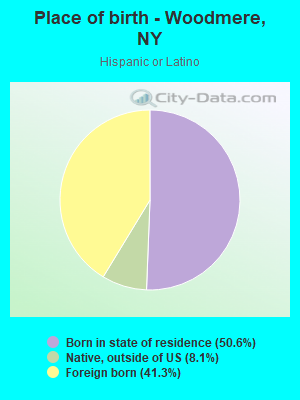
Races - Hispanic (%)
Races - Hispanic (% change since 2000)
Races - Native Hawaiian and Other Pacific Islander alone (%)
Races - Native Hawaiian and Other Pacific Islander alone (% change since 2000)
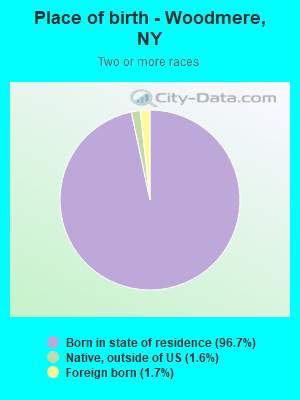
Races - Two or more races(%)
Races - Two or more races(% change since 2000)
Races - Other race alone (%)
Races - Other race alone (% change since 2000)
Racial diversity
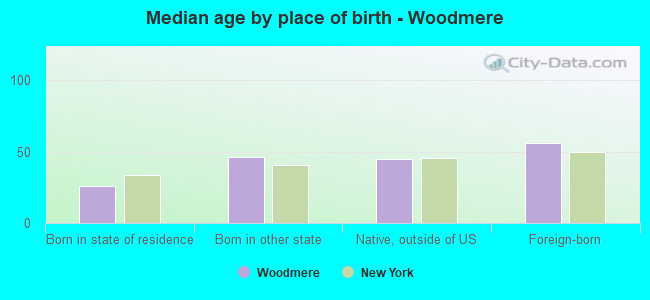
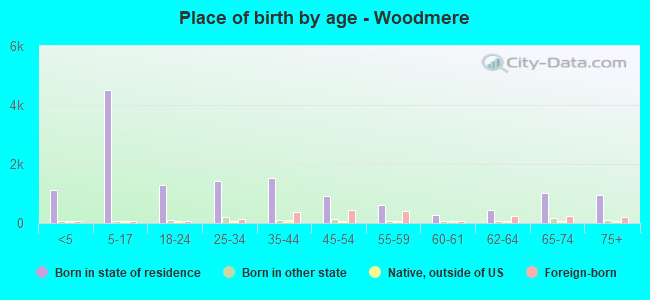
Place of birth - Born in state of residence (%)
Place of birth - Born in state of residence (%) - White
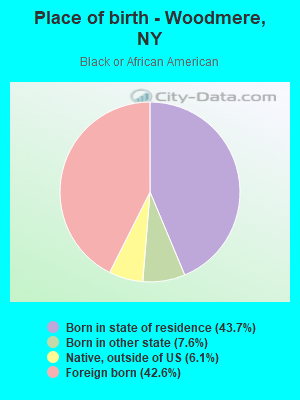
Place of birth - Born in state of residence (%) - Black or African American
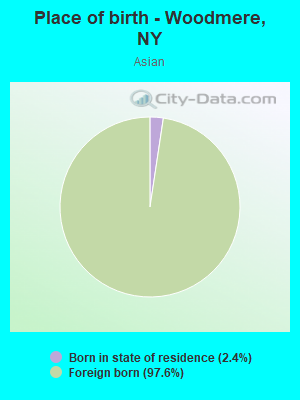
Place of birth - Born in state of residence (%) - Asian
Place of birth - Born in state of residence (%) - Hispanic or Latino
Place of birth - Born in state of residence (%) - American Indian and Alaska Native
Place of birth - Born in state of residence (%) - Multirace
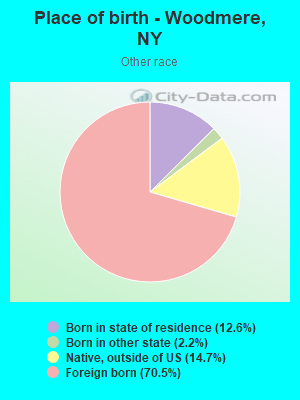
Place of birth - Born in state of residence (%) - Other Race
Place of birth - Born in other state (%)
Place of birth - Born in other state (%) - White
Place of birth - Born in other state (%) - Black or African American
Place of birth - Born in other state (%) - Asian
Place of birth - Born in other state (%) - Hispanic or Latino
Place of birth - Born in other state (%) - American Indian and Alaska Native
Place of birth - Born in other state (%) - Multirace
Place of birth - Born in other state (%) - Other Race
Place of birth - Native, outside of US (%)
Place of birth - Native, outside of US (%) - White
Place of birth - Native, outside of US (%) - Black or African American
Place of birth - Native, outside of US (%) - Asian
Place of birth - Native, outside of US (%) - Hispanic or Latino
Place of birth - Native, outside of US (%) - American Indian and Alaska Native
Place of birth - Native, outside of US (%) - Multirace
Place of birth - Native, outside of US (%) - Other Race
Place of birth - Foreign born (%)
Place of birth - Foreign born (%) - White
Place of birth - Foreign born (%) - Black or African American
Place of birth - Foreign born (%) - Asian
Place of birth - Foreign born (%) - Hispanic or Latino
Place of birth - Foreign born (%) - American Indian and Alaska Native
Place of birth - Foreign born (%) - Multirace
Place of birth - Foreign born (%) - Other Race
Residents speaking English at home (%)
Residents speaking English at home - Born in the United States (%)
Residents speaking English at home - Native, born elsewhere (%)
Residents speaking English at home - Foreign born (%)
Residents speaking Spanish at home (%)
Residents speaking Spanish at home - Born in the United States (%)
Residents speaking Spanish at home - Native, born elsewhere (%)
Residents speaking Spanish at home - Foreign born (%)
Residents speaking other language at home (%)
Residents speaking other language at home - Born in the United States (%)
Residents speaking other language at home - Native, born elsewhere (%)
Residents speaking other language at home - Foreign born (%)
Marital status - Never married (%)
Marital status - Now married (%)
Marital status - Separated (%)
Marital status - Widowed (%)
Marital status - Divorced (%)
Ancestries Reported - Arab (%)
Ancestries Reported - Czech (%)
Ancestries Reported - Danish (%)
Ancestries Reported - Dutch (%)
Ancestries Reported - English (%)
Ancestries Reported - French (%)
Ancestries Reported - French Canadian (%)
Ancestries Reported - German (%)
Ancestries Reported - Greek (%)
Ancestries Reported - Hungarian (%)
Ancestries Reported - Irish (%)
Ancestries Reported - Italian (%)
Ancestries Reported - Lithuanian (%)
Ancestries Reported - Norwegian (%)
Ancestries Reported - Polish (%)
Ancestries Reported - Portuguese (%)
Ancestries Reported - Russian (%)
Ancestries Reported - Scotch-Irish (%)
Ancestries Reported - Scottish (%)
Ancestries Reported - Slovak (%)
Ancestries Reported - Subsaharan African (%)
Ancestries Reported - Swedish (%)
Ancestries Reported - Swiss (%)
Ancestries Reported - Ukrainian (%)
Ancestries Reported - United States (%)
Ancestries Reported - Welsh (%)
Ancestries Reported - West Indian (%)
Ancestries Reported - Other (%)
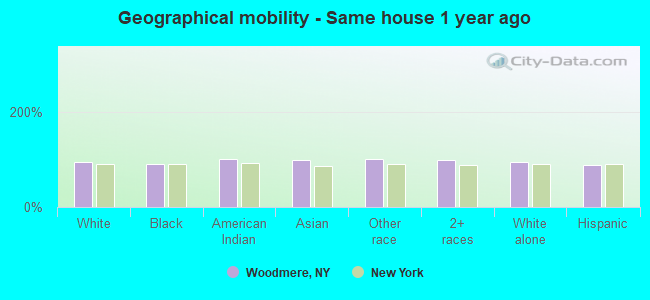
Geographical mobility - Same house 1 year ago (%)
Geographical mobility - Same house 1 year ago (%) - White
Geographical mobility - Same house 1 year ago (%) - Black or African American
Geographical mobility - Same house 1 year ago (%) - Asian
Geographical mobility - Same house 1 year ago (%) - Hispanic or Latino
Geographical mobility - Same house 1 year ago (%) - American Indian and Alaska Native
Geographical mobility - Same house 1 year ago (%) - Multirace
Geographical mobility - Same house 1 year ago (%) - Other Race
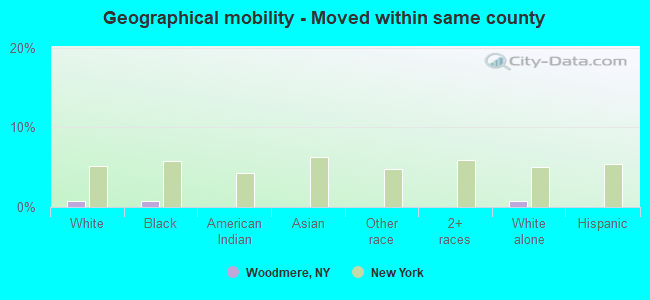
Geographical mobility - Moved within same county (%)
Geographical mobility - Moved within same county (%) - White
Geographical mobility - Moved within same county (%) - Black or African American
Geographical mobility - Moved within same county (%) - Asian
Geographical mobility - Moved within same county (%) - Hispanic or Latino
Geographical mobility - Moved within same county (%) - American Indian and Alaska Native
Geographical mobility - Moved within same county (%) - Multirace
Geographical mobility - Moved within same county (%) - Other Race
Geographical mobility - Moved from different county within same state (%)
Geographical mobility - Moved from different county within same state (%) - White
Geographical mobility - Moved from different county within same state (%) - Black or African American
Geographical mobility - Moved from different county within same state (%) - Asian
Geographical mobility - Moved from different county within same state (%) - Hispanic or Latino
Geographical mobility - Moved from different county within same state (%) - American Indian and Alaska Native
Geographical mobility - Moved from different county within same state (%) - Multirace
Geographical mobility - Moved from different county within same state (%) - Other Race
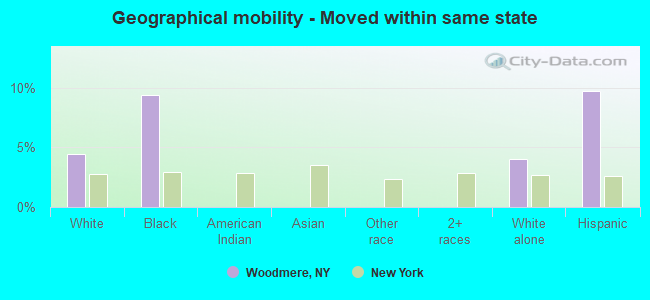
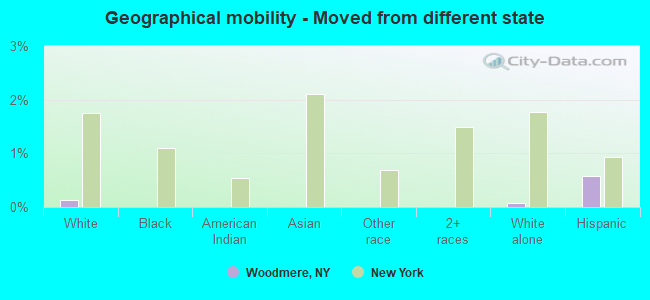
Geographical mobility - Moved from different state (%)
Geographical mobility - Moved from different state (%) - White
Geographical mobility - Moved from different state (%) - Black or African American
Geographical mobility - Moved from different state (%) - Asian
Geographical mobility - Moved from different state (%) - Hispanic or Latino
Geographical mobility - Moved from different state (%) - American Indian and Alaska Native
Geographical mobility - Moved from different state (%) - Multirace
Geographical mobility - Moved from different state (%) - Other Race
Geographical mobility - Moved from abroad (%)
Geographical mobility - Moved from abroad (%) - White
Geographical mobility - Moved from abroad (%) - Black or African American
Geographical mobility - Moved from abroad (%) - Asian
Geographical mobility - Moved from abroad (%) - Hispanic or Latino
Geographical mobility - Moved from abroad (%) - American Indian and Alaska Native
Geographical mobility - Moved from abroad (%) - Multirace
Geographical mobility - Moved from abroad (%) - Other Race
Place of birth for the foreign-born population - Ireland (%)
Place of birth for the foreign-born population - Denmark (%)
Place of birth for the foreign-born population - Norway (%)
Place of birth for the foreign-born population - Sweden (%)
Place of birth for the foreign-born population - United Kingdom (%)
Place of birth for the foreign-born population - England (%)
Place of birth for the foreign-born population - Scotland (%)
Place of birth for the foreign-born population - Other Northern Europe (%)
Place of birth for the foreign-born population - Austria (%)
Place of birth for the foreign-born population - Belgium (%)
Place of birth for the foreign-born population - France (%)
Place of birth for the foreign-born population - Germany (%)
Place of birth for the foreign-born population - Netherlands (%)
Place of birth for the foreign-born population - Switzerland (%)
Place of birth for the foreign-born population - Other Western Europe (%)
Place of birth for the foreign-born population - Greece (%)
Place of birth for the foreign-born population - Italy (%)
Place of birth for the foreign-born population - Portugal (%)
Place of birth for the foreign-born population - Spain (%)
Place of birth for the foreign-born population - Other Southern Europe (%)
Place of birth for the foreign-born population - Albania (%)
Place of birth for the foreign-born population - Belarus (%)
Place of birth for the foreign-born population - Bosnia and Herzegovina (%)
Place of birth for the foreign-born population - Bulgaria (%)
Place of birth for the foreign-born population - Croatia (%)
Place of birth for the foreign-born population - Czechoslovakia (%)
Place of birth for the foreign-born population - Hungary (%)
Place of birth for the foreign-born population - Latvia (%)
Place of birth for the foreign-born population - Lithuania (%)
Place of birth for the foreign-born population - North Macedonia (Macedonia) (%)
Place of birth for the foreign-born population - Moldova (%)
Place of birth for the foreign-born population - Poland (%)
Place of birth for the foreign-born population - Romania (%)
Place of birth for the foreign-born population - Russia (%)
Place of birth for the foreign-born population - Serbia (%)
Place of birth for the foreign-born population - Ukraine (%)
Place of birth for the foreign-born population - Other Eastern Europe (%)
Place of birth for the foreign-born population - China (%)
Place of birth for the foreign-born population - Hong Kong (%)
Place of birth for the foreign-born population - Taiwan (%)
Place of birth for the foreign-born population - Japan (%)
Place of birth for the foreign-born population - Korea (%)
Place of birth for the foreign-born population - Other Eastern Asia (%)
Place of birth for the foreign-born population - Afghanistan (%)
Place of birth for the foreign-born population - Bangladesh (%)
Place of birth for the foreign-born population - India (%)
Place of birth for the foreign-born population - Iran (%)
Place of birth for the foreign-born population - Kazakhstan (%)
Place of birth for the foreign-born population - Nepal (%)
Place of birth for the foreign-born population - Pakistan (%)
Place of birth for the foreign-born population - Sri Lanka (%)
Place of birth for the foreign-born population - Uzbekistan (%)
Place of birth for the foreign-born population - Other South Central Asia (%)
Place of birth for the foreign-born population - Burma (%)
Place of birth for the foreign-born population - Cambodia (%)
Place of birth for the foreign-born population - Indonesia (%)
Place of birth for the foreign-born population - Laos (%)
Place of birth for the foreign-born population - Malaysia (%)
Place of birth for the foreign-born population - Philippines (%)
Place of birth for the foreign-born population - Singapore (%)
Place of birth for the foreign-born population - Thailand (%)
Place of birth for the foreign-born population - Vietnam (%)
Place of birth for the foreign-born population - Other South Eastern Asia (%)
Place of birth for the foreign-born population - Armenia (%)
Place of birth for the foreign-born population - Iraq (%)
Place of birth for the foreign-born population - Israel (%)
Place of birth for the foreign-born population - Jordan (%)
Place of birth for the foreign-born population - Kuwait (%)
Place of birth for the foreign-born population - Lebanon (%)
Place of birth for the foreign-born population - Saudi Arabia (%)
Place of birth for the foreign-born population - Syria (%)
Place of birth for the foreign-born population - Turkey (%)
Place of birth for the foreign-born population - Yemen (%)
Place of birth for the foreign-born population - Other Western Asia (%)
Place of birth for the foreign-born population - Eritrea (%)
Place of birth for the foreign-born population - Ethiopia (%)
Place of birth for the foreign-born population - Kenya (%)
Place of birth for the foreign-born population - Somalia (%)
Place of birth for the foreign-born population - Uganda (%)
Place of birth for the foreign-born population - Zimbabwe (%)
Place of birth for the foreign-born population - Other Eastern Africa (%)
Place of birth for the foreign-born population - Cameroon (%)
Place of birth for the foreign-born population - Congo (%)
Place of birth for the foreign-born population - Democratic Republic of Congo (Zaire) (%)
Place of birth for the foreign-born population - Other Middle Africa (%)
Place of birth for the foreign-born population - Egypt (%)
Place of birth for the foreign-born population - Morocco (%)
Place of birth for the foreign-born population - Sudan (%)
Place of birth for the foreign-born population - Other Northern Africa (%)
Place of birth for the foreign-born population - South Africa (%)
Place of birth for the foreign-born population - Other Southern Africa (%)
Place of birth for the foreign-born population - Cabo Verde (%)
Place of birth for the foreign-born population - Ghana (%)
Place of birth for the foreign-born population - Liberia (%)
Place of birth for the foreign-born population - Nigeria (%)
Place of birth for the foreign-born population - Senegal (%)
Place of birth for the foreign-born population - Sierra Leone (%)
Place of birth for the foreign-born population - Other Western Africa (%)
Place of birth for the foreign-born population - Australia (%)
Place of birth for the foreign-born population - New Zealand (%)
Place of birth for the foreign-born population - Fiji (%)
Place of birth for the foreign-born population - Micronesia (%)
Place of birth for the foreign-born population - Bahamas (%)
Place of birth for the foreign-born population - Barbados (%)
Place of birth for the foreign-born population - Cuba (%)
Place of birth for the foreign-born population - Dominica (%)
Place of birth for the foreign-born population - Dominican Republic (%)
Place of birth for the foreign-born population - Grenada (%)
Place of birth for the foreign-born population - Haiti (%)
Place of birth for the foreign-born population - Jamaica (%)
Place of birth for the foreign-born population - St. Vincent and the Grenadines (%)
Place of birth for the foreign-born population - Trinidad and Tobago (%)
Place of birth for the foreign-born population - West Indies (%)
Place of birth for the foreign-born population - Other Caribbean (%)
Place of birth for the foreign-born population - Belize (%)
Place of birth for the foreign-born population - Costa Rica (%)
Place of birth for the foreign-born population - El Salvador (%)
Place of birth for the foreign-born population - Guatemala (%)
Place of birth for the foreign-born population - Honduras (%)
Place of birth for the foreign-born population - Mexico (%)
Place of birth for the foreign-born population - Nicaragua (%)
Place of birth for the foreign-born population - Panama (%)
Place of birth for the foreign-born population - Other Central America (%)
Place of birth for the foreign-born population - Argentina (%)
Place of birth for the foreign-born population - Bolivia (%)
Place of birth for the foreign-born population - Brazil (%)
Place of birth for the foreign-born population - Chile (%)
Place of birth for the foreign-born population - Colombia (%)
Place of birth for the foreign-born population - Ecuador (%)
Place of birth for the foreign-born population - Guyana (%)
Place of birth for the foreign-born population - Peru (%)
Place of birth for the foreign-born population - Uruguay (%)
Place of birth for the foreign-born population - Venezuela (%)
Place of birth for the foreign-born population - Other South America (%)
Place of birth for the foreign-born population - Canada (%)
Place of birth for the foreign-born population - Other Northern America (%)
Place of birth for the foreign-born population - Other (%)
Latest news about races in Woodmere, NY collected exclusively by city-data.com from local newspapers, TV, and radio stations
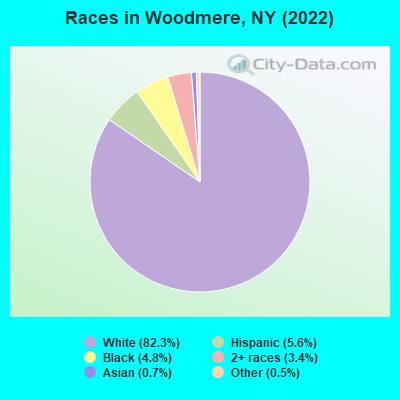
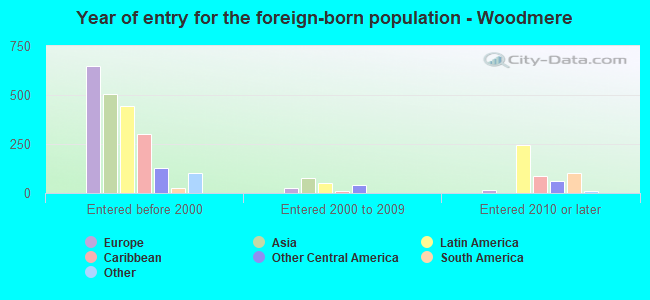
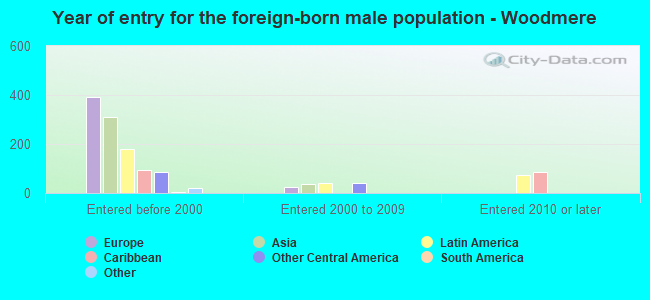
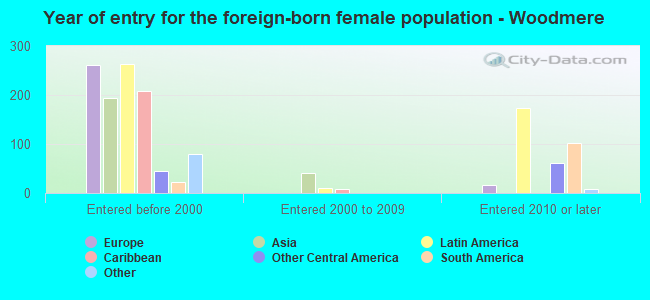
According to 2022 data, the most numerous races in Woodmere, NY are White alone (14,457 residents), Hispanic (976 residents), and Black alone (835 residents). 80.9% of Woodmere residents speak English at home. 12.0% of Woodmere, NY residents are foreign-born (4.4% born in Latin America, 4.0% born in Europe, 3.1% born in Asia), which is 84.1% less than the foreign-born rate of 22.0% across the entire state of New York.
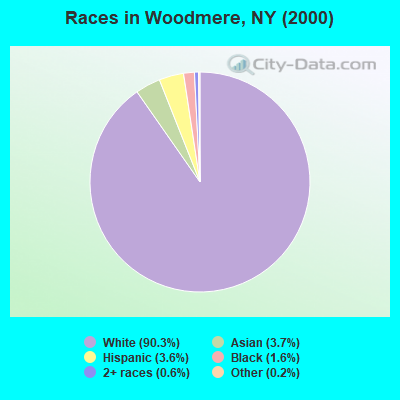
Race distribution in Woodmere
2000 2022
11,760,981 62.0% White alone 2,867,583 15.1% Hispanic 2,812,623 14.8% Black alone 1,035,926 5.5% Asian alone 366,116 1.9% Two or more races 75,499 0.4% Other race alone 52,499 0.3% American Indian alone 5,230 0.03% Native Hawaiian and Other
10,408,933 52.9% White alone 3,867,299 19.7% Hispanic 2,633,840 13.4% Black alone 1,776,286 9.0% Asian alone 732,670 3.7% Two or more races 216,110 1.1% Other race alone 35,082 0.2% American Indian alone 6,931 0.04% Native Hawaiian and Other
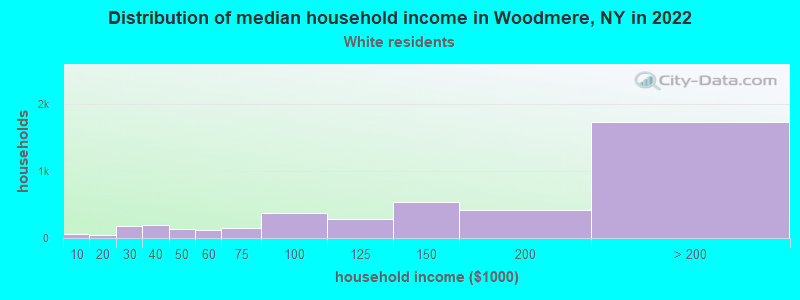
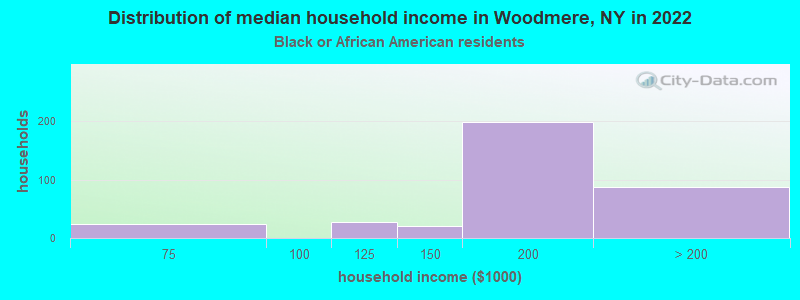
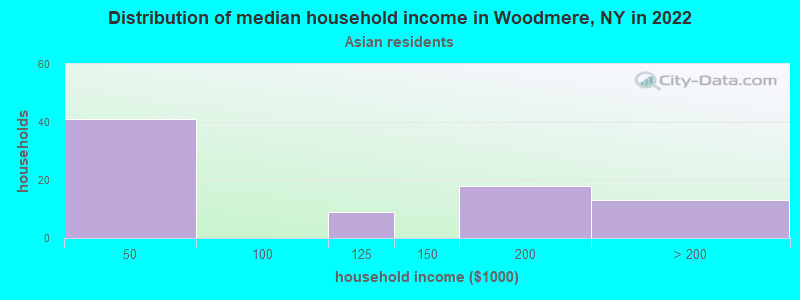
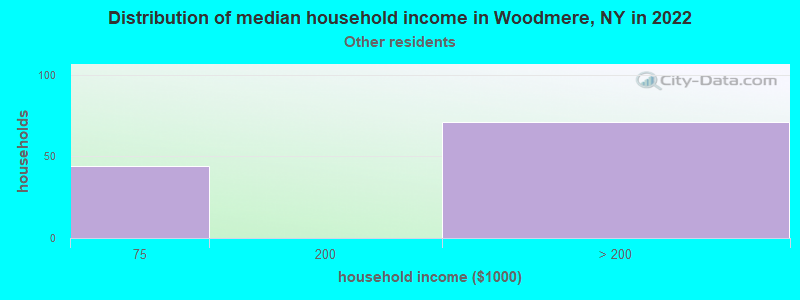
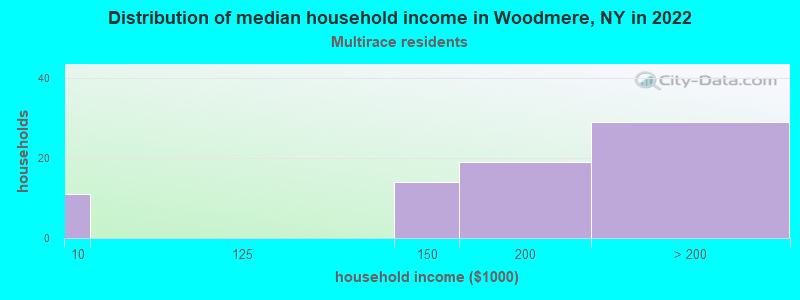
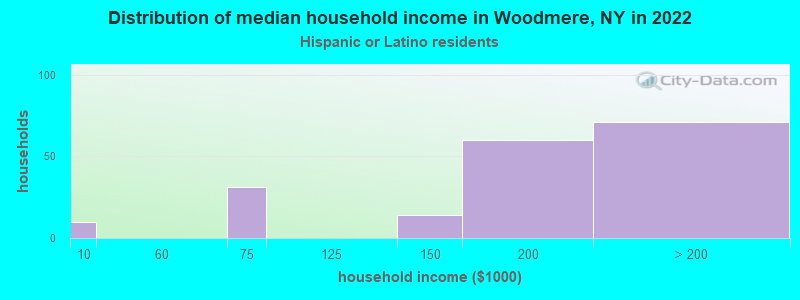
Income and house value in Woodmere Median household income in 2022 $151,985 White non-Hispanic householders$191,563 Black householders$160,660 Hispanic or Latino race householdersMedian 2022 house value $921,317 White Non-Hispanic householders$845,546 Black or African American householders $859,673 Asian householders$898,971 Some other race householders$445,889 Two or more races householders$824,998 Hispanic or Latino householders
Median age by race in Woodmere
34.4 Median age for White residents35.6 33.5 57.0 Median age for Black or African American residents62.1 55.3 -855,158,729.3 Median age for American Indian / Alaska Native residents-607,543,322.5 -837,121,211.3 69.9 Median age for Asian residents74.1 69.1 -487,992,314.6 Median age for Native Hawaiian / Pacific Islander residents-477,502,295.2 -497,387,669.3 28.5 Median age for Other race residents43.3 27.2 12.0 Median age for Two or more races residents8.4 31.9 33.5 Median age for White alone residents34.3 32.7 27.6 Median age for Hispanic or Latino residents20.3 39.6
Owner/renter occupied households by race in Woodmere
House owners and renters - White residents 3,837 91.3% Owner occupied367 8.7% Renter occupiedHouse owners and renters - Black or African American residents 319 97.9% Owner occupied7 2.1% Renter occupiedHouse owners and renters - Asian residents 82 100.0% Owner occupiedHouse owners and renters - Other race residents 21 22.5% Owner occupied74 77.5% Renter occupiedHouse owners and renters - Two or more races residents 32 42.6% Owner occupied44 57.4% Renter occupiedHouse owners and renters - White alone residents 3,893 90.8% Owner occupied395 9.2% Renter occupiedHouse owners and renters - Hispanic or Latino residents 115 59.8% Owner occupied77 40.2% Renter occupied
Language usage in Woodmere
English speakers - Total 80.9% of residents of Woodmere speak English at home.
2.8% of residents speak Spanish at home 116 25.3% Speak English very well342 74.7% Speak English less than very well16.1% of residents speak other language at home 2,251 85.2% Speak English very well392 14.8% Speak English less than very well
English speakers - Born in the United States 89.4% of residents of Woodmere speak English at home.
8.5% of residents speak other language at home 85 100.0% Speak English very well
English speakers - Native, born elsewhere 69.8% of residents of Woodmere speak English at home.
28.1% of residents speak Spanish at home 4 5.0% Speak English very well76 95.0% Speak English less than very well
English speakers - Foreign-born 30.3% of residents of Woodmere speak English at home.
16.2% of residents speak Spanish at home 81 23.5% Speak English very well263 76.5% Speak English less than very well54.8% of residents speak other language at home 816 70.1% Speak English very well348 29.9% Speak English less than very well
White (Caucasian) - Speak only English Native:
90.4% (11,025)Foreign-born:
23.8% (224)
White (Caucasian) - Speak another language Native:
8.9% (1,080)Foreign-born:
75.0% (705)
Black or African American - Speak only English Native:
93.7% (482)Foreign-born:
88.6% (328)
Black or African American - Speak another language Native:
6.0% (31)Foreign-born:
10.6% (39)
Asian - Speak another language Native:
96.6% (3)Foreign-born:
44.7% (59)
Other race - Speak only English Native:
65.9% (107)Foreign-born:
2.1% (8)
Other race - Speak another language Native:
38.1% (62)Foreign-born:
99.5% (357)
Two or more races - Speak only English Native:
90.5% (858)Foreign-born:
89.0% (17)
White alone - Speak only English Native:
89.6% (10,993)Foreign-born:
20.0% (238)
White alone - Speak another language Native:
9.9% (1,215)Foreign-born:
80.3% (957)
Hispanic or Latino - Speak another language Native:
27.8% (139)Foreign-born:
100.0% (362)
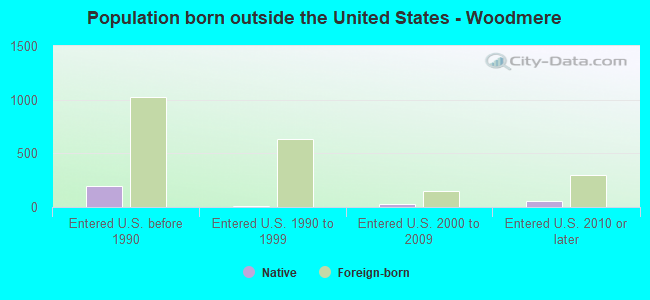
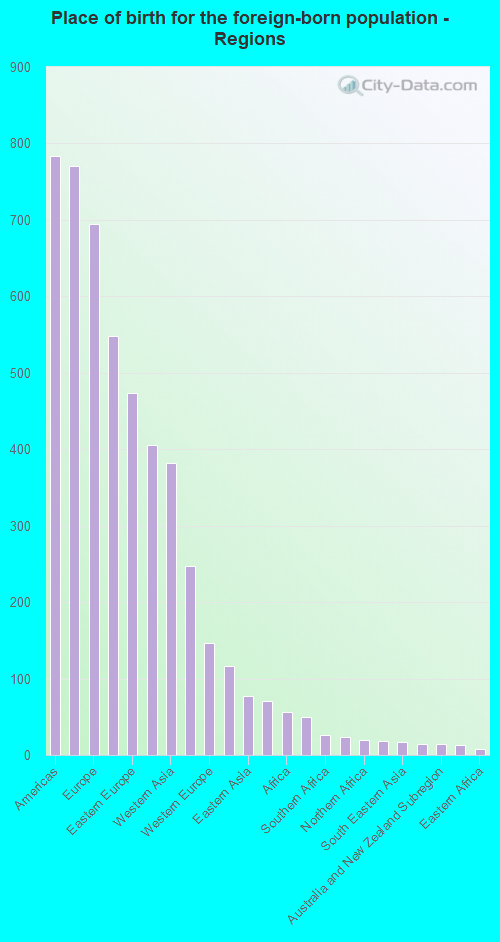
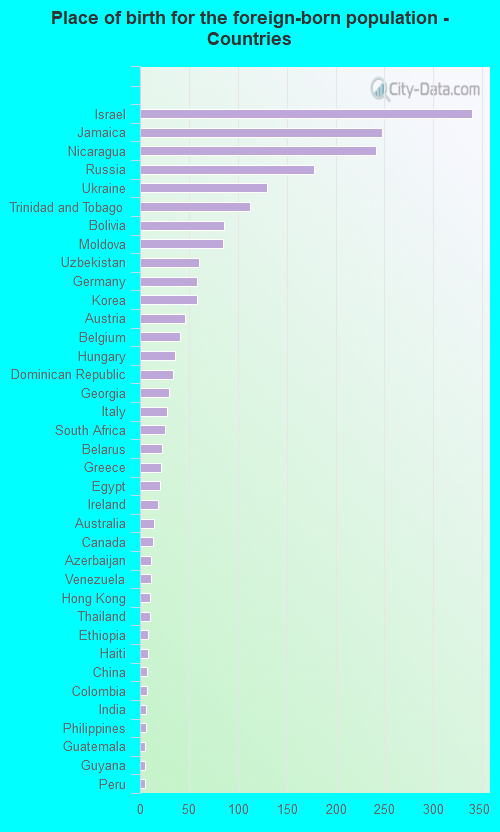
Foreign-born residents in Woodmere 2,099 residents are foreign born (4.4% Latin America , 4.0% Europe , 3.1% Asia ).
This city:
12.0%New York:
22.6%
Marital status for residents in Woodmere Marital status - White (Caucasian) population 15 years and over
Males 27.9% Never married66.3% Now married0.6% Separated2.4% Widowed2.8% DivorcedFemales 28.4% Never married58.5% Now married0.0% Separated10.0% Widowed3.0% DivorcedWomen who gave birth in the past 12 months Now married:
100.0% (173)Unmarried:
0.0% (0)
Women who did not give birth in the past 12 months Now married:
51.2% (1,327)Unmarried:
48.8% (1,264)
Marital status - Black or African American population 15 years and over
Males 23.0% Never married66.3% Now married0.0% Separated4.7% Widowed6.1% DivorcedFemales 37.0% Never married48.4% Now married0.0% Separated9.9% Widowed4.8% DivorcedWomen who did not give birth in the past 12 months Now married:
29.7% (55)Unmarried:
70.3% (129)
Marital status - Asian population 15 years and over
Males 20.0% Never married74.3% Now married0.0% Separated0.0% Widowed5.7% DivorcedFemales 48.1% Never married51.9% Now married0.0% Separated0.0% Widowed0.0% DivorcedWomen who did not give birth in the past 12 months Now married:
0.0% (0)Unmarried:
100.0% (6)
Marital status - Other race population 15 years and over
Males 25.9% Never married69.5% Now married0.5% Separated4.1% Widowed0.0% DivorcedFemales 61.6% Never married38.4% Now married0.0% Separated0.0% Widowed0.0% DivorcedWomen who gave birth in the past 12 months Now married:
0.0% (0)Unmarried:
100.0% (40)
Women who did not give birth in the past 12 months Now married:
10.3% (11)Unmarried:
89.7% (99)
Marital status - Two or more races population 15 years and over
Males 0.0% Never married59.1% Now married0.0% Separated0.0% Widowed40.9% DivorcedFemales 47.1% Never married34.8% Now married0.5% Separated0.0% Widowed17.6% DivorcedWomen who did not give birth in the past 12 months Now married:
39.8% (112)Unmarried:
60.2% (169)
Marital status - White alone, not Hispanic / Latino population 15 years and over
Males 28.4% Never married66.6% Now married0.6% Separated1.4% Widowed2.9% DivorcedFemales 28.7% Never married59.0% Now married0.0% Separated10.1% Widowed2.2% DivorcedWomen who gave birth in the past 12 months Now married:
100.0% (185)Unmarried:
0.0% (0)
Women who did not give birth in the past 12 months Now married:
51.1% (1,410)Unmarried:
48.9% (1,350)
Marital status - Hispanic or Latino population 15 years and over
Males 14.0% Never married66.7% Now married0.3% Separated16.2% Widowed2.8% DivorcedFemales 53.9% Never married27.1% Now married0.0% Separated0.0% Widowed18.9% DivorcedWomen who gave birth in the past 12 months Now married:
0.0% (0)Unmarried:
100.0% (35)
Women who did not give birth in the past 12 months Now married:
7.6% (8)Unmarried:
92.4% (96)
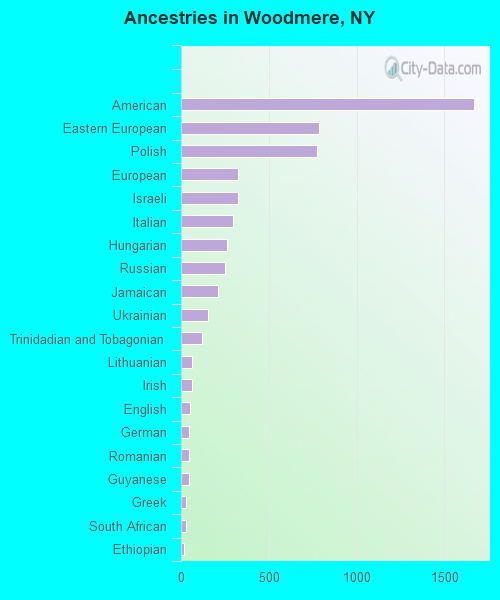
Ancestries in Woodmere
1,670 19.8% American785 9.3% Eastern European775 9.2% Polish327 3.9% European324 3.9% Israeli298 3.5% Italian261 3.1% Hungarian253 3.0% Russian212 2.5% Jamaican156 1.9% Ukrainian117 1.4% Trinidadian and Tobagonian63 0.7% Lithuanian62 0.7% Irish53 0.6% English45 0.5% German45 0.5% Romanian44 0.5% Guyanese28 0.3% Greek27 0.3% South African17 0.2% Ethiopian15 0.2% Haitian10 0.1% Czechoslovakian6 0.07% Iranian3 0.04% Belgian2 0.02% Egyptian
Children Nativity (place of birth) in Woodmere
Children under 6 years - Living with two parents Both parents native 1,274 100.0% NativeBoth parents foreign-born 16 100.0% NativeOne native, one foreign-born parent 17 100.0% NativeChildren under 6 years - Living with one parent Native parent 95 100.0% NativeForeign-born parent 23 23.1% Native78 76.9% Foreign-bornChildren 6 to 17 years - Living with two parents Both parents native 2,837 100.0% NativeBoth parents foreign-born 146 100.0% NativeOne native, one foreign-born parent 764 100.0% NativeChildren 6 to 17 years - Living with one parent Native parent 374 100.0% NativeForeign-born parent 59 69.6% Native26 30.4% Foreign-born
Grandparents responsible for own grandchildren in Woodmere
Grandparents (30 to 59 years) Other race 83 100.0% Not responsible for grandchildrenTwo or more races 24 100.0% Not responsible for grandchildrenHispanic or Latino 58 100.0% Not responsible for grandchildren
Grandparents (60 years and over)