Races in West Wendover, Nevada (NV) Detailed Stats
Data:
Races - White alone (%)
Races - White alone (% change since 2000)
Races - Black alone (%)
Races - Black alone (% change since 2000)
Races - American Indian alone (%)
Races - American Indian alone (% change since 2000)
Races - Asian alone (%)
Races - Asian alone (% change since 2000)
Races - Hispanic (%)
Races - Hispanic (% change since 2000)
Races - Native Hawaiian and Other Pacific Islander alone (%)
Races - Native Hawaiian and Other Pacific Islander alone (% change since 2000)
Races - Two or more races(%)
Races - Two or more races(% change since 2000)
Races - Other race alone (%)
Races - Other race alone (% change since 2000)
Racial diversity
Place of birth - Born in state of residence (%)
Place of birth - Born in state of residence (%) - White
Place of birth - Born in state of residence (%) - Black or African American
Place of birth - Born in state of residence (%) - Asian
Place of birth - Born in state of residence (%) - Hispanic or Latino
Place of birth - Born in state of residence (%) - American Indian and Alaska Native
Place of birth - Born in state of residence (%) - Multirace
Place of birth - Born in state of residence (%) - Other Race
Place of birth - Born in other state (%)
Place of birth - Born in other state (%) - White
Place of birth - Born in other state (%) - Black or African American
Place of birth - Born in other state (%) - Asian
Place of birth - Born in other state (%) - Hispanic or Latino
Place of birth - Born in other state (%) - American Indian and Alaska Native
Place of birth - Born in other state (%) - Multirace
Place of birth - Born in other state (%) - Other Race
Place of birth - Native, outside of US (%)
Place of birth - Native, outside of US (%) - White
Place of birth - Native, outside of US (%) - Black or African American
Place of birth - Native, outside of US (%) - Asian
Place of birth - Native, outside of US (%) - Hispanic or Latino
Place of birth - Native, outside of US (%) - American Indian and Alaska Native
Place of birth - Native, outside of US (%) - Multirace
Place of birth - Native, outside of US (%) - Other Race
Place of birth - Foreign born (%)
Place of birth - Foreign born (%) - White
Place of birth - Foreign born (%) - Black or African American
Place of birth - Foreign born (%) - Asian
Place of birth - Foreign born (%) - Hispanic or Latino
Place of birth - Foreign born (%) - American Indian and Alaska Native
Place of birth - Foreign born (%) - Multirace
Place of birth - Foreign born (%) - Other Race
Residents speaking English at home (%)
Residents speaking English at home - Born in the United States (%)
Residents speaking English at home - Native, born elsewhere (%)
Residents speaking English at home - Foreign born (%)
Residents speaking Spanish at home (%)
Residents speaking Spanish at home - Born in the United States (%)
Residents speaking Spanish at home - Native, born elsewhere (%)
Residents speaking Spanish at home - Foreign born (%)
Residents speaking other language at home (%)
Residents speaking other language at home - Born in the United States (%)
Residents speaking other language at home - Native, born elsewhere (%)
Residents speaking other language at home - Foreign born (%)
Marital status - Never married (%)
Marital status - Now married (%)
Marital status - Separated (%)
Marital status - Widowed (%)
Marital status - Divorced (%)
Ancestries Reported - Arab (%)
Ancestries Reported - Czech (%)
Ancestries Reported - Danish (%)
Ancestries Reported - Dutch (%)
Ancestries Reported - English (%)
Ancestries Reported - French (%)
Ancestries Reported - French Canadian (%)
Ancestries Reported - German (%)
Ancestries Reported - Greek (%)
Ancestries Reported - Hungarian (%)
Ancestries Reported - Irish (%)
Ancestries Reported - Italian (%)
Ancestries Reported - Lithuanian (%)
Ancestries Reported - Norwegian (%)
Ancestries Reported - Polish (%)
Ancestries Reported - Portuguese (%)
Ancestries Reported - Russian (%)
Ancestries Reported - Scotch-Irish (%)
Ancestries Reported - Scottish (%)
Ancestries Reported - Slovak (%)
Ancestries Reported - Subsaharan African (%)
Ancestries Reported - Swedish (%)
Ancestries Reported - Swiss (%)
Ancestries Reported - Ukrainian (%)
Ancestries Reported - United States (%)
Ancestries Reported - Welsh (%)
Ancestries Reported - West Indian (%)
Ancestries Reported - Other (%)
Geographical mobility - Same house 1 year ago (%)
Geographical mobility - Same house 1 year ago (%) - White
Geographical mobility - Same house 1 year ago (%) - Black or African American
Geographical mobility - Same house 1 year ago (%) - Asian
Geographical mobility - Same house 1 year ago (%) - Hispanic or Latino
Geographical mobility - Same house 1 year ago (%) - American Indian and Alaska Native
Geographical mobility - Same house 1 year ago (%) - Multirace
Geographical mobility - Same house 1 year ago (%) - Other Race
Geographical mobility - Moved within same county (%)
Geographical mobility - Moved within same county (%) - White
Geographical mobility - Moved within same county (%) - Black or African American
Geographical mobility - Moved within same county (%) - Asian
Geographical mobility - Moved within same county (%) - Hispanic or Latino
Geographical mobility - Moved within same county (%) - American Indian and Alaska Native
Geographical mobility - Moved within same county (%) - Multirace
Geographical mobility - Moved within same county (%) - Other Race
Geographical mobility - Moved from different county within same state (%)
Geographical mobility - Moved from different county within same state (%) - White
Geographical mobility - Moved from different county within same state (%) - Black or African American
Geographical mobility - Moved from different county within same state (%) - Asian
Geographical mobility - Moved from different county within same state (%) - Hispanic or Latino
Geographical mobility - Moved from different county within same state (%) - American Indian and Alaska Native
Geographical mobility - Moved from different county within same state (%) - Multirace
Geographical mobility - Moved from different county within same state (%) - Other Race
Geographical mobility - Moved from different state (%)
Geographical mobility - Moved from different state (%) - White
Geographical mobility - Moved from different state (%) - Black or African American
Geographical mobility - Moved from different state (%) - Asian
Geographical mobility - Moved from different state (%) - Hispanic or Latino
Geographical mobility - Moved from different state (%) - American Indian and Alaska Native
Geographical mobility - Moved from different state (%) - Multirace
Geographical mobility - Moved from different state (%) - Other Race
Geographical mobility - Moved from abroad (%)
Geographical mobility - Moved from abroad (%) - White
Geographical mobility - Moved from abroad (%) - Black or African American
Geographical mobility - Moved from abroad (%) - Asian
Geographical mobility - Moved from abroad (%) - Hispanic or Latino
Geographical mobility - Moved from abroad (%) - American Indian and Alaska Native
Geographical mobility - Moved from abroad (%) - Multirace
Geographical mobility - Moved from abroad (%) - Other Race
Place of birth for the foreign-born population - Ireland (%)
Place of birth for the foreign-born population - Denmark (%)
Place of birth for the foreign-born population - Norway (%)
Place of birth for the foreign-born population - Sweden (%)
Place of birth for the foreign-born population - United Kingdom (%)
Place of birth for the foreign-born population - England (%)
Place of birth for the foreign-born population - Scotland (%)
Place of birth for the foreign-born population - Other Northern Europe (%)
Place of birth for the foreign-born population - Austria (%)
Place of birth for the foreign-born population - Belgium (%)
Place of birth for the foreign-born population - France (%)
Place of birth for the foreign-born population - Germany (%)
Place of birth for the foreign-born population - Netherlands (%)
Place of birth for the foreign-born population - Switzerland (%)
Place of birth for the foreign-born population - Other Western Europe (%)
Place of birth for the foreign-born population - Greece (%)
Place of birth for the foreign-born population - Italy (%)
Place of birth for the foreign-born population - Portugal (%)
Place of birth for the foreign-born population - Spain (%)
Place of birth for the foreign-born population - Other Southern Europe (%)
Place of birth for the foreign-born population - Albania (%)
Place of birth for the foreign-born population - Belarus (%)
Place of birth for the foreign-born population - Bosnia and Herzegovina (%)
Place of birth for the foreign-born population - Bulgaria (%)
Place of birth for the foreign-born population - Croatia (%)
Place of birth for the foreign-born population - Czechoslovakia (%)
Place of birth for the foreign-born population - Hungary (%)
Place of birth for the foreign-born population - Latvia (%)
Place of birth for the foreign-born population - Lithuania (%)
Place of birth for the foreign-born population - North Macedonia (Macedonia) (%)
Place of birth for the foreign-born population - Moldova (%)
Place of birth for the foreign-born population - Poland (%)
Place of birth for the foreign-born population - Romania (%)
Place of birth for the foreign-born population - Russia (%)
Place of birth for the foreign-born population - Serbia (%)
Place of birth for the foreign-born population - Ukraine (%)
Place of birth for the foreign-born population - Other Eastern Europe (%)
Place of birth for the foreign-born population - China (%)
Place of birth for the foreign-born population - Hong Kong (%)
Place of birth for the foreign-born population - Taiwan (%)
Place of birth for the foreign-born population - Japan (%)
Place of birth for the foreign-born population - Korea (%)
Place of birth for the foreign-born population - Other Eastern Asia (%)
Place of birth for the foreign-born population - Afghanistan (%)
Place of birth for the foreign-born population - Bangladesh (%)
Place of birth for the foreign-born population - India (%)
Place of birth for the foreign-born population - Iran (%)
Place of birth for the foreign-born population - Kazakhstan (%)
Place of birth for the foreign-born population - Nepal (%)
Place of birth for the foreign-born population - Pakistan (%)
Place of birth for the foreign-born population - Sri Lanka (%)
Place of birth for the foreign-born population - Uzbekistan (%)
Place of birth for the foreign-born population - Other South Central Asia (%)
Place of birth for the foreign-born population - Burma (%)
Place of birth for the foreign-born population - Cambodia (%)
Place of birth for the foreign-born population - Indonesia (%)
Place of birth for the foreign-born population - Laos (%)
Place of birth for the foreign-born population - Malaysia (%)
Place of birth for the foreign-born population - Philippines (%)
Place of birth for the foreign-born population - Singapore (%)
Place of birth for the foreign-born population - Thailand (%)
Place of birth for the foreign-born population - Vietnam (%)
Place of birth for the foreign-born population - Other South Eastern Asia (%)
Place of birth for the foreign-born population - Armenia (%)
Place of birth for the foreign-born population - Iraq (%)
Place of birth for the foreign-born population - Israel (%)
Place of birth for the foreign-born population - Jordan (%)
Place of birth for the foreign-born population - Kuwait (%)
Place of birth for the foreign-born population - Lebanon (%)
Place of birth for the foreign-born population - Saudi Arabia (%)
Place of birth for the foreign-born population - Syria (%)
Place of birth for the foreign-born population - Turkey (%)
Place of birth for the foreign-born population - Yemen (%)
Place of birth for the foreign-born population - Other Western Asia (%)
Place of birth for the foreign-born population - Eritrea (%)
Place of birth for the foreign-born population - Ethiopia (%)
Place of birth for the foreign-born population - Kenya (%)
Place of birth for the foreign-born population - Somalia (%)
Place of birth for the foreign-born population - Uganda (%)
Place of birth for the foreign-born population - Zimbabwe (%)
Place of birth for the foreign-born population - Other Eastern Africa (%)
Place of birth for the foreign-born population - Cameroon (%)
Place of birth for the foreign-born population - Congo (%)
Place of birth for the foreign-born population - Democratic Republic of Congo (Zaire) (%)
Place of birth for the foreign-born population - Other Middle Africa (%)
Place of birth for the foreign-born population - Egypt (%)
Place of birth for the foreign-born population - Morocco (%)
Place of birth for the foreign-born population - Sudan (%)
Place of birth for the foreign-born population - Other Northern Africa (%)
Place of birth for the foreign-born population - South Africa (%)
Place of birth for the foreign-born population - Other Southern Africa (%)
Place of birth for the foreign-born population - Cabo Verde (%)
Place of birth for the foreign-born population - Ghana (%)
Place of birth for the foreign-born population - Liberia (%)
Place of birth for the foreign-born population - Nigeria (%)
Place of birth for the foreign-born population - Senegal (%)
Place of birth for the foreign-born population - Sierra Leone (%)
Place of birth for the foreign-born population - Other Western Africa (%)
Place of birth for the foreign-born population - Australia (%)
Place of birth for the foreign-born population - New Zealand (%)
Place of birth for the foreign-born population - Fiji (%)
Place of birth for the foreign-born population - Micronesia (%)
Place of birth for the foreign-born population - Bahamas (%)
Place of birth for the foreign-born population - Barbados (%)
Place of birth for the foreign-born population - Cuba (%)
Place of birth for the foreign-born population - Dominica (%)
Place of birth for the foreign-born population - Dominican Republic (%)
Place of birth for the foreign-born population - Grenada (%)
Place of birth for the foreign-born population - Haiti (%)
Place of birth for the foreign-born population - Jamaica (%)
Place of birth for the foreign-born population - St. Vincent and the Grenadines (%)
Place of birth for the foreign-born population - Trinidad and Tobago (%)
Place of birth for the foreign-born population - West Indies (%)
Place of birth for the foreign-born population - Other Caribbean (%)
Place of birth for the foreign-born population - Belize (%)
Place of birth for the foreign-born population - Costa Rica (%)
Place of birth for the foreign-born population - El Salvador (%)
Place of birth for the foreign-born population - Guatemala (%)
Place of birth for the foreign-born population - Honduras (%)
Place of birth for the foreign-born population - Mexico (%)
Place of birth for the foreign-born population - Nicaragua (%)
Place of birth for the foreign-born population - Panama (%)
Place of birth for the foreign-born population - Other Central America (%)
Place of birth for the foreign-born population - Argentina (%)
Place of birth for the foreign-born population - Bolivia (%)
Place of birth for the foreign-born population - Brazil (%)
Place of birth for the foreign-born population - Chile (%)
Place of birth for the foreign-born population - Colombia (%)
Place of birth for the foreign-born population - Ecuador (%)
Place of birth for the foreign-born population - Guyana (%)
Place of birth for the foreign-born population - Peru (%)
Place of birth for the foreign-born population - Uruguay (%)
Place of birth for the foreign-born population - Venezuela (%)
Place of birth for the foreign-born population - Other South America (%)
Place of birth for the foreign-born population - Canada (%)
Place of birth for the foreign-born population - Other Northern America (%)
Place of birth for the foreign-born population - Other (%)
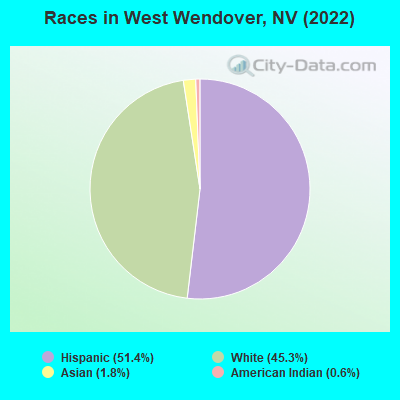
According to 2022 data, the most numerous races in West Wendover, NV are White alone (2,091 residents), Hispanic (2,373 residents), and Black alone (0 residents). 32.8% of West Wendover residents speak English at home. 18.6% of West Wendover, NV residents are foreign-born (17.1% born in Latin America), which is 3.1% greater than the foreign-born rate of 18.0% across the entire state of Nevada.
Race distribution in West Wendover
2000 2022
1,303,001 65.2% White alone 393,970 19.7% Hispanic 131,509 6.6% Black alone 88,593 4.4% Asian alone 49,231 2.5% Two or more races 21,397 1.1% American Indian alone 7,769 0.4% Native Hawaiian and Other 2,787 0.1% Other race alone
1,410,145 44.4% White alone 961,357 30.3% Hispanic 286,471 9.0% Black alone 281,149 8.8% Asian alone 182,151 5.7% Two or more races 20,102 0.6% Native Hawaiian and Other 18,781 0.6% Other race alone 17,616 0.6% American Indian alone
Income and house value in West Wendover Median household income in 2022 $80,095 White non-Hispanic householders$43,947 Hispanic or Latino race householdersMedian 2022 house value $484,850 White Non-Hispanic householders$385,242 Some other race householders$472,356 Two or more races householders$400,513 Hispanic or Latino householders
Median age by race in West Wendover
34.9 Median age for White residents40.2 17.6 -676,557,862.8 Median age for Black or African American residents-676,798,378.2 -676,356,588.5 -659,259,258.6 Median age for American Indian / Alaska Native residents-660,984,847.8 -648,550,724.0 -666,666,666.0 Median age for Asian residents-656,814,449.3 -665,191,739.7 -690,618,761.8 Median age for Native Hawaiian / Pacific Islander residents-648,090,814.6 -725,146,198.1 32.2 Median age for Other race residents17.0 55.0 38.9 Median age for Two or more races residents40.9 31.5 38.5 Median age for White alone residents38.8 33.7 31.4 Median age for Hispanic or Latino residents37.6 24.0
Owner/renter occupied households by race in West Wendover
House owners and renters - White residents 377 39.4% Owner occupied581 60.6% Renter occupiedHouse owners and renters - American Indian / Alaska Native residents 39 100.0% Owner occupiedHouse owners and renters - Other race residents 68 100.0% Owner occupiedHouse owners and renters - Two or more races residents 386 43.4% Owner occupied503 56.6% Renter occupiedHouse owners and renters - White alone residents 300 34.0% Owner occupied582 66.0% Renter occupiedHouse owners and renters - Hispanic or Latino residents 435 51.0% Owner occupied418 49.0% Renter occupied
Language usage in West Wendover
English speakers - Total 32.8% of residents of West Wendover speak English at home.
48.4% of residents speak Spanish at home 1,689 83.4% Speak English very well337 16.6% Speak English less than very well19.1% of residents speak other language at home 723 90.7% Speak English very well74 9.3% Speak English less than very well
English speakers - Born in the United States 45.5% of residents of West Wendover speak English at home.
37.7% of residents speak Spanish at home 966 96.9% Speak English very well31 3.1% Speak English less than very well15.5% of residents speak other language at home 409 100.0% Speak English very well
English speakers - Foreign-born 0.0% of residents of West Wendover speak English at home.
92.8% of residents speak Spanish at home 452 59.9% Speak English very well303 40.1% Speak English less than very well9.0% of residents speak other language at home 73 100.0% Speak English less than very well
White (Caucasian) - Speak another language Native:
36.6% (849)Foreign-born:
86.7% (70)
Other race - Speak another language Native:
100.0% (159)Foreign-born:
100.0% (129)
Two or more races - Speak another language Native:
94.6% (820)Foreign-born:
100.0% (767)
Hispanic or Latino - Speak another language Native:
90.4% (1,285)Foreign-born:
100.0% (747)
Foreign-born residents in West Wendover 858 residents are foreign born (17.1% Latin America ).
This city:
18.6%Nevada:
19.1%
Marital status for residents in West Wendover Marital status - White (Caucasian) population 15 years and over
Males 15.0% Never married78.7% Now married0.0% Separated2.4% Widowed3.9% DivorcedFemales 21.1% Never married74.9% Now married0.0% Separated0.0% Widowed4.0% DivorcedWomen who gave birth in the past 12 months Now married:
0.0% (0)Unmarried:
100.0% (43)
Women who did not give birth in the past 12 months Now married:
74.2% (385)Unmarried:
25.8% (134)
Marital status - Other race population 15 years and over
Males 44.1% Never married55.9% Now married0.0% Separated0.0% Widowed0.0% DivorcedFemales 0.0% Never married44.4% Now married0.0% Separated55.6% Widowed0.0% DivorcedWomen who gave birth in the past 12 months Now married:
100.0% (34)Unmarried:
0.0% (0)
Marital status - Two or more races population 15 years and over
Males 0.0% Never married42.2% Now married0.0% Separated0.0% Widowed57.8% DivorcedFemales 58.7% Never married24.4% Now married16.9% Separated0.0% Widowed0.0% DivorcedWomen who did not give birth in the past 12 months Now married:
22.4% (130)Unmarried:
77.6% (453)
Marital status - White alone, not Hispanic / Latino population 15 years and over
Males 16.4% Never married76.8% Now married0.0% Separated2.7% Widowed4.2% DivorcedFemales 5.4% Never married89.1% Now married0.0% Separated0.0% Widowed5.5% DivorcedWomen who did not give birth in the past 12 months Now married:
84.8% (340)Unmarried:
15.2% (61)
Marital status - Hispanic or Latino population 15 years and over
Males 6.9% Never married51.4% Now married0.0% Separated0.0% Widowed41.8% DivorcedFemales 51.2% Never married30.8% Now married10.3% Separated7.8% Widowed0.0% DivorcedWomen who gave birth in the past 12 months Now married:
38.8% (33)Unmarried:
61.2% (51)
Women who did not give birth in the past 12 months Now married:
30.5% (190)Unmarried:
69.5% (434)
Ancestries in West Wendover
215 13.8% European78 5.0% Norwegian59 3.8% German44 2.8% American41 2.6% Eastern European29 1.9% Irish
Geographical mobility in West Wendover Same house 1 year ago 2,688 100.0% White (Caucasian)43 100.0% American Indian / Alaska Native84 100.0% Asian343 100.0% Other race1,645 100.0% Two or more races2,119 100.0% White alone, not Hispanic / Latino2,417 100.0% Hispanic or Latino
Children Nativity (place of birth) in West Wendover
Children under 6 years - Living with two parents Both parents native 262 100.0% NativeBoth parents foreign-born 36 100.0% NativeOne native, one foreign-born parent 39 100.0% NativeChildren under 6 years - Living with one parent Native parent 159 100.0% NativeChildren 6 to 17 years - Living with two parents Both parents native 397 100.0% NativeBoth parents foreign-born 144 100.0% NativeOne native, one foreign-born parent 145 100.0% NativeChildren 6 to 17 years - Living with one parent Native parent 47 100.0% NativeForeign-born parent 72 50.0% Native72 50.0% Foreign-born
Place of birth for residents in West Wendover 783 Americas783 Latin America783 Central America75 Asia75 South Eastern Asia
Grandparents responsible for own grandchildren in West Wendover
Grandparents (30 to 59 years) Two or more races 39 100.0% Responsible for grandchildrenHispanic or Latino 71 100.0% Responsible for grandchildren
Grandparents (60 years and over) Hispanic or Latino 81 100.0% Not responsible for grandchildren