Races in West Springfield, Virginia (VA) Detailed Stats
Data:
Races - White alone (%)
Races - White alone (% change since 2000)
Races - Black alone (%)
Races - Black alone (% change since 2000)
Races - American Indian alone (%)
Races - American Indian alone (% change since 2000)
Races - Asian alone (%)
Races - Asian alone (% change since 2000)
Races - Hispanic (%)
Races - Hispanic (% change since 2000)
Races - Native Hawaiian and Other Pacific Islander alone (%)
Races - Native Hawaiian and Other Pacific Islander alone (% change since 2000)
Races - Two or more races(%)
Races - Two or more races(% change since 2000)
Races - Other race alone (%)
Races - Other race alone (% change since 2000)
Racial diversity
Place of birth - Born in state of residence (%)
Place of birth - Born in state of residence (%) - White
Place of birth - Born in state of residence (%) - Black or African American
Place of birth - Born in state of residence (%) - Asian
Place of birth - Born in state of residence (%) - Hispanic or Latino
Place of birth - Born in state of residence (%) - American Indian and Alaska Native
Place of birth - Born in state of residence (%) - Multirace
Place of birth - Born in state of residence (%) - Other Race
Place of birth - Born in other state (%)
Place of birth - Born in other state (%) - White
Place of birth - Born in other state (%) - Black or African American
Place of birth - Born in other state (%) - Asian
Place of birth - Born in other state (%) - Hispanic or Latino
Place of birth - Born in other state (%) - American Indian and Alaska Native
Place of birth - Born in other state (%) - Multirace
Place of birth - Born in other state (%) - Other Race
Place of birth - Native, outside of US (%)
Place of birth - Native, outside of US (%) - White
Place of birth - Native, outside of US (%) - Black or African American
Place of birth - Native, outside of US (%) - Asian
Place of birth - Native, outside of US (%) - Hispanic or Latino
Place of birth - Native, outside of US (%) - American Indian and Alaska Native
Place of birth - Native, outside of US (%) - Multirace
Place of birth - Native, outside of US (%) - Other Race
Place of birth - Foreign born (%)
Place of birth - Foreign born (%) - White
Place of birth - Foreign born (%) - Black or African American
Place of birth - Foreign born (%) - Asian
Place of birth - Foreign born (%) - Hispanic or Latino
Place of birth - Foreign born (%) - American Indian and Alaska Native
Place of birth - Foreign born (%) - Multirace
Place of birth - Foreign born (%) - Other Race
Residents speaking English at home (%)
Residents speaking English at home - Born in the United States (%)
Residents speaking English at home - Native, born elsewhere (%)
Residents speaking English at home - Foreign born (%)
Residents speaking Spanish at home (%)
Residents speaking Spanish at home - Born in the United States (%)
Residents speaking Spanish at home - Native, born elsewhere (%)
Residents speaking Spanish at home - Foreign born (%)
Residents speaking other language at home (%)
Residents speaking other language at home - Born in the United States (%)
Residents speaking other language at home - Native, born elsewhere (%)
Residents speaking other language at home - Foreign born (%)
Marital status - Never married (%)
Marital status - Now married (%)
Marital status - Separated (%)
Marital status - Widowed (%)
Marital status - Divorced (%)
Ancestries Reported - Arab (%)
Ancestries Reported - Czech (%)
Ancestries Reported - Danish (%)
Ancestries Reported - Dutch (%)
Ancestries Reported - English (%)
Ancestries Reported - French (%)
Ancestries Reported - French Canadian (%)
Ancestries Reported - German (%)
Ancestries Reported - Greek (%)
Ancestries Reported - Hungarian (%)
Ancestries Reported - Irish (%)
Ancestries Reported - Italian (%)
Ancestries Reported - Lithuanian (%)
Ancestries Reported - Norwegian (%)
Ancestries Reported - Polish (%)
Ancestries Reported - Portuguese (%)
Ancestries Reported - Russian (%)
Ancestries Reported - Scotch-Irish (%)
Ancestries Reported - Scottish (%)
Ancestries Reported - Slovak (%)
Ancestries Reported - Subsaharan African (%)
Ancestries Reported - Swedish (%)
Ancestries Reported - Swiss (%)
Ancestries Reported - Ukrainian (%)
Ancestries Reported - United States (%)
Ancestries Reported - Welsh (%)
Ancestries Reported - West Indian (%)
Ancestries Reported - Other (%)
Geographical mobility - Same house 1 year ago (%)
Geographical mobility - Same house 1 year ago (%) - White
Geographical mobility - Same house 1 year ago (%) - Black or African American
Geographical mobility - Same house 1 year ago (%) - Asian
Geographical mobility - Same house 1 year ago (%) - Hispanic or Latino
Geographical mobility - Same house 1 year ago (%) - American Indian and Alaska Native
Geographical mobility - Same house 1 year ago (%) - Multirace
Geographical mobility - Same house 1 year ago (%) - Other Race
Geographical mobility - Moved within same county (%)
Geographical mobility - Moved within same county (%) - White
Geographical mobility - Moved within same county (%) - Black or African American
Geographical mobility - Moved within same county (%) - Asian
Geographical mobility - Moved within same county (%) - Hispanic or Latino
Geographical mobility - Moved within same county (%) - American Indian and Alaska Native
Geographical mobility - Moved within same county (%) - Multirace
Geographical mobility - Moved within same county (%) - Other Race
Geographical mobility - Moved from different county within same state (%)
Geographical mobility - Moved from different county within same state (%) - White
Geographical mobility - Moved from different county within same state (%) - Black or African American
Geographical mobility - Moved from different county within same state (%) - Asian
Geographical mobility - Moved from different county within same state (%) - Hispanic or Latino
Geographical mobility - Moved from different county within same state (%) - American Indian and Alaska Native
Geographical mobility - Moved from different county within same state (%) - Multirace
Geographical mobility - Moved from different county within same state (%) - Other Race
Geographical mobility - Moved from different state (%)
Geographical mobility - Moved from different state (%) - White
Geographical mobility - Moved from different state (%) - Black or African American
Geographical mobility - Moved from different state (%) - Asian
Geographical mobility - Moved from different state (%) - Hispanic or Latino
Geographical mobility - Moved from different state (%) - American Indian and Alaska Native
Geographical mobility - Moved from different state (%) - Multirace
Geographical mobility - Moved from different state (%) - Other Race
Geographical mobility - Moved from abroad (%)
Geographical mobility - Moved from abroad (%) - White
Geographical mobility - Moved from abroad (%) - Black or African American
Geographical mobility - Moved from abroad (%) - Asian
Geographical mobility - Moved from abroad (%) - Hispanic or Latino
Geographical mobility - Moved from abroad (%) - American Indian and Alaska Native
Geographical mobility - Moved from abroad (%) - Multirace
Geographical mobility - Moved from abroad (%) - Other Race
Place of birth for the foreign-born population - Ireland (%)
Place of birth for the foreign-born population - Denmark (%)
Place of birth for the foreign-born population - Norway (%)
Place of birth for the foreign-born population - Sweden (%)
Place of birth for the foreign-born population - United Kingdom (%)
Place of birth for the foreign-born population - England (%)
Place of birth for the foreign-born population - Scotland (%)
Place of birth for the foreign-born population - Other Northern Europe (%)
Place of birth for the foreign-born population - Austria (%)
Place of birth for the foreign-born population - Belgium (%)
Place of birth for the foreign-born population - France (%)
Place of birth for the foreign-born population - Germany (%)
Place of birth for the foreign-born population - Netherlands (%)
Place of birth for the foreign-born population - Switzerland (%)
Place of birth for the foreign-born population - Other Western Europe (%)
Place of birth for the foreign-born population - Greece (%)
Place of birth for the foreign-born population - Italy (%)
Place of birth for the foreign-born population - Portugal (%)
Place of birth for the foreign-born population - Spain (%)
Place of birth for the foreign-born population - Other Southern Europe (%)
Place of birth for the foreign-born population - Albania (%)
Place of birth for the foreign-born population - Belarus (%)
Place of birth for the foreign-born population - Bosnia and Herzegovina (%)
Place of birth for the foreign-born population - Bulgaria (%)
Place of birth for the foreign-born population - Croatia (%)
Place of birth for the foreign-born population - Czechoslovakia (%)
Place of birth for the foreign-born population - Hungary (%)
Place of birth for the foreign-born population - Latvia (%)
Place of birth for the foreign-born population - Lithuania (%)
Place of birth for the foreign-born population - North Macedonia (Macedonia) (%)
Place of birth for the foreign-born population - Moldova (%)
Place of birth for the foreign-born population - Poland (%)
Place of birth for the foreign-born population - Romania (%)
Place of birth for the foreign-born population - Russia (%)
Place of birth for the foreign-born population - Serbia (%)
Place of birth for the foreign-born population - Ukraine (%)
Place of birth for the foreign-born population - Other Eastern Europe (%)
Place of birth for the foreign-born population - China (%)
Place of birth for the foreign-born population - Hong Kong (%)
Place of birth for the foreign-born population - Taiwan (%)
Place of birth for the foreign-born population - Japan (%)
Place of birth for the foreign-born population - Korea (%)
Place of birth for the foreign-born population - Other Eastern Asia (%)
Place of birth for the foreign-born population - Afghanistan (%)
Place of birth for the foreign-born population - Bangladesh (%)
Place of birth for the foreign-born population - India (%)
Place of birth for the foreign-born population - Iran (%)
Place of birth for the foreign-born population - Kazakhstan (%)
Place of birth for the foreign-born population - Nepal (%)
Place of birth for the foreign-born population - Pakistan (%)
Place of birth for the foreign-born population - Sri Lanka (%)
Place of birth for the foreign-born population - Uzbekistan (%)
Place of birth for the foreign-born population - Other South Central Asia (%)
Place of birth for the foreign-born population - Burma (%)
Place of birth for the foreign-born population - Cambodia (%)
Place of birth for the foreign-born population - Indonesia (%)
Place of birth for the foreign-born population - Laos (%)
Place of birth for the foreign-born population - Malaysia (%)
Place of birth for the foreign-born population - Philippines (%)
Place of birth for the foreign-born population - Singapore (%)
Place of birth for the foreign-born population - Thailand (%)
Place of birth for the foreign-born population - Vietnam (%)
Place of birth for the foreign-born population - Other South Eastern Asia (%)
Place of birth for the foreign-born population - Armenia (%)
Place of birth for the foreign-born population - Iraq (%)
Place of birth for the foreign-born population - Israel (%)
Place of birth for the foreign-born population - Jordan (%)
Place of birth for the foreign-born population - Kuwait (%)
Place of birth for the foreign-born population - Lebanon (%)
Place of birth for the foreign-born population - Saudi Arabia (%)
Place of birth for the foreign-born population - Syria (%)
Place of birth for the foreign-born population - Turkey (%)
Place of birth for the foreign-born population - Yemen (%)
Place of birth for the foreign-born population - Other Western Asia (%)
Place of birth for the foreign-born population - Eritrea (%)
Place of birth for the foreign-born population - Ethiopia (%)
Place of birth for the foreign-born population - Kenya (%)
Place of birth for the foreign-born population - Somalia (%)
Place of birth for the foreign-born population - Uganda (%)
Place of birth for the foreign-born population - Zimbabwe (%)
Place of birth for the foreign-born population - Other Eastern Africa (%)
Place of birth for the foreign-born population - Cameroon (%)
Place of birth for the foreign-born population - Congo (%)
Place of birth for the foreign-born population - Democratic Republic of Congo (Zaire) (%)
Place of birth for the foreign-born population - Other Middle Africa (%)
Place of birth for the foreign-born population - Egypt (%)
Place of birth for the foreign-born population - Morocco (%)
Place of birth for the foreign-born population - Sudan (%)
Place of birth for the foreign-born population - Other Northern Africa (%)
Place of birth for the foreign-born population - South Africa (%)
Place of birth for the foreign-born population - Other Southern Africa (%)
Place of birth for the foreign-born population - Cabo Verde (%)
Place of birth for the foreign-born population - Ghana (%)
Place of birth for the foreign-born population - Liberia (%)
Place of birth for the foreign-born population - Nigeria (%)
Place of birth for the foreign-born population - Senegal (%)
Place of birth for the foreign-born population - Sierra Leone (%)
Place of birth for the foreign-born population - Other Western Africa (%)
Place of birth for the foreign-born population - Australia (%)
Place of birth for the foreign-born population - New Zealand (%)
Place of birth for the foreign-born population - Fiji (%)
Place of birth for the foreign-born population - Micronesia (%)
Place of birth for the foreign-born population - Bahamas (%)
Place of birth for the foreign-born population - Barbados (%)
Place of birth for the foreign-born population - Cuba (%)
Place of birth for the foreign-born population - Dominica (%)
Place of birth for the foreign-born population - Dominican Republic (%)
Place of birth for the foreign-born population - Grenada (%)
Place of birth for the foreign-born population - Haiti (%)
Place of birth for the foreign-born population - Jamaica (%)
Place of birth for the foreign-born population - St. Vincent and the Grenadines (%)
Place of birth for the foreign-born population - Trinidad and Tobago (%)
Place of birth for the foreign-born population - West Indies (%)
Place of birth for the foreign-born population - Other Caribbean (%)
Place of birth for the foreign-born population - Belize (%)
Place of birth for the foreign-born population - Costa Rica (%)
Place of birth for the foreign-born population - El Salvador (%)
Place of birth for the foreign-born population - Guatemala (%)
Place of birth for the foreign-born population - Honduras (%)
Place of birth for the foreign-born population - Mexico (%)
Place of birth for the foreign-born population - Nicaragua (%)
Place of birth for the foreign-born population - Panama (%)
Place of birth for the foreign-born population - Other Central America (%)
Place of birth for the foreign-born population - Argentina (%)
Place of birth for the foreign-born population - Bolivia (%)
Place of birth for the foreign-born population - Brazil (%)
Place of birth for the foreign-born population - Chile (%)
Place of birth for the foreign-born population - Colombia (%)
Place of birth for the foreign-born population - Ecuador (%)
Place of birth for the foreign-born population - Guyana (%)
Place of birth for the foreign-born population - Peru (%)
Place of birth for the foreign-born population - Uruguay (%)
Place of birth for the foreign-born population - Venezuela (%)
Place of birth for the foreign-born population - Other South America (%)
Place of birth for the foreign-born population - Canada (%)
Place of birth for the foreign-born population - Other Northern America (%)
Place of birth for the foreign-born population - Other (%)
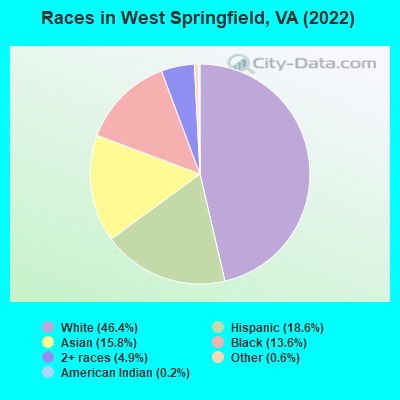
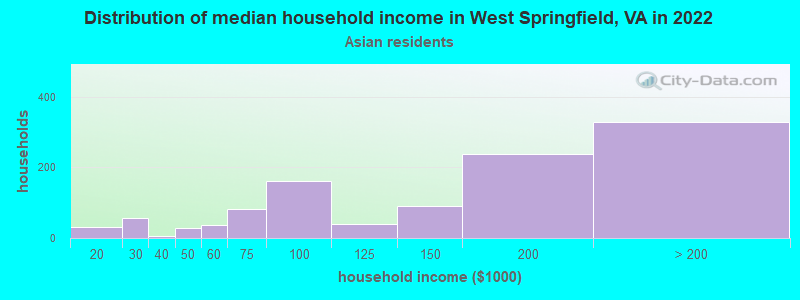
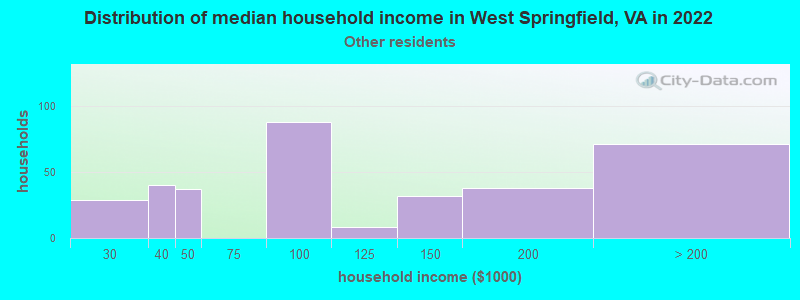
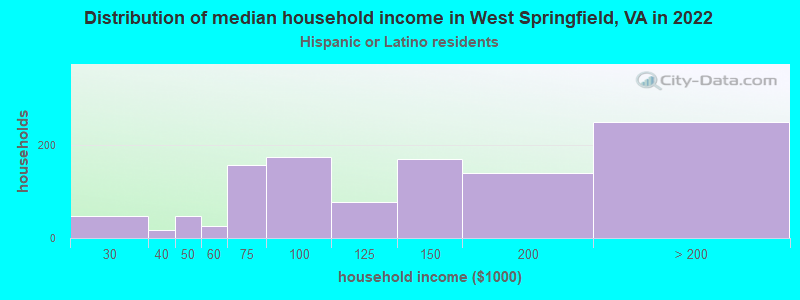
According to 2022 data, the most numerous races in West Springfield, VA are White alone (10,782 residents), Black alone (3,161 residents), and Hispanic (4,319 residents). 63.3% of West Springfield residents speak English at home. 25.5% of West Springfield, VA residents are foreign-born (11.6% born in Asia, 8.0% born in Latin America, 3.2% born in Africa), which is 53.0% greater than the foreign-born rate of 12.0% across the entire state of Virginia.
Race distribution in West Springfield
2000 2022
4,965,637 70.2% White alone 1,376,378 19.4% Black alone 329,540 4.7% Hispanic 259,277 3.7% Asian alone 114,022 1.6% Two or more races 18,596 0.3% American Indian alone 11,685 0.2% Other race alone 3,380 0.05% Native Hawaiian and Other
5,095,130 58.7% White alone 1,594,785 18.4% Black alone 905,750 10.4% Hispanic 602,881 6.9% Asian alone 406,047 4.7% Two or more races 60,419 0.7% Other race alone 11,738 0.1% American Indian alone 6,869 0.08% Native Hawaiian and Other
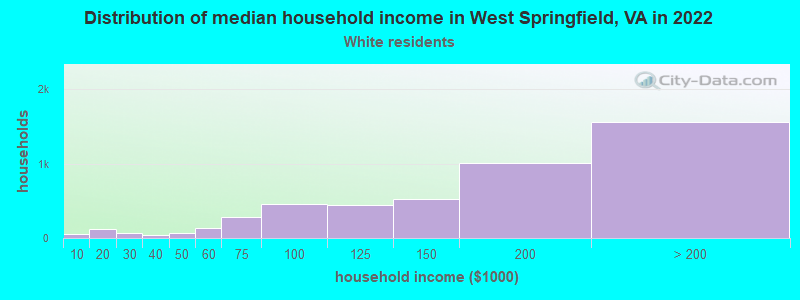
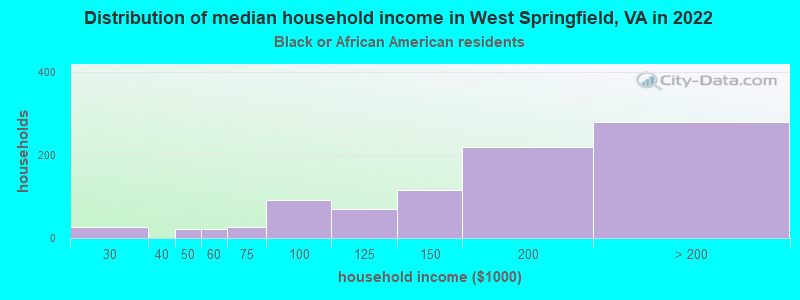
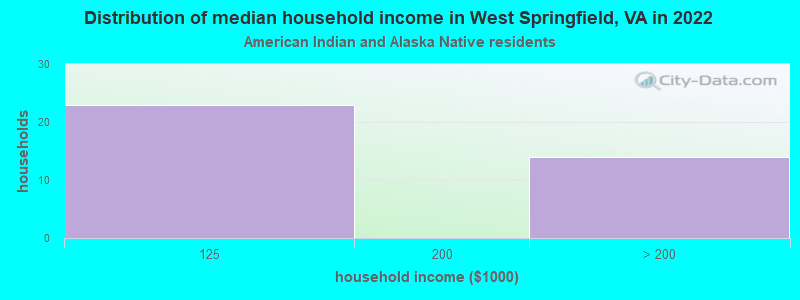
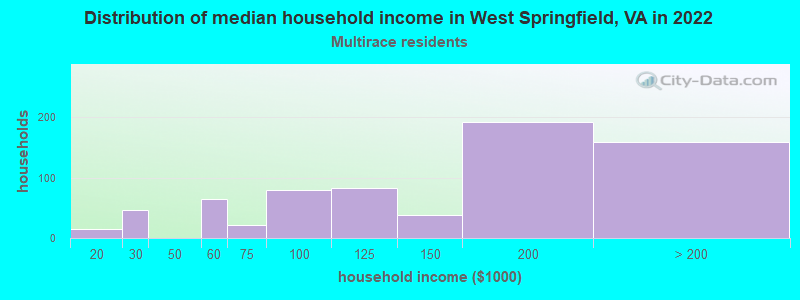
Income and house value in West Springfield Median household income in 2022 $156,328 White non-Hispanic householders$170,554 Black householders$150,038 Asian householders$97,792 Some other race householders$143,207 Two or more races householders$119,649 Hispanic or Latino race householdersMedian 2022 house value $640,989 White Non-Hispanic householders$567,638 Black or African American householders$989,182 American Indian or Alaska Native householders $607,205 Asian householders$545,724 Some other race householders$524,723 Two or more races householders$553,637 Hispanic or Latino householders
Median age by race in West Springfield
45.5 Median age for White residents45.5 45.4 35.1 Median age for Black or African American residents37.5 34.5 43.8 Median age for American Indian / Alaska Native residents56.0 -669,005,847.3 41.8 Median age for Asian residents37.5 46.6 -666,666,666.0 Median age for Native Hawaiian / Pacific Islander residents-558,791,801.0 -584,518,166.9 33.6 Median age for Other race residents33.5 39.5 21.6 Median age for Two or more races residents21.6 23.0 45.7 Median age for White alone residents47.7 44.6 30.6 Median age for Hispanic or Latino residents28.7 32.2
Owner/renter occupied households by race in West Springfield
House owners and renters - White residents 4,026 83.9% Owner occupied770 16.1% Renter occupiedHouse owners and renters - Black or African American residents 560 68.1% Owner occupied262 31.9% Renter occupiedHouse owners and renters - American Indian / Alaska Native residents 41 100.0% Owner occupiedHouse owners and renters - Asian residents 877 79.9% Owner occupied221 20.1% Renter occupiedHouse owners and renters - Other race residents 284 75.7% Owner occupied91 24.3% Renter occupiedHouse owners and renters - Two or more races residents 494 71.8% Owner occupied194 28.2% Renter occupiedHouse owners and renters - White alone residents 3,769 85.6% Owner occupied635 14.4% Renter occupiedHouse owners and renters - Hispanic or Latino residents 748 66.4% Owner occupied379 33.6% Renter occupied
Language usage in West Springfield
English speakers - Total 63.3% of residents of West Springfield speak English at home.
13.9% of residents speak Spanish at home 2,080 68.0% Speak English very well981 32.0% Speak English less than very well22.6% of residents speak other language at home 3,149 63.1% Speak English very well1,838 36.9% Speak English less than very well
English speakers - Born in the United States 86.4% of residents of West Springfield speak English at home.
6.8% of residents speak Spanish at home 643 95.4% Speak English very well31 4.6% Speak English less than very well6.4% of residents speak other language at home 559 88.4% Speak English very well73 11.6% Speak English less than very well
English speakers - Native, born elsewhere 49.1% of residents of West Springfield speak English at home.
22.6% of residents speak Spanish at home 155 89.1% Speak English very well19 10.9% Speak English less than very well29.0% of residents speak other language at home 215 96.4% Speak English very well8 3.6% Speak English less than very well
English speakers - Foreign-born 16.0% of residents of West Springfield speak English at home.
25.9% of residents speak Spanish at home 802 52.1% Speak English very well736 47.9% Speak English less than very well58.0% of residents speak other language at home 1,927 56.0% Speak English very well1,512 44.0% Speak English less than very well
White (Caucasian) - Speak only English Native:
89.8% (9,056)Foreign-born:
14.8% (180)
White (Caucasian) - Speak another language Native:
9.2% (923)Foreign-born:
81.3% (988)
Black or African American - Speak only English Native:
88.9% (1,960)Foreign-born:
22.2% (169)
Black or African American - Speak another language Native:
11.0% (243)Foreign-born:
77.4% (590)
American Indian / Alaska Native - Speak another language Native:
25.1% (9)Foreign-born:
100.0% (43)
Asian - Speak only English Native:
30.3% (357)Foreign-born:
18.0% (436)
Asian - Speak another language Native:
71.4% (840)Foreign-born:
82.6% (2,000)
Other race - Speak another language Native:
45.3% (207)Foreign-born:
98.2% (484)
Two or more races - Speak only English Native:
59.0% (1,294)Foreign-born:
23.1% (201)
Two or more races - Speak another language Native:
42.1% (925)Foreign-born:
76.6% (666)
White alone - Speak only English Native:
93.2% (8,852)Foreign-born:
18.3% (164)
White alone - Speak another language Native:
6.7% (634)Foreign-born:
80.3% (720)
Hispanic or Latino - Speak only English Native:
41.4% (937)Foreign-born:
9.3% (157)
Hispanic or Latino - Speak another language Native:
57.6% (1,304)Foreign-born:
90.7% (1,530)
Foreign-born residents in West Springfield 5,933 residents are foreign born (11.6% Asia , 8.0% Latin America , 3.2% Africa ).
This city:
25.5%Virginia:
12.6%
Marital status for residents in West Springfield Marital status - White (Caucasian) population 15 years and over
Males 29.3% Never married59.7% Now married0.7% Separated3.7% Widowed6.6% DivorcedFemales 24.5% Never married55.3% Now married0.1% Separated6.5% Widowed13.5% DivorcedWomen who gave birth in the past 12 months Now married:
88.1% (139)Unmarried:
11.9% (19)
Women who did not give birth in the past 12 months Now married:
47.6% (1,133)Unmarried:
52.4% (1,246)
Marital status - Black or African American population 15 years and over
Males 50.3% Never married43.3% Now married0.0% Separated0.0% Widowed6.4% DivorcedFemales 53.1% Never married35.3% Now married0.0% Separated1.5% Widowed10.0% DivorcedWomen who gave birth in the past 12 months Now married:
76.5% (26)Unmarried:
23.5% (8)
Women who did not give birth in the past 12 months Now married:
29.4% (272)Unmarried:
70.6% (652)
Marital status - American Indian / Alaska Native population 15 years and over
Males 33.3% Never married66.7% Now married0.0% Separated0.0% Widowed0.0% DivorcedFemales 0.0% Never married50.0% Now married0.0% Separated50.0% Widowed0.0% DivorcedWomen who gave birth in the past 12 months Now married:
100.0% (17)Unmarried:
0.0% (0)
Marital status - Asian population 15 years and over
Males 31.5% Never married64.9% Now married0.8% Separated0.9% Widowed1.9% DivorcedFemales 27.9% Never married58.8% Now married0.0% Separated5.3% Widowed7.9% DivorcedWomen who gave birth in the past 12 months Now married:
84.6% (44)Unmarried:
15.4% (8)
Women who did not give birth in the past 12 months Now married:
53.4% (482)Unmarried:
46.6% (421)
Marital status - Other race population 15 years and over
Males 28.6% Never married52.3% Now married2.5% Separated2.3% Widowed14.3% DivorcedFemales 27.1% Never married52.9% Now married8.2% Separated0.0% Widowed11.8% DivorcedWomen who did not give birth in the past 12 months Now married:
47.7% (91)Unmarried:
52.3% (100)
Marital status - Two or more races population 15 years and over
Males 37.1% Never married59.4% Now married0.0% Separated1.2% Widowed2.4% DivorcedFemales 22.7% Never married70.6% Now married1.8% Separated1.9% Widowed3.0% DivorcedWomen who gave birth in the past 12 months Now married:
100.0% (13)Unmarried:
0.0% (0)
Women who did not give birth in the past 12 months Now married:
70.4% (786)Unmarried:
29.6% (330)
Marital status - White alone, not Hispanic / Latino population 15 years and over
Males 28.5% Never married60.0% Now married0.8% Separated4.3% Widowed6.4% DivorcedFemales 24.0% Never married56.1% Now married0.1% Separated6.7% Widowed13.1% DivorcedWomen who gave birth in the past 12 months Now married:
94.3% (144)Unmarried:
5.7% (9)
Women who did not give birth in the past 12 months Now married:
48.3% (1,018)Unmarried:
51.7% (1,089)
Marital status - Hispanic or Latino population 15 years and over
Males 32.5% Never married59.4% Now married0.7% Separated0.7% Widowed6.7% DivorcedFemales 19.7% Never married65.7% Now married2.2% Separated2.7% Widowed9.8% DivorcedWomen who gave birth in the past 12 months Now married:
54.5% (24)Unmarried:
45.5% (20)
Women who did not give birth in the past 12 months Now married:
65.0% (830)Unmarried:
35.0% (448)
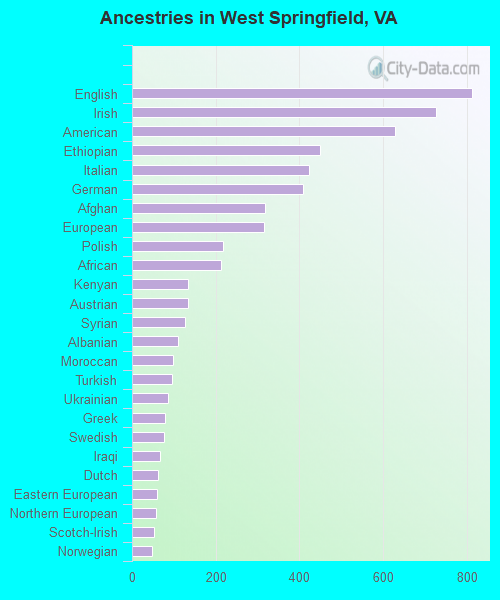
Ancestries in West Springfield
813 6.3% English728 5.6% Irish630 4.8% American449 3.5% Ethiopian423 3.3% Italian408 3.1% German317 2.4% Afghan316 2.4% European217 1.7% Polish214 1.6% African135 1.0% Kenyan133 1.0% Austrian126 1.0% Syrian110 0.8% Albanian99 0.8% Moroccan95 0.7% Turkish86 0.7% Ukrainian78 0.6% Greek77 0.6% Swedish67 0.5% Iraqi63 0.5% Dutch59 0.5% Eastern European57 0.4% Northern European53 0.4% Scotch-Irish47 0.4% Norwegian47 0.4% Scottish42 0.3% French41 0.3% Jamaican40 0.3% Armenian38 0.3% Scandinavian38 0.3% Somali38 0.3% Egyptian27 0.2% Hungarian25 0.2% Portuguese24 0.2% British20 0.2% Lebanese19 0.1% Russian18 0.1% Swiss16 0.1% Romanian13 0.1% Trinidadian and Tobagonian11 0.08% Finnish11 0.08% Czechoslovakian11 0.08% Palestinian9 0.07% Lithuanian9 0.07% Macedonian9 0.07% Danish8 0.06% Canadian7 0.05% Czech7 0.05% Bulgarian7 0.05% Slovak6 0.05% Pennsylvania German6 0.05% Assyrian5 0.04% Haitian3 0.02% Arab2 0.02% Slovene2 0.02% Ghanaian2 0.02% Welsh
Geographical mobility in West Springfield Same house 1 year ago 9,984 85.6% White (Caucasian)2,699 84.8% Black or African American47 69.8% American Indian / Alaska Native3,317 90.8% Asian834 82.0% Other race2,680 80.8% Two or more races8,872 83.3% White alone, not Hispanic / Latino3,780 88.6% Hispanic or LatinoMoved within same county 726 6.2% White / Caucasian211 6.6% Black or African American165 4.5% Asian66 6.5% Other race184 5.5% Two or more races786 7.4% White alone, not Hispanic / Latino155 3.6% Hispanic or LatinoMoved within same state 222 1.9% White / Caucasian119 3.7% Black or African American23 0.6% Asian67 6.6% Other race115 3.5% Two or more races234 2.2% White alone, not Hispanic / Latino130 3.1% Hispanic or LatinoMoved from different state 559 4.8% White / Caucasian19 0.6% Black or African American7 10.2% American Indian / Alaska Native44 1.2% Asian29 2.8% Other race145 4.4% Two or more races595 5.6% White alone, not Hispanic / Latino57 1.3% Hispanic or LatinoMoved from abroad 146 1.3% White19 0.6% Black or African American14 20.1% American Indian / Alaska Native107 2.9% Asian164 4.9% Two or more races156 1.5% White alone, not Hispanic / Latino100 2.4% Hispanic or Latino
Children Nativity (place of birth) in West Springfield
Children under 6 years - Living with two parents Both parents native 672 100.0% NativeBoth parents foreign-born 237 95.9% Native10 4.1% Foreign-bornOne native, one foreign-born parent 302 100.0% NativeChildren under 6 years - Living with one parent Native parent 43 100.0% NativeForeign-born parent 96 100.0% NativeChildren 6 to 17 years - Living with two parents Both parents native 1,301 99.6% Native5 0.4% Foreign-bornBoth parents foreign-born 786 75.7% Native253 24.3% Foreign-bornOne native, one foreign-born parent 646 97.9% Native14 2.1% Foreign-bornChildren 6 to 17 years - Living with one parent Native parent 307 100.0% NativeForeign-born parent 493 57.9% Native358 42.1% Foreign-born
Place of birth for residents in West Springfield
Grandparents responsible for own grandchildren in West Springfield
Grandparents (30 to 59 years) White / Caucasian 7 100.0% Not responsible for grandchildrenWhite alone, not Hispanic / Latino 16 100.0% Not responsible for grandchildrenGrandparents (60 years and over) White / Caucasian 34 20.4% Responsible for grandchildren134 79.6% Not responsible for grandchildrenWhite alone, not Hispanic / Latino 38 32.0% Responsible for grandchildren80 68.0% Not responsible for grandchildren