Races in West Columbia, South Carolina (SC) Detailed Stats
Data:
Races - White alone (%)
Races - White alone (% change since 2000)
Races - Black alone (%)
Races - Black alone (% change since 2000)
Races - American Indian alone (%)
Races - American Indian alone (% change since 2000)
Races - Asian alone (%)
Races - Asian alone (% change since 2000)
Races - Hispanic (%)
Races - Hispanic (% change since 2000)
Races - Native Hawaiian and Other Pacific Islander alone (%)
Races - Native Hawaiian and Other Pacific Islander alone (% change since 2000)
Races - Two or more races(%)
Races - Two or more races(% change since 2000)
Races - Other race alone (%)
Races - Other race alone (% change since 2000)
Racial diversity
Place of birth - Born in state of residence (%)
Place of birth - Born in state of residence (%) - White
Place of birth - Born in state of residence (%) - Black or African American
Place of birth - Born in state of residence (%) - Asian
Place of birth - Born in state of residence (%) - Hispanic or Latino
Place of birth - Born in state of residence (%) - American Indian and Alaska Native
Place of birth - Born in state of residence (%) - Multirace
Place of birth - Born in state of residence (%) - Other Race
Place of birth - Born in other state (%)
Place of birth - Born in other state (%) - White
Place of birth - Born in other state (%) - Black or African American
Place of birth - Born in other state (%) - Asian
Place of birth - Born in other state (%) - Hispanic or Latino
Place of birth - Born in other state (%) - American Indian and Alaska Native
Place of birth - Born in other state (%) - Multirace
Place of birth - Born in other state (%) - Other Race
Place of birth - Native, outside of US (%)
Place of birth - Native, outside of US (%) - White
Place of birth - Native, outside of US (%) - Black or African American
Place of birth - Native, outside of US (%) - Asian
Place of birth - Native, outside of US (%) - Hispanic or Latino
Place of birth - Native, outside of US (%) - American Indian and Alaska Native
Place of birth - Native, outside of US (%) - Multirace
Place of birth - Native, outside of US (%) - Other Race
Place of birth - Foreign born (%)
Place of birth - Foreign born (%) - White
Place of birth - Foreign born (%) - Black or African American
Place of birth - Foreign born (%) - Asian
Place of birth - Foreign born (%) - Hispanic or Latino
Place of birth - Foreign born (%) - American Indian and Alaska Native
Place of birth - Foreign born (%) - Multirace
Place of birth - Foreign born (%) - Other Race
Residents speaking English at home (%)
Residents speaking English at home - Born in the United States (%)
Residents speaking English at home - Native, born elsewhere (%)
Residents speaking English at home - Foreign born (%)
Residents speaking Spanish at home (%)
Residents speaking Spanish at home - Born in the United States (%)
Residents speaking Spanish at home - Native, born elsewhere (%)
Residents speaking Spanish at home - Foreign born (%)
Residents speaking other language at home (%)
Residents speaking other language at home - Born in the United States (%)
Residents speaking other language at home - Native, born elsewhere (%)
Residents speaking other language at home - Foreign born (%)
Marital status - Never married (%)
Marital status - Now married (%)
Marital status - Separated (%)
Marital status - Widowed (%)
Marital status - Divorced (%)
Ancestries Reported - Arab (%)
Ancestries Reported - Czech (%)
Ancestries Reported - Danish (%)
Ancestries Reported - Dutch (%)
Ancestries Reported - English (%)
Ancestries Reported - French (%)
Ancestries Reported - French Canadian (%)
Ancestries Reported - German (%)
Ancestries Reported - Greek (%)
Ancestries Reported - Hungarian (%)
Ancestries Reported - Irish (%)
Ancestries Reported - Italian (%)
Ancestries Reported - Lithuanian (%)
Ancestries Reported - Norwegian (%)
Ancestries Reported - Polish (%)
Ancestries Reported - Portuguese (%)
Ancestries Reported - Russian (%)
Ancestries Reported - Scotch-Irish (%)
Ancestries Reported - Scottish (%)
Ancestries Reported - Slovak (%)
Ancestries Reported - Subsaharan African (%)
Ancestries Reported - Swedish (%)
Ancestries Reported - Swiss (%)
Ancestries Reported - Ukrainian (%)
Ancestries Reported - United States (%)
Ancestries Reported - Welsh (%)
Ancestries Reported - West Indian (%)
Ancestries Reported - Other (%)
Geographical mobility - Same house 1 year ago (%)
Geographical mobility - Same house 1 year ago (%) - White
Geographical mobility - Same house 1 year ago (%) - Black or African American
Geographical mobility - Same house 1 year ago (%) - Asian
Geographical mobility - Same house 1 year ago (%) - Hispanic or Latino
Geographical mobility - Same house 1 year ago (%) - American Indian and Alaska Native
Geographical mobility - Same house 1 year ago (%) - Multirace
Geographical mobility - Same house 1 year ago (%) - Other Race
Geographical mobility - Moved within same county (%)
Geographical mobility - Moved within same county (%) - White
Geographical mobility - Moved within same county (%) - Black or African American
Geographical mobility - Moved within same county (%) - Asian
Geographical mobility - Moved within same county (%) - Hispanic or Latino
Geographical mobility - Moved within same county (%) - American Indian and Alaska Native
Geographical mobility - Moved within same county (%) - Multirace
Geographical mobility - Moved within same county (%) - Other Race
Geographical mobility - Moved from different county within same state (%)
Geographical mobility - Moved from different county within same state (%) - White
Geographical mobility - Moved from different county within same state (%) - Black or African American
Geographical mobility - Moved from different county within same state (%) - Asian
Geographical mobility - Moved from different county within same state (%) - Hispanic or Latino
Geographical mobility - Moved from different county within same state (%) - American Indian and Alaska Native
Geographical mobility - Moved from different county within same state (%) - Multirace
Geographical mobility - Moved from different county within same state (%) - Other Race
Geographical mobility - Moved from different state (%)
Geographical mobility - Moved from different state (%) - White
Geographical mobility - Moved from different state (%) - Black or African American
Geographical mobility - Moved from different state (%) - Asian
Geographical mobility - Moved from different state (%) - Hispanic or Latino
Geographical mobility - Moved from different state (%) - American Indian and Alaska Native
Geographical mobility - Moved from different state (%) - Multirace
Geographical mobility - Moved from different state (%) - Other Race
Geographical mobility - Moved from abroad (%)
Geographical mobility - Moved from abroad (%) - White
Geographical mobility - Moved from abroad (%) - Black or African American
Geographical mobility - Moved from abroad (%) - Asian
Geographical mobility - Moved from abroad (%) - Hispanic or Latino
Geographical mobility - Moved from abroad (%) - American Indian and Alaska Native
Geographical mobility - Moved from abroad (%) - Multirace
Geographical mobility - Moved from abroad (%) - Other Race
Place of birth for the foreign-born population - Ireland (%)
Place of birth for the foreign-born population - Denmark (%)
Place of birth for the foreign-born population - Norway (%)
Place of birth for the foreign-born population - Sweden (%)
Place of birth for the foreign-born population - United Kingdom (%)
Place of birth for the foreign-born population - England (%)
Place of birth for the foreign-born population - Scotland (%)
Place of birth for the foreign-born population - Other Northern Europe (%)
Place of birth for the foreign-born population - Austria (%)
Place of birth for the foreign-born population - Belgium (%)
Place of birth for the foreign-born population - France (%)
Place of birth for the foreign-born population - Germany (%)
Place of birth for the foreign-born population - Netherlands (%)
Place of birth for the foreign-born population - Switzerland (%)
Place of birth for the foreign-born population - Other Western Europe (%)
Place of birth for the foreign-born population - Greece (%)
Place of birth for the foreign-born population - Italy (%)
Place of birth for the foreign-born population - Portugal (%)
Place of birth for the foreign-born population - Spain (%)
Place of birth for the foreign-born population - Other Southern Europe (%)
Place of birth for the foreign-born population - Albania (%)
Place of birth for the foreign-born population - Belarus (%)
Place of birth for the foreign-born population - Bosnia and Herzegovina (%)
Place of birth for the foreign-born population - Bulgaria (%)
Place of birth for the foreign-born population - Croatia (%)
Place of birth for the foreign-born population - Czechoslovakia (%)
Place of birth for the foreign-born population - Hungary (%)
Place of birth for the foreign-born population - Latvia (%)
Place of birth for the foreign-born population - Lithuania (%)
Place of birth for the foreign-born population - North Macedonia (Macedonia) (%)
Place of birth for the foreign-born population - Moldova (%)
Place of birth for the foreign-born population - Poland (%)
Place of birth for the foreign-born population - Romania (%)
Place of birth for the foreign-born population - Russia (%)
Place of birth for the foreign-born population - Serbia (%)
Place of birth for the foreign-born population - Ukraine (%)
Place of birth for the foreign-born population - Other Eastern Europe (%)
Place of birth for the foreign-born population - China (%)
Place of birth for the foreign-born population - Hong Kong (%)
Place of birth for the foreign-born population - Taiwan (%)
Place of birth for the foreign-born population - Japan (%)
Place of birth for the foreign-born population - Korea (%)
Place of birth for the foreign-born population - Other Eastern Asia (%)
Place of birth for the foreign-born population - Afghanistan (%)
Place of birth for the foreign-born population - Bangladesh (%)
Place of birth for the foreign-born population - India (%)
Place of birth for the foreign-born population - Iran (%)
Place of birth for the foreign-born population - Kazakhstan (%)
Place of birth for the foreign-born population - Nepal (%)
Place of birth for the foreign-born population - Pakistan (%)
Place of birth for the foreign-born population - Sri Lanka (%)
Place of birth for the foreign-born population - Uzbekistan (%)
Place of birth for the foreign-born population - Other South Central Asia (%)
Place of birth for the foreign-born population - Burma (%)
Place of birth for the foreign-born population - Cambodia (%)
Place of birth for the foreign-born population - Indonesia (%)
Place of birth for the foreign-born population - Laos (%)
Place of birth for the foreign-born population - Malaysia (%)
Place of birth for the foreign-born population - Philippines (%)
Place of birth for the foreign-born population - Singapore (%)
Place of birth for the foreign-born population - Thailand (%)
Place of birth for the foreign-born population - Vietnam (%)
Place of birth for the foreign-born population - Other South Eastern Asia (%)
Place of birth for the foreign-born population - Armenia (%)
Place of birth for the foreign-born population - Iraq (%)
Place of birth for the foreign-born population - Israel (%)
Place of birth for the foreign-born population - Jordan (%)
Place of birth for the foreign-born population - Kuwait (%)
Place of birth for the foreign-born population - Lebanon (%)
Place of birth for the foreign-born population - Saudi Arabia (%)
Place of birth for the foreign-born population - Syria (%)
Place of birth for the foreign-born population - Turkey (%)
Place of birth for the foreign-born population - Yemen (%)
Place of birth for the foreign-born population - Other Western Asia (%)
Place of birth for the foreign-born population - Eritrea (%)
Place of birth for the foreign-born population - Ethiopia (%)
Place of birth for the foreign-born population - Kenya (%)
Place of birth for the foreign-born population - Somalia (%)
Place of birth for the foreign-born population - Uganda (%)
Place of birth for the foreign-born population - Zimbabwe (%)
Place of birth for the foreign-born population - Other Eastern Africa (%)
Place of birth for the foreign-born population - Cameroon (%)
Place of birth for the foreign-born population - Congo (%)
Place of birth for the foreign-born population - Democratic Republic of Congo (Zaire) (%)
Place of birth for the foreign-born population - Other Middle Africa (%)
Place of birth for the foreign-born population - Egypt (%)
Place of birth for the foreign-born population - Morocco (%)
Place of birth for the foreign-born population - Sudan (%)
Place of birth for the foreign-born population - Other Northern Africa (%)
Place of birth for the foreign-born population - South Africa (%)
Place of birth for the foreign-born population - Other Southern Africa (%)
Place of birth for the foreign-born population - Cabo Verde (%)
Place of birth for the foreign-born population - Ghana (%)
Place of birth for the foreign-born population - Liberia (%)
Place of birth for the foreign-born population - Nigeria (%)
Place of birth for the foreign-born population - Senegal (%)
Place of birth for the foreign-born population - Sierra Leone (%)
Place of birth for the foreign-born population - Other Western Africa (%)
Place of birth for the foreign-born population - Australia (%)
Place of birth for the foreign-born population - New Zealand (%)
Place of birth for the foreign-born population - Fiji (%)
Place of birth for the foreign-born population - Micronesia (%)
Place of birth for the foreign-born population - Bahamas (%)
Place of birth for the foreign-born population - Barbados (%)
Place of birth for the foreign-born population - Cuba (%)
Place of birth for the foreign-born population - Dominica (%)
Place of birth for the foreign-born population - Dominican Republic (%)
Place of birth for the foreign-born population - Grenada (%)
Place of birth for the foreign-born population - Haiti (%)
Place of birth for the foreign-born population - Jamaica (%)
Place of birth for the foreign-born population - St. Vincent and the Grenadines (%)
Place of birth for the foreign-born population - Trinidad and Tobago (%)
Place of birth for the foreign-born population - West Indies (%)
Place of birth for the foreign-born population - Other Caribbean (%)
Place of birth for the foreign-born population - Belize (%)
Place of birth for the foreign-born population - Costa Rica (%)
Place of birth for the foreign-born population - El Salvador (%)
Place of birth for the foreign-born population - Guatemala (%)
Place of birth for the foreign-born population - Honduras (%)
Place of birth for the foreign-born population - Mexico (%)
Place of birth for the foreign-born population - Nicaragua (%)
Place of birth for the foreign-born population - Panama (%)
Place of birth for the foreign-born population - Other Central America (%)
Place of birth for the foreign-born population - Argentina (%)
Place of birth for the foreign-born population - Bolivia (%)
Place of birth for the foreign-born population - Brazil (%)
Place of birth for the foreign-born population - Chile (%)
Place of birth for the foreign-born population - Colombia (%)
Place of birth for the foreign-born population - Ecuador (%)
Place of birth for the foreign-born population - Guyana (%)
Place of birth for the foreign-born population - Peru (%)
Place of birth for the foreign-born population - Uruguay (%)
Place of birth for the foreign-born population - Venezuela (%)
Place of birth for the foreign-born population - Other South America (%)
Place of birth for the foreign-born population - Canada (%)
Place of birth for the foreign-born population - Other Northern America (%)
Place of birth for the foreign-born population - Other (%)
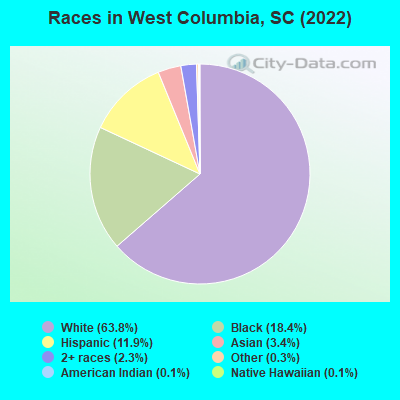
According to 2022 data, the most numerous races in West Columbia, SC are White alone (11,466 residents), Black alone (3,314 residents), and Hispanic (2,143 residents). 86.1% of West Columbia residents speak English at home. 8.5% of West Columbia, SC residents are foreign-born (4.8% born in Latin America, 2.7% born in Asia), which is 40.8% greater than the foreign-born rate of 5.0% across the entire state of South Carolina.
Race distribution in West Columbia
2000 2022
2,652,291 66.1% White alone 1,178,486 29.4% Black alone 95,076 2.4% Hispanic 35,568 0.9% Asian alone 33,290 0.8% Two or more races 12,765 0.3% American Indian alone 3,266 0.08% Other race alone 1,270 0.03% Native Hawaiian and Other
3,301,739 62.5% White alone 1,313,290 24.9% Black alone 343,783 6.5% Hispanic 190,508 3.6% Two or more races 89,888 1.7% Asian alone 29,390 0.6% Other race alone 12,112 0.2% American Indian alone 1,924 0.04% Native Hawaiian and Other
Income and house value in West Columbia Median household income in 2022 $66,864 White non-Hispanic householders$37,269 Black householders$51,852 Asian householders$46,623 Some other race householders$44,081 Two or more races householders$50,983 Hispanic or Latino race householdersMedian 2022 house value $211,184 White Non-Hispanic householders$160,987 Black or African American householders$237,297 American Indian or Alaska Native householders $348,594 Asian householders$82,395 Two or more races householders$384,848 Hispanic or Latino householders
Median age by race in West Columbia
46.1 Median age for White residents44.7 48.3 29.6 Median age for Black or African American residents30.6 28.6 6.9 Median age for American Indian / Alaska Native residents-878,787,877.9 7.3 30.7 Median age for Asian residents30.3 30.8 -698,412,697.7 Median age for Native Hawaiian / Pacific Islander residents-551,574,375.1 -666,666,666.0 33.4 Median age for Other race residents31.2 55.4 25.7 Median age for Two or more races residents23.0 39.3 48.2 Median age for White alone residents46.1 49.3 23.9 Median age for Hispanic or Latino residents22.6 30.0
Owner/renter occupied households by race in West Columbia
House owners and renters - White residents 4,093 71.0% Owner occupied1,671 29.0% Renter occupiedHouse owners and renters - Black or African American residents 309 21.7% Owner occupied1,114 78.3% Renter occupiedHouse owners and renters - American Indian / Alaska Native residents 10 100.0% Renter occupiedHouse owners and renters - Asian residents 94 26.1% Owner occupied266 73.9% Renter occupiedHouse owners and renters - Other race residents 26 28.2% Owner occupied66 71.8% Renter occupiedHouse owners and renters - Two or more races residents 325 37.4% Owner occupied545 62.6% Renter occupiedHouse owners and renters - White alone residents 4,022 71.9% Owner occupied1,570 28.1% Renter occupiedHouse owners and renters - Hispanic or Latino residents 267 31.3% Owner occupied587 68.7% Renter occupied
Language usage in West Columbia
English speakers - Total 86.1% of residents of West Columbia speak English at home.
10.4% of residents speak Spanish at home 893 51.5% Speak English very well840 48.5% Speak English less than very well3.9% of residents speak other language at home 395 60.9% Speak English very well254 39.1% Speak English less than very well
English speakers - Born in the United States 92.3% of residents of West Columbia speak English at home.
7.9% of residents speak Spanish at home 273 69.1% Speak English very well122 30.9% Speak English less than very well1.3% of residents speak other language at home 54 81.8% Speak English very well12 18.2% Speak English less than very well
English speakers - Native, born elsewhere 38.1% of residents of West Columbia speak English at home.
66.1% of residents speak Spanish at home 191 100.0% Speak English very well
English speakers - Foreign-born 7.7% of residents of West Columbia speak English at home.
59.6% of residents speak Spanish at home 202 21.7% Speak English very well729 78.3% Speak English less than very well32.1% of residents speak other language at home 340 67.7% Speak English very well162 32.3% Speak English less than very well
White (Caucasian) - Speak only English Native:
97.1% (10,623)Foreign-born:
28.0% (91)
White (Caucasian) - Speak another language Native:
2.9% (314)Foreign-born:
71.9% (232)
Black or African American - Speak only English Native:
99.9% (2,950)Foreign-born:
50.9% (9)
Black or African American - Speak another language Native:
0.2% (7)Foreign-born:
44.6% (8)
Asian - Speak only English Native:
45.0% (60)Foreign-born:
4.9% (21)
Asian - Speak another language Native:
55.8% (74)Foreign-born:
100.0% (439)
Other race - Speak another language Native:
48.4% (22)Foreign-born:
100.0% (146)
Two or more races - Speak only English Native:
51.9% (580)Foreign-born:
0.5% (4)
Two or more races - Speak another language Native:
44.6% (499)Foreign-born:
100.0% (781)
White alone - Speak only English Native:
97.7% (10,445)Foreign-born:
39.7% (105)
White alone - Speak another language Native:
2.3% (250)Foreign-born:
59.8% (159)
Hispanic or Latino - Speak only English Native:
38.8% (355)Foreign-born:
0.3% (3)
Hispanic or Latino - Speak another language Native:
61.1% (560)Foreign-born:
100.0% (830)
Foreign-born residents in West Columbia 1,520 residents are foreign born (4.8% Latin America , 2.7% Asia ).
This city:
8.5%South Carolina:
5.3%
Marital status for residents in West Columbia Marital status - White (Caucasian) population 15 years and over
Males 34.8% Never married44.4% Now married1.2% Separated6.9% Widowed12.7% DivorcedFemales 33.9% Never married35.4% Now married1.0% Separated16.6% Widowed13.1% DivorcedWomen who gave birth in the past 12 months Now married:
23.4% (43)Unmarried:
76.6% (141)
Women who did not give birth in the past 12 months Now married:
32.5% (868)Unmarried:
67.5% (1,805)
Marital status - Black or African American population 15 years and over
Males 51.0% Never married39.7% Now married3.1% Separated3.5% Widowed2.7% DivorcedFemales 43.5% Never married24.4% Now married9.9% Separated5.4% Widowed16.7% DivorcedWomen who gave birth in the past 12 months Now married:
0.0% (0)Unmarried:
100.0% (98)
Women who did not give birth in the past 12 months Now married:
37.8% (297)Unmarried:
62.2% (488)
Marital status - American Indian / Alaska Native population 15 years and over
Males 0.0% Never married100.0% Now married0.0% Separated0.0% Widowed0.0% DivorcedFemales 0.0% Never married100.0% Now married0.0% Separated0.0% Widowed0.0% DivorcedWomen who gave birth in the past 12 months Now married:
100.0% (8)Unmarried:
0.0% (0)
Women who did not give birth in the past 12 months Now married:
100.0% (8)Unmarried:
0.0% (0)
Marital status - Asian population 15 years and over
Males 53.4% Never married43.1% Now married0.0% Separated0.0% Widowed3.4% DivorcedFemales 50.2% Never married31.5% Now married2.4% Separated0.0% Widowed15.9% DivorcedWomen who gave birth in the past 12 months Now married:
100.0% (4)Unmarried:
0.0% (0)
Women who did not give birth in the past 12 months Now married:
32.8% (85)Unmarried:
67.2% (175)
Marital status - Other race population 15 years and over
Males 46.3% Never married53.7% Now married0.0% Separated0.0% Widowed0.0% DivorcedFemales 0.0% Never married75.9% Now married7.6% Separated0.0% Widowed16.5% DivorcedWomen who gave birth in the past 12 months Now married:
100.0% (6)Unmarried:
0.0% (0)
Women who did not give birth in the past 12 months Now married:
75.9% (57)Unmarried:
24.1% (18)
Marital status - Two or more races population 15 years and over
Males 68.2% Never married31.8% Now married0.0% Separated0.0% Widowed0.0% DivorcedFemales 38.7% Never married39.6% Now married0.7% Separated5.5% Widowed15.5% DivorcedWomen who gave birth in the past 12 months Now married:
100.0% (36)Unmarried:
0.0% (0)
Women who did not give birth in the past 12 months Now married:
39.0% (169)Unmarried:
61.0% (264)
Marital status - White alone, not Hispanic / Latino population 15 years and over
Males 35.4% Never married44.8% Now married1.3% Separated7.0% Widowed11.5% DivorcedFemales 32.6% Never married35.9% Now married1.0% Separated17.1% Widowed13.5% DivorcedWomen who gave birth in the past 12 months Now married:
25.7% (43)Unmarried:
74.3% (124)
Women who did not give birth in the past 12 months Now married:
33.4% (849)Unmarried:
66.6% (1,690)
Marital status - Hispanic or Latino population 15 years and over
Males 47.7% Never married41.4% Now married0.0% Separated0.0% Widowed10.8% DivorcedFemales 35.7% Never married45.8% Now married0.9% Separated3.5% Widowed14.1% DivorcedWomen who gave birth in the past 12 months Now married:
70.7% (47)Unmarried:
29.3% (19)
Women who did not give birth in the past 12 months Now married:
47.4% (274)Unmarried:
52.6% (304)
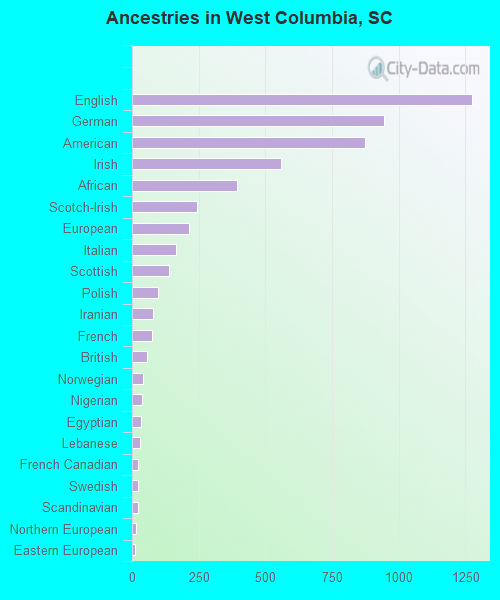
Ancestries in West Columbia
1,275 13.6% English945 10.1% German873 9.3% American558 6.0% Irish393 4.2% African244 2.6% Scotch-Irish215 2.3% European164 1.8% Italian140 1.5% Scottish97 1.0% Polish80 0.9% Iranian76 0.8% French56 0.6% British41 0.4% Norwegian38 0.4% Nigerian35 0.4% Egyptian31 0.3% Lebanese24 0.3% French Canadian23 0.2% Swedish21 0.2% Scandinavian15 0.2% Northern European12 0.1% Eastern European8 0.09% Bulgarian7 0.07% Dutch6 0.06% Iraqi6 0.06% Canadian5 0.05% Danish3 0.03% Latvian
Geographical mobility in West Columbia Same house 1 year ago 9,827 83.5% White (Caucasian)2,828 87.4% Black or African American77 95.7% American Indian / Alaska Native373 61.3% Asian27 100.0% Native Hawaiian / Pacific Islander167 78.3% Other race1,394 71.7% Two or more races9,605 84.3% White alone, not Hispanic / Latino1,515 76.9% Hispanic or LatinoMoved within same county 631 5.4% White / Caucasian232 7.2% Black or African American2 2.0% American Indian / Alaska Native90 14.8% Asian443 22.8% Two or more races573 5.0% White alone, not Hispanic / Latino241 12.2% Hispanic or LatinoMoved within same state 456 3.9% White / Caucasian133 4.1% Black or African American125 20.6% Asian20 9.1% Other race197 10.1% Two or more races439 3.9% White alone, not Hispanic / Latino199 10.1% Hispanic or LatinoMoved from different state 655 5.6% White / Caucasian15 0.5% Black or African American22 3.6% Asian15 0.8% Two or more races610 5.4% White alone, not Hispanic / Latino31 1.6% Hispanic or LatinoMoved from abroad 87 0.7% White5 0.2% Black or African American22 3.5% Asian97 0.9% White alone, not Hispanic / Latino
Children Nativity (place of birth) in West Columbia
Children under 6 years - Living with two parents Both parents native 753 100.0% NativeBoth parents foreign-born 336 100.0% NativeOne native, one foreign-born parent 26 100.0% NativeChildren under 6 years - Living with one parent Native parent 291 100.0% NativeChildren 6 to 17 years - Living with two parents Both parents native 558 100.0% NativeBoth parents foreign-born 70 77.0% Native21 23.0% Foreign-bornOne native, one foreign-born parent 34 87.0% Native5 13.0% Foreign-bornChildren 6 to 17 years - Living with one parent Native parent 523 100.0% NativeForeign-born parent 128 46.7% Native146 53.3% Foreign-born
Grandparents responsible for own grandchildren in West Columbia
Grandparents (30 to 59 years) White / Caucasian 17 100.0% Responsible for grandchildrenBlack or African American 39 36.3% Responsible for grandchildren68 63.7% Not responsible for grandchildrenHispanic or Latino 19 100.0% Responsible for grandchildrenGrandparents (60 years and over) White / Caucasian 9 11.9% Responsible for grandchildren68 88.1% Not responsible for grandchildrenBlack or African American 13 46.3% Responsible for grandchildren15 53.7% Not responsible for grandchildren