Races in Warwick, Rhode Island (RI) Detailed Stats
Data:
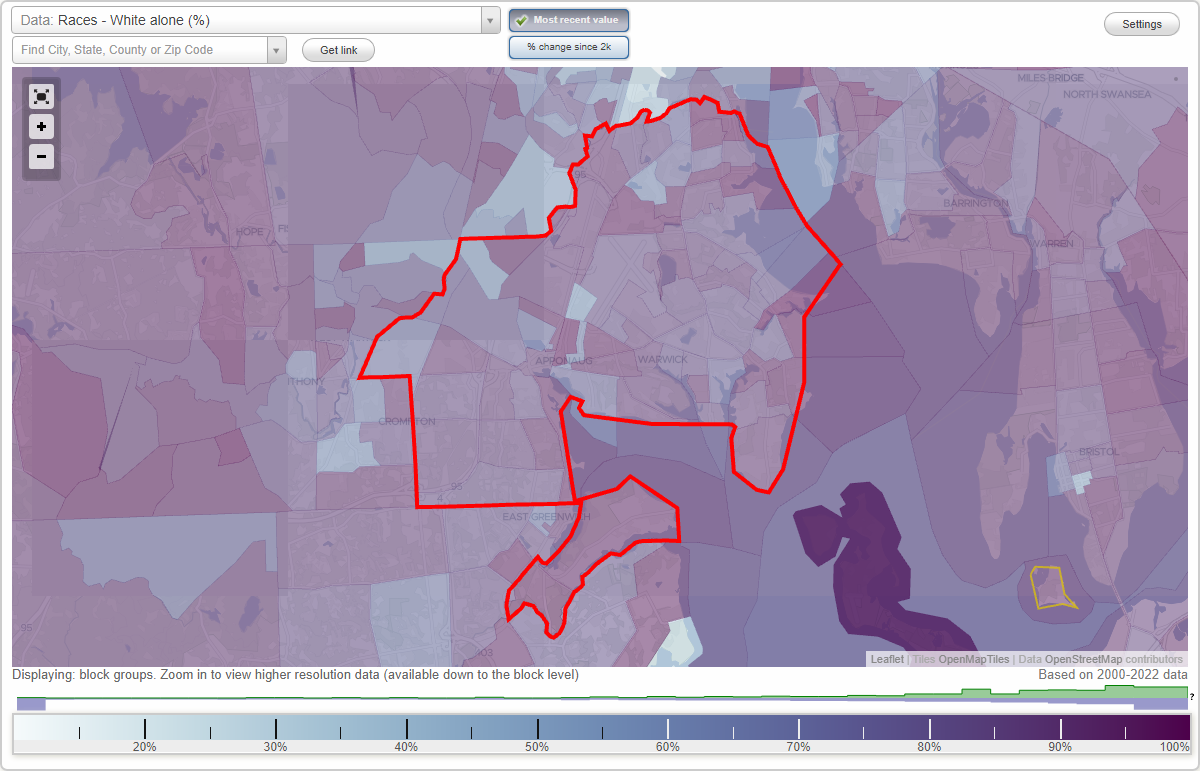
Races - White alone (%)
Races - White alone (% change since 2000)
Races - Black alone (%)
Races - Black alone (% change since 2000)
Races - American Indian alone (%)
Races - American Indian alone (% change since 2000)
Races - Asian alone (%)
Races - Asian alone (% change since 2000)
Races - Hispanic (%)
Races - Hispanic (% change since 2000)
Races - Native Hawaiian and Other Pacific Islander alone (%)
Races - Native Hawaiian and Other Pacific Islander alone (% change since 2000)
Races - Two or more races(%)
Races - Two or more races(% change since 2000)
Races - Other race alone (%)
Races - Other race alone (% change since 2000)
Racial diversity
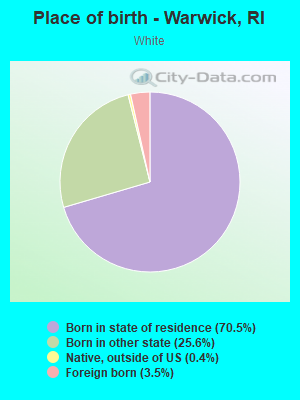
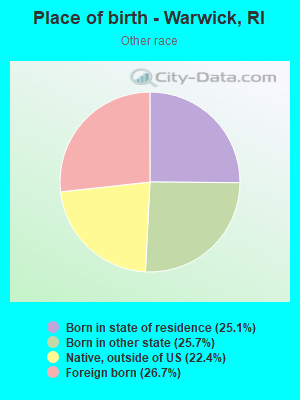
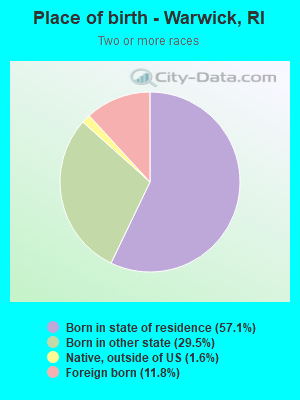
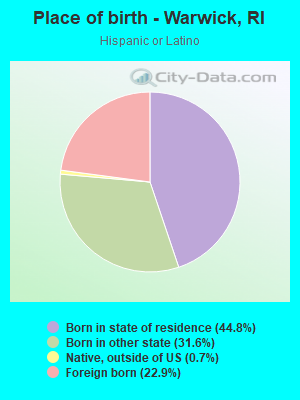
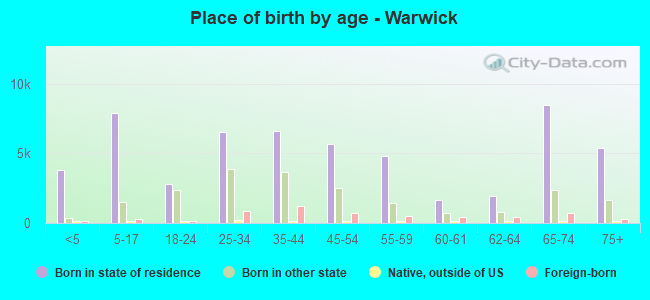
Place of birth - Born in state of residence (%)
Place of birth - Born in state of residence (%) - White
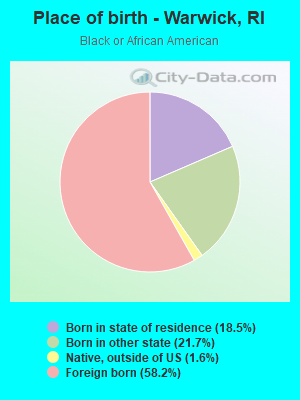
Place of birth - Born in state of residence (%) - Black or African American
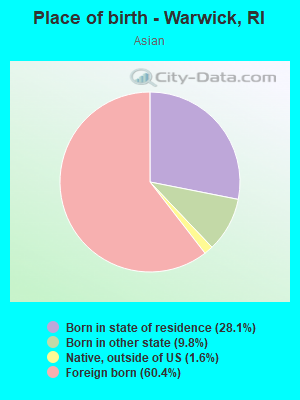
Place of birth - Born in state of residence (%) - Asian
Place of birth - Born in state of residence (%) - Hispanic or Latino
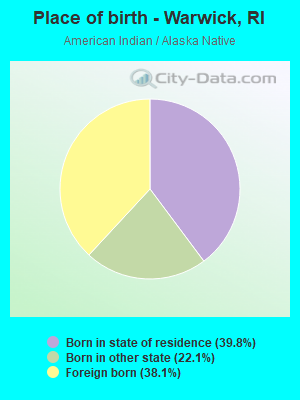
Place of birth - Born in state of residence (%) - American Indian and Alaska Native
Place of birth - Born in state of residence (%) - Multirace
Place of birth - Born in state of residence (%) - Other Race
Place of birth - Born in other state (%)
Place of birth - Born in other state (%) - White
Place of birth - Born in other state (%) - Black or African American
Place of birth - Born in other state (%) - Asian
Place of birth - Born in other state (%) - Hispanic or Latino
Place of birth - Born in other state (%) - American Indian and Alaska Native
Place of birth - Born in other state (%) - Multirace
Place of birth - Born in other state (%) - Other Race
Place of birth - Native, outside of US (%)
Place of birth - Native, outside of US (%) - White
Place of birth - Native, outside of US (%) - Black or African American
Place of birth - Native, outside of US (%) - Asian
Place of birth - Native, outside of US (%) - Hispanic or Latino
Place of birth - Native, outside of US (%) - American Indian and Alaska Native
Place of birth - Native, outside of US (%) - Multirace
Place of birth - Native, outside of US (%) - Other Race
Place of birth - Foreign born (%)
Place of birth - Foreign born (%) - White
Place of birth - Foreign born (%) - Black or African American
Place of birth - Foreign born (%) - Asian
Place of birth - Foreign born (%) - Hispanic or Latino
Place of birth - Foreign born (%) - American Indian and Alaska Native
Place of birth - Foreign born (%) - Multirace
Place of birth - Foreign born (%) - Other Race
Residents speaking English at home (%)
Residents speaking English at home - Born in the United States (%)
Residents speaking English at home - Native, born elsewhere (%)
Residents speaking English at home - Foreign born (%)
Residents speaking Spanish at home (%)
Residents speaking Spanish at home - Born in the United States (%)
Residents speaking Spanish at home - Native, born elsewhere (%)
Residents speaking Spanish at home - Foreign born (%)
Residents speaking other language at home (%)
Residents speaking other language at home - Born in the United States (%)
Residents speaking other language at home - Native, born elsewhere (%)
Residents speaking other language at home - Foreign born (%)
Marital status - Never married (%)
Marital status - Now married (%)
Marital status - Separated (%)
Marital status - Widowed (%)
Marital status - Divorced (%)
Ancestries Reported - Arab (%)
Ancestries Reported - Czech (%)
Ancestries Reported - Danish (%)
Ancestries Reported - Dutch (%)
Ancestries Reported - English (%)
Ancestries Reported - French (%)
Ancestries Reported - French Canadian (%)
Ancestries Reported - German (%)
Ancestries Reported - Greek (%)
Ancestries Reported - Hungarian (%)
Ancestries Reported - Irish (%)
Ancestries Reported - Italian (%)
Ancestries Reported - Lithuanian (%)
Ancestries Reported - Norwegian (%)
Ancestries Reported - Polish (%)
Ancestries Reported - Portuguese (%)
Ancestries Reported - Russian (%)
Ancestries Reported - Scotch-Irish (%)
Ancestries Reported - Scottish (%)
Ancestries Reported - Slovak (%)
Ancestries Reported - Subsaharan African (%)
Ancestries Reported - Swedish (%)
Ancestries Reported - Swiss (%)
Ancestries Reported - Ukrainian (%)
Ancestries Reported - United States (%)
Ancestries Reported - Welsh (%)
Ancestries Reported - West Indian (%)
Ancestries Reported - Other (%)
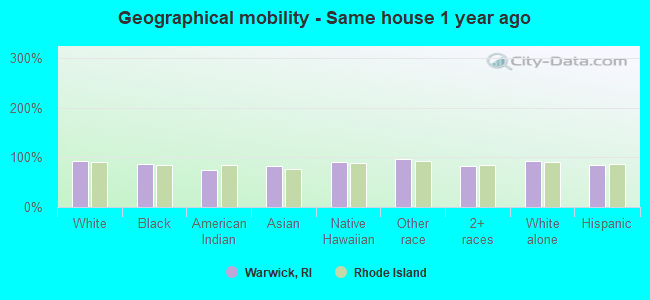
Geographical mobility - Same house 1 year ago (%)
Geographical mobility - Same house 1 year ago (%) - White
Geographical mobility - Same house 1 year ago (%) - Black or African American
Geographical mobility - Same house 1 year ago (%) - Asian
Geographical mobility - Same house 1 year ago (%) - Hispanic or Latino
Geographical mobility - Same house 1 year ago (%) - American Indian and Alaska Native
Geographical mobility - Same house 1 year ago (%) - Multirace
Geographical mobility - Same house 1 year ago (%) - Other Race
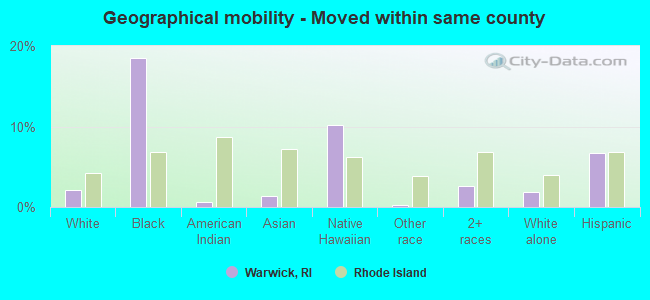
Geographical mobility - Moved within same county (%)
Geographical mobility - Moved within same county (%) - White
Geographical mobility - Moved within same county (%) - Black or African American
Geographical mobility - Moved within same county (%) - Asian
Geographical mobility - Moved within same county (%) - Hispanic or Latino
Geographical mobility - Moved within same county (%) - American Indian and Alaska Native
Geographical mobility - Moved within same county (%) - Multirace
Geographical mobility - Moved within same county (%) - Other Race
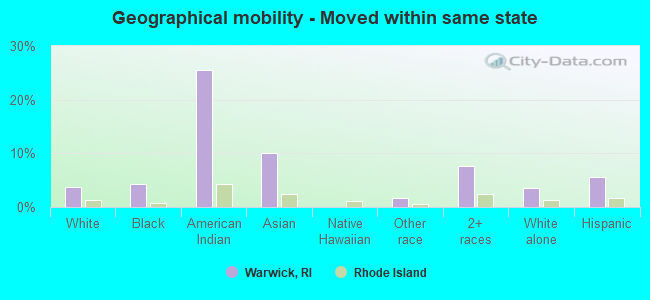
Geographical mobility - Moved from different county within same state (%)
Geographical mobility - Moved from different county within same state (%) - White
Geographical mobility - Moved from different county within same state (%) - Black or African American
Geographical mobility - Moved from different county within same state (%) - Asian
Geographical mobility - Moved from different county within same state (%) - Hispanic or Latino
Geographical mobility - Moved from different county within same state (%) - American Indian and Alaska Native
Geographical mobility - Moved from different county within same state (%) - Multirace
Geographical mobility - Moved from different county within same state (%) - Other Race
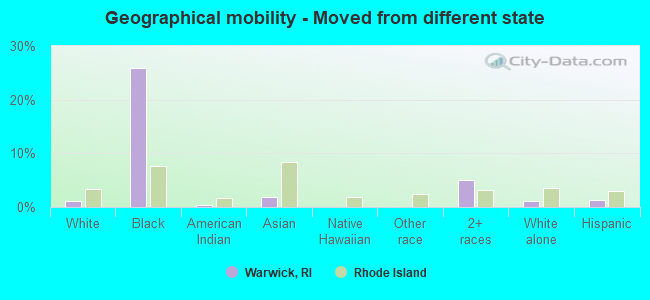
Geographical mobility - Moved from different state (%)
Geographical mobility - Moved from different state (%) - White
Geographical mobility - Moved from different state (%) - Black or African American
Geographical mobility - Moved from different state (%) - Asian
Geographical mobility - Moved from different state (%) - Hispanic or Latino
Geographical mobility - Moved from different state (%) - American Indian and Alaska Native
Geographical mobility - Moved from different state (%) - Multirace
Geographical mobility - Moved from different state (%) - Other Race
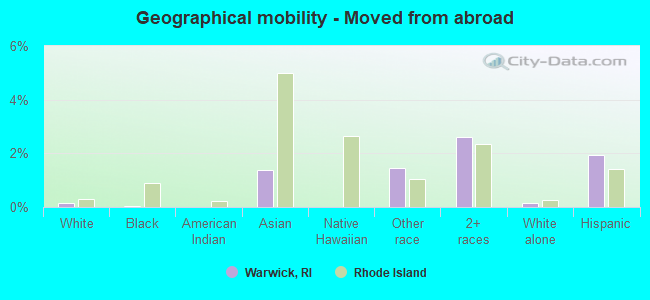
Geographical mobility - Moved from abroad (%)
Geographical mobility - Moved from abroad (%) - White
Geographical mobility - Moved from abroad (%) - Black or African American
Geographical mobility - Moved from abroad (%) - Asian
Geographical mobility - Moved from abroad (%) - Hispanic or Latino
Geographical mobility - Moved from abroad (%) - American Indian and Alaska Native
Geographical mobility - Moved from abroad (%) - Multirace
Geographical mobility - Moved from abroad (%) - Other Race
Place of birth for the foreign-born population - Ireland (%)
Place of birth for the foreign-born population - Denmark (%)
Place of birth for the foreign-born population - Norway (%)
Place of birth for the foreign-born population - Sweden (%)
Place of birth for the foreign-born population - United Kingdom (%)
Place of birth for the foreign-born population - England (%)
Place of birth for the foreign-born population - Scotland (%)
Place of birth for the foreign-born population - Other Northern Europe (%)
Place of birth for the foreign-born population - Austria (%)
Place of birth for the foreign-born population - Belgium (%)
Place of birth for the foreign-born population - France (%)
Place of birth for the foreign-born population - Germany (%)
Place of birth for the foreign-born population - Netherlands (%)
Place of birth for the foreign-born population - Switzerland (%)
Place of birth for the foreign-born population - Other Western Europe (%)
Place of birth for the foreign-born population - Greece (%)
Place of birth for the foreign-born population - Italy (%)
Place of birth for the foreign-born population - Portugal (%)
Place of birth for the foreign-born population - Spain (%)
Place of birth for the foreign-born population - Other Southern Europe (%)
Place of birth for the foreign-born population - Albania (%)
Place of birth for the foreign-born population - Belarus (%)
Place of birth for the foreign-born population - Bosnia and Herzegovina (%)
Place of birth for the foreign-born population - Bulgaria (%)
Place of birth for the foreign-born population - Croatia (%)
Place of birth for the foreign-born population - Czechoslovakia (%)
Place of birth for the foreign-born population - Hungary (%)
Place of birth for the foreign-born population - Latvia (%)
Place of birth for the foreign-born population - Lithuania (%)
Place of birth for the foreign-born population - North Macedonia (Macedonia) (%)
Place of birth for the foreign-born population - Moldova (%)
Place of birth for the foreign-born population - Poland (%)
Place of birth for the foreign-born population - Romania (%)
Place of birth for the foreign-born population - Russia (%)
Place of birth for the foreign-born population - Serbia (%)
Place of birth for the foreign-born population - Ukraine (%)
Place of birth for the foreign-born population - Other Eastern Europe (%)
Place of birth for the foreign-born population - China (%)
Place of birth for the foreign-born population - Hong Kong (%)
Place of birth for the foreign-born population - Taiwan (%)
Place of birth for the foreign-born population - Japan (%)
Place of birth for the foreign-born population - Korea (%)
Place of birth for the foreign-born population - Other Eastern Asia (%)
Place of birth for the foreign-born population - Afghanistan (%)
Place of birth for the foreign-born population - Bangladesh (%)
Place of birth for the foreign-born population - India (%)
Place of birth for the foreign-born population - Iran (%)
Place of birth for the foreign-born population - Kazakhstan (%)
Place of birth for the foreign-born population - Nepal (%)
Place of birth for the foreign-born population - Pakistan (%)
Place of birth for the foreign-born population - Sri Lanka (%)
Place of birth for the foreign-born population - Uzbekistan (%)
Place of birth for the foreign-born population - Other South Central Asia (%)
Place of birth for the foreign-born population - Burma (%)
Place of birth for the foreign-born population - Cambodia (%)
Place of birth for the foreign-born population - Indonesia (%)
Place of birth for the foreign-born population - Laos (%)
Place of birth for the foreign-born population - Malaysia (%)
Place of birth for the foreign-born population - Philippines (%)
Place of birth for the foreign-born population - Singapore (%)
Place of birth for the foreign-born population - Thailand (%)
Place of birth for the foreign-born population - Vietnam (%)
Place of birth for the foreign-born population - Other South Eastern Asia (%)
Place of birth for the foreign-born population - Armenia (%)
Place of birth for the foreign-born population - Iraq (%)
Place of birth for the foreign-born population - Israel (%)
Place of birth for the foreign-born population - Jordan (%)
Place of birth for the foreign-born population - Kuwait (%)
Place of birth for the foreign-born population - Lebanon (%)
Place of birth for the foreign-born population - Saudi Arabia (%)
Place of birth for the foreign-born population - Syria (%)
Place of birth for the foreign-born population - Turkey (%)
Place of birth for the foreign-born population - Yemen (%)
Place of birth for the foreign-born population - Other Western Asia (%)
Place of birth for the foreign-born population - Eritrea (%)
Place of birth for the foreign-born population - Ethiopia (%)
Place of birth for the foreign-born population - Kenya (%)
Place of birth for the foreign-born population - Somalia (%)
Place of birth for the foreign-born population - Uganda (%)
Place of birth for the foreign-born population - Zimbabwe (%)
Place of birth for the foreign-born population - Other Eastern Africa (%)
Place of birth for the foreign-born population - Cameroon (%)
Place of birth for the foreign-born population - Congo (%)
Place of birth for the foreign-born population - Democratic Republic of Congo (Zaire) (%)
Place of birth for the foreign-born population - Other Middle Africa (%)
Place of birth for the foreign-born population - Egypt (%)
Place of birth for the foreign-born population - Morocco (%)
Place of birth for the foreign-born population - Sudan (%)
Place of birth for the foreign-born population - Other Northern Africa (%)
Place of birth for the foreign-born population - South Africa (%)
Place of birth for the foreign-born population - Other Southern Africa (%)
Place of birth for the foreign-born population - Cabo Verde (%)
Place of birth for the foreign-born population - Ghana (%)
Place of birth for the foreign-born population - Liberia (%)
Place of birth for the foreign-born population - Nigeria (%)
Place of birth for the foreign-born population - Senegal (%)
Place of birth for the foreign-born population - Sierra Leone (%)
Place of birth for the foreign-born population - Other Western Africa (%)
Place of birth for the foreign-born population - Australia (%)
Place of birth for the foreign-born population - New Zealand (%)
Place of birth for the foreign-born population - Fiji (%)
Place of birth for the foreign-born population - Micronesia (%)
Place of birth for the foreign-born population - Bahamas (%)
Place of birth for the foreign-born population - Barbados (%)
Place of birth for the foreign-born population - Cuba (%)
Place of birth for the foreign-born population - Dominica (%)
Place of birth for the foreign-born population - Dominican Republic (%)
Place of birth for the foreign-born population - Grenada (%)
Place of birth for the foreign-born population - Haiti (%)
Place of birth for the foreign-born population - Jamaica (%)
Place of birth for the foreign-born population - St. Vincent and the Grenadines (%)
Place of birth for the foreign-born population - Trinidad and Tobago (%)
Place of birth for the foreign-born population - West Indies (%)
Place of birth for the foreign-born population - Other Caribbean (%)
Place of birth for the foreign-born population - Belize (%)
Place of birth for the foreign-born population - Costa Rica (%)
Place of birth for the foreign-born population - El Salvador (%)
Place of birth for the foreign-born population - Guatemala (%)
Place of birth for the foreign-born population - Honduras (%)
Place of birth for the foreign-born population - Mexico (%)
Place of birth for the foreign-born population - Nicaragua (%)
Place of birth for the foreign-born population - Panama (%)
Place of birth for the foreign-born population - Other Central America (%)
Place of birth for the foreign-born population - Argentina (%)
Place of birth for the foreign-born population - Bolivia (%)
Place of birth for the foreign-born population - Brazil (%)
Place of birth for the foreign-born population - Chile (%)
Place of birth for the foreign-born population - Colombia (%)
Place of birth for the foreign-born population - Ecuador (%)
Place of birth for the foreign-born population - Guyana (%)
Place of birth for the foreign-born population - Peru (%)
Place of birth for the foreign-born population - Uruguay (%)
Place of birth for the foreign-born population - Venezuela (%)
Place of birth for the foreign-born population - Other South America (%)
Place of birth for the foreign-born population - Canada (%)
Place of birth for the foreign-born population - Other Northern America (%)
Place of birth for the foreign-born population - Other (%)
Latest news about races in Warwick, RI collected exclusively by city-data.com from local newspapers, TV, and radio stations
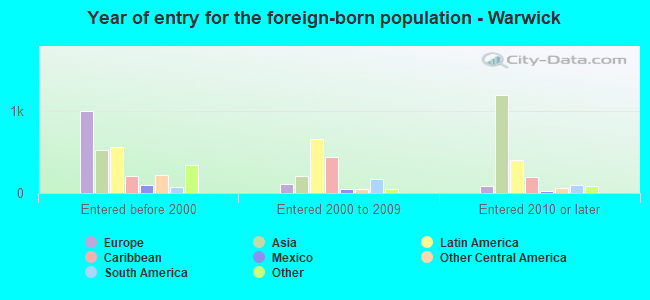
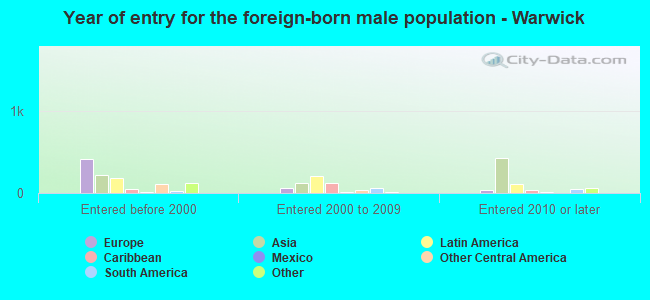
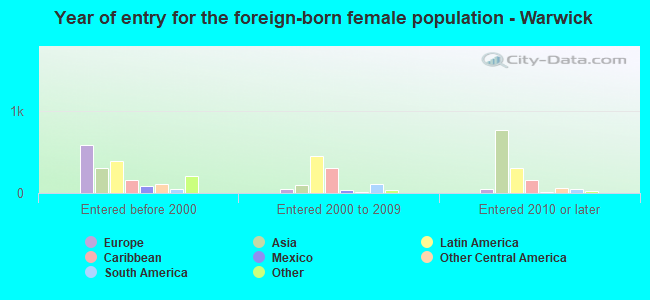
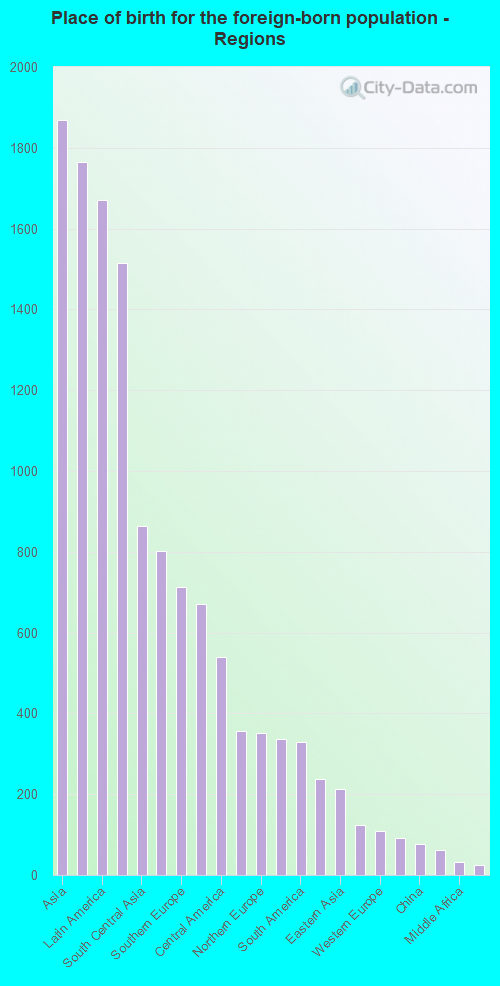
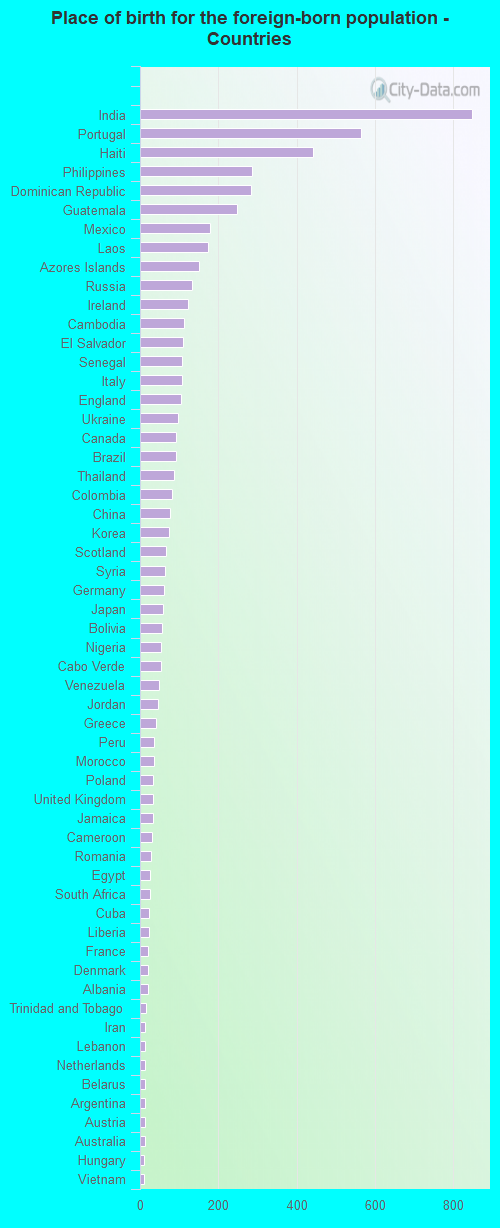
According to 2022 data, the most numerous races in Warwick, RI are White alone (71,495 residents), Hispanic (4,434 residents), and Two or more races (3,820 residents). 92.4% of Warwick residents speak English at home. 6.6% of Warwick, RI residents are foreign-born (2.2% born in Asia, 2.0% born in Latin America, 1.8% born in Europe), which is 111.4% less than the foreign-born rate of 14.0% across the entire state of Rhode Island.
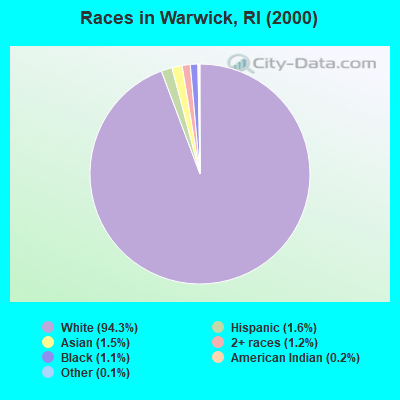
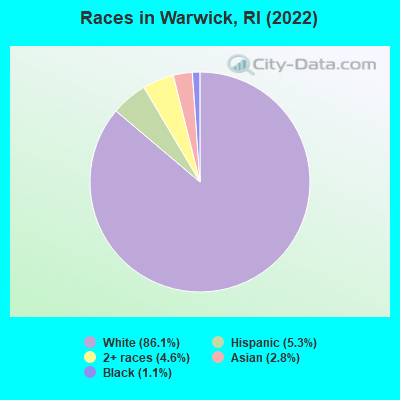
Race distribution in Warwick
2000 2022
858,433 81.9% White alone 90,820 8.7% Hispanic 41,922 4.0% Black alone 23,416 2.2% Asian alone 20,816 2.0% Two or more races 8,411 0.8% Other race alone 4,181 0.4% American Indian alone 320 0.03% Native Hawaiian and Other
745,825 68.2% White alone 191,979 17.6% Hispanic 56,738 5.2% Two or more races 51,326 4.7% Black alone 37,234 3.4% Asian alone 9,514 0.9% Other race alone 978 0.09% American Indian alone 140 0.01% Native Hawaiian and Other
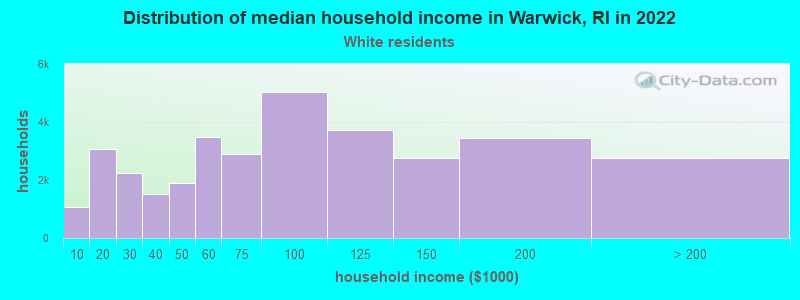
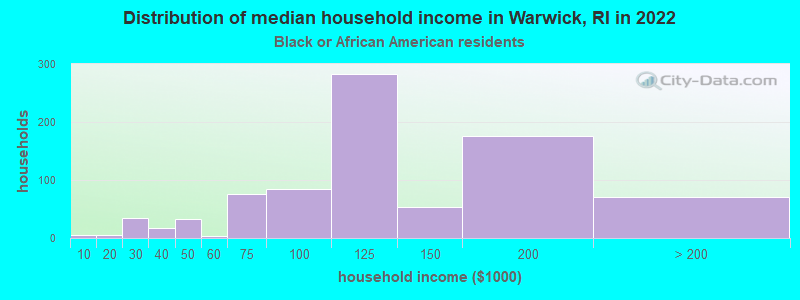
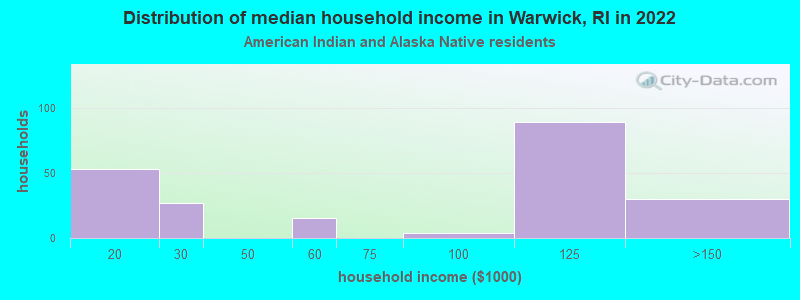
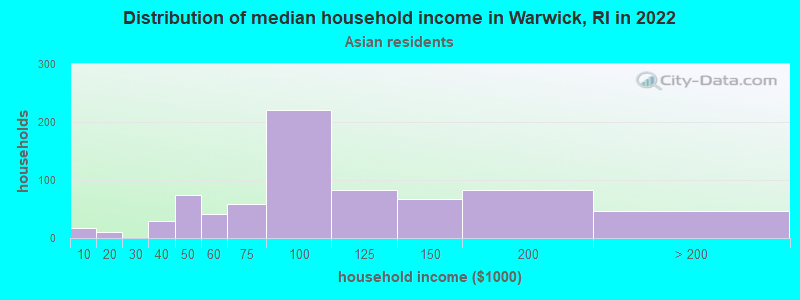
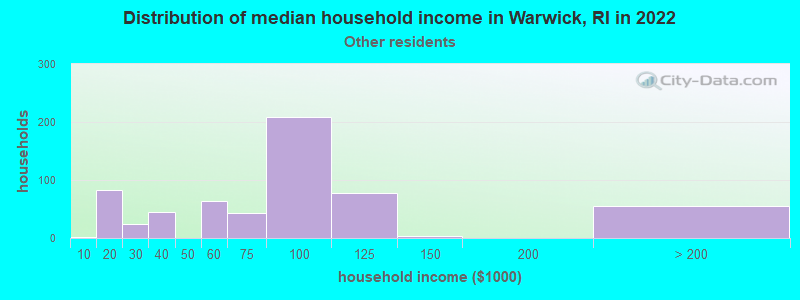
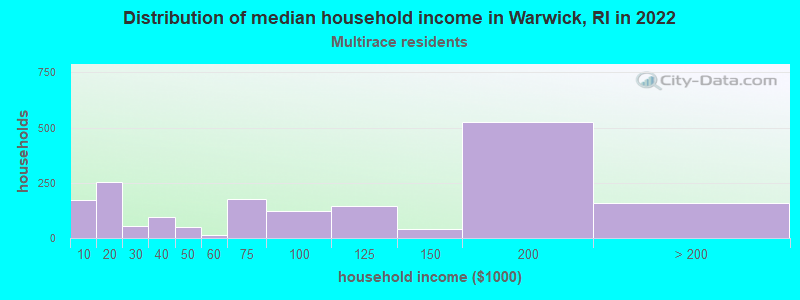
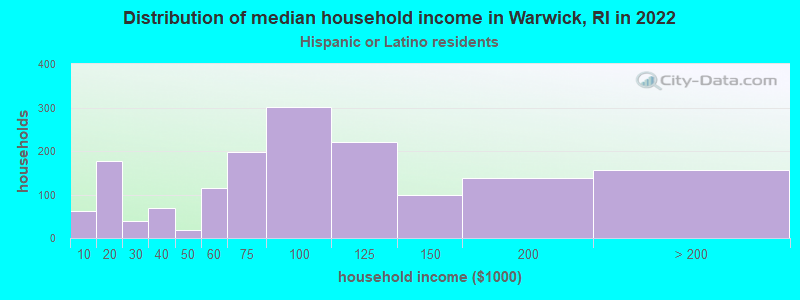
Income and house value in Warwick Median household income in 2022 $77,797 White non-Hispanic householders$115,135 Black householders$62,299 Asian householders$97,753 Some other race householders$65,681 Two or more races householders$86,736 Hispanic or Latino race householdersMedian 2022 house value $319,213 White Non-Hispanic householders$346,337 Black or African American householders$274,671 American Indian or Alaska Native householders $324,923 Asian householders$276,670 Some other race householders$279,811 Two or more races householders$295,514 Hispanic or Latino householders
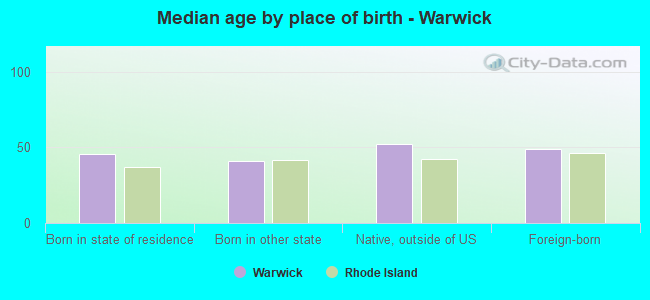
Median age by race in Warwick
47.2 Median age for White residents42.7 52.0 50.3 Median age for Black or African American residents56.6 28.2 -666,666,666.0 Median age for American Indian / Alaska Native residents-666,666,666.0 -666,666,666.0 41.6 Median age for Asian residents49.3 41.4 -666,666,666.0 Median age for Native Hawaiian / Pacific Islander residents-666,666,666.0 -666,666,666.0 33.5 Median age for Other race residents35.0 32.2 22.7 Median age for Two or more races residents14.5 27.8 47.8 Median age for White alone residents43.1 52.1 28.4 Median age for Hispanic or Latino residents29.4 22.9
Owner/renter occupied households by race in Warwick
House owners and renters - White residents 26,205 77.4% Owner occupied7,673 22.6% Renter occupiedHouse owners and renters - Black or African American residents 326 46.5% Owner occupied375 53.5% Renter occupiedHouse owners and renters - American Indian / Alaska Native residents 194 73.0% Owner occupied72 27.0% Renter occupiedHouse owners and renters - Asian residents 541 74.0% Owner occupied190 26.0% Renter occupiedHouse owners and renters - Other race residents 411 65.3% Owner occupied218 34.7% Renter occupiedHouse owners and renters - Two or more races residents 1,169 76.1% Owner occupied367 23.9% Renter occupiedHouse owners and renters - White alone residents 26,205 77.8% Owner occupied7,471 22.2% Renter occupiedHouse owners and renters - Hispanic or Latino residents 963 64.9% Owner occupied521 35.1% Renter occupied
Language usage in Warwick
English speakers - Total 92.4% of residents of Warwick speak English at home.
2.5% of residents speak Spanish at home 932 46.8% Speak English very well1,061 53.2% Speak English less than very well5.1% of residents speak other language at home 2,634 64.7% Speak English very well1,435 35.3% Speak English less than very well
English speakers - Born in the United States 95.5% of residents of Warwick speak English at home.
1.2% of residents speak Spanish at home 203 75.5% Speak English very well66 24.5% Speak English less than very well3.0% of residents speak other language at home 688 98.6% Speak English very well10 1.4% Speak English less than very well
English speakers - Native, born elsewhere 36.6% of residents of Warwick speak English at home.
26.9% of residents speak Spanish at home 89 35.2% Speak English very well164 64.8% Speak English less than very well8.8% of residents speak other language at home 19 22.9% Speak English very well64 77.1% Speak English less than very well
English speakers - Foreign-born 43.0% of residents of Warwick speak English at home.
11.3% of residents speak Spanish at home 305 54.4% Speak English very well256 45.6% Speak English less than very well45.1% of residents speak other language at home 1,117 50.0% Speak English very well1,119 50.0% Speak English less than very well
White (Caucasian) - Speak only English Native:
98.0% (65,368)Foreign-born:
47.2% (1,177)
White (Caucasian) - Speak another language Native:
2.0% (1,335)Foreign-born:
52.8% (1,319)
Black or African American - Speak only English Native:
87.0% (1,317)Foreign-born:
36.4% (221)
Black or African American - Speak another language Native:
13.1% (198)Foreign-born:
59.5% (361)
American Indian / Alaska Native - Speak another language Native:
46.2% (93)Foreign-born:
100.0% (154)
Asian - Speak only English Native:
40.8% (298)Foreign-born:
39.6% (439)
Asian - Speak another language Native:
56.1% (410)Foreign-born:
64.9% (719)
Other race - Speak only English Native:
49.5% (437)Foreign-born:
10.5% (29)
Other race - Speak another language Native:
40.9% (361)Foreign-born:
97.1% (268)
Two or more races - Speak only English Native:
87.3% (3,588)Foreign-born:
39.3% (277)
Two or more races - Speak another language Native:
11.9% (490)Foreign-born:
69.8% (492)
White alone - Speak only English Native:
98.1% (64,930)Foreign-born:
47.2% (1,177)
White alone - Speak another language Native:
1.9% (1,226)Foreign-born:
52.8% (1,319)
Hispanic or Latino - Speak only English Native:
78.7% (2,359)Foreign-born:
42.1% (427)
Hispanic or Latino - Speak another language Native:
21.3% (637)Foreign-born:
57.9% (588)
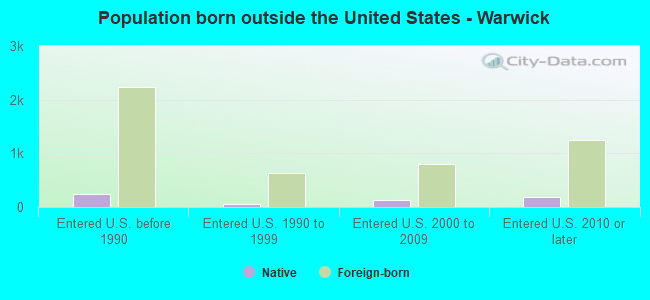
Foreign-born residents in Warwick 5,518 residents are foreign born (2.2% Asia , 2.0% Latin America , 1.8% Europe ).
This city:
6.6%Rhode Island:
14.4%
Marital status for residents in Warwick Marital status - White (Caucasian) population 15 years and over
Males 38.5% Never married44.6% Now married0.6% Separated5.3% Widowed11.0% DivorcedFemales 26.1% Never married43.2% Now married0.0% Separated10.3% Widowed20.3% DivorcedWomen who gave birth in the past 12 months Now married:
81.2% (591)Unmarried:
18.8% (137)
Women who did not give birth in the past 12 months Now married:
35.0% (4,291)Unmarried:
65.0% (7,985)
Marital status - Black or African American population 15 years and over
Males 48.2% Never married45.2% Now married2.3% Separated0.0% Widowed4.3% DivorcedFemales 17.6% Never married53.6% Now married0.3% Separated10.9% Widowed17.6% DivorcedWomen who gave birth in the past 12 months Now married:
0.0% (0)Unmarried:
100.0% (10)
Women who did not give birth in the past 12 months Now married:
55.9% (348)Unmarried:
44.1% (275)
Marital status - American Indian / Alaska Native population 15 years and over
Males 55.9% Never married7.1% Now married0.0% Separated0.0% Widowed37.0% DivorcedFemales 27.6% Never married64.1% Now married0.0% Separated8.3% Widowed0.0% DivorcedWomen who did not give birth in the past 12 months Now married:
44.9% (41)Unmarried:
55.1% (51)
Marital status - Asian population 15 years and over
Males 24.8% Never married72.7% Now married0.0% Separated0.9% Widowed1.6% DivorcedFemales 23.5% Never married66.9% Now married1.5% Separated6.2% Widowed1.9% DivorcedWomen who gave birth in the past 12 months Now married:
100.0% (59)Unmarried:
0.0% (0)
Women who did not give birth in the past 12 months Now married:
66.7% (516)Unmarried:
33.3% (258)
Marital status - Native Hawaiian / Pacific Islander population 15 years and over
Males 100.0% Never married0.0% Now married0.0% Separated0.0% Widowed0.0% DivorcedFemales 100.0% Never married0.0% Now married0.0% Separated0.0% Widowed0.0% DivorcedWomen who did not give birth in the past 12 months Now married:
0.0% (0)Unmarried:
100.0% (7)
Marital status - Other race population 15 years and over
Males 34.9% Never married63.2% Now married0.0% Separated0.0% Widowed1.9% DivorcedFemales 9.9% Never married72.2% Now married4.3% Separated1.9% Widowed11.7% DivorcedWomen who did not give birth in the past 12 months Now married:
71.7% (199)Unmarried:
28.3% (78)
Marital status - Two or more races population 15 years and over
Males 36.5% Never married59.1% Now married0.0% Separated0.0% Widowed4.4% DivorcedFemales 34.5% Never married46.6% Now married3.6% Separated2.3% Widowed13.0% DivorcedWomen who gave birth in the past 12 months Now married:
100.0% (72)Unmarried:
0.0% (0)
Women who did not give birth in the past 12 months Now married:
35.0% (493)Unmarried:
65.0% (914)
Marital status - White alone, not Hispanic / Latino population 15 years and over
Males 38.2% Never married44.7% Now married0.7% Separated5.3% Widowed11.1% DivorcedFemales 25.9% Never married43.3% Now married0.0% Separated10.4% Widowed20.4% DivorcedWomen who gave birth in the past 12 months Now married:
81.2% (591)Unmarried:
18.8% (137)
Women who did not give birth in the past 12 months Now married:
35.3% (4,291)Unmarried:
64.7% (7,876)
Marital status - Hispanic or Latino population 15 years and over
Males 43.2% Never married50.8% Now married0.0% Separated0.0% Widowed5.9% DivorcedFemales 33.8% Never married51.5% Now married1.3% Separated1.1% Widowed12.3% DivorcedWomen who gave birth in the past 12 months Now married:
30.0% (9)Unmarried:
70.0% (22)
Women who did not give birth in the past 12 months Now married:
48.8% (722)Unmarried:
51.2% (756)
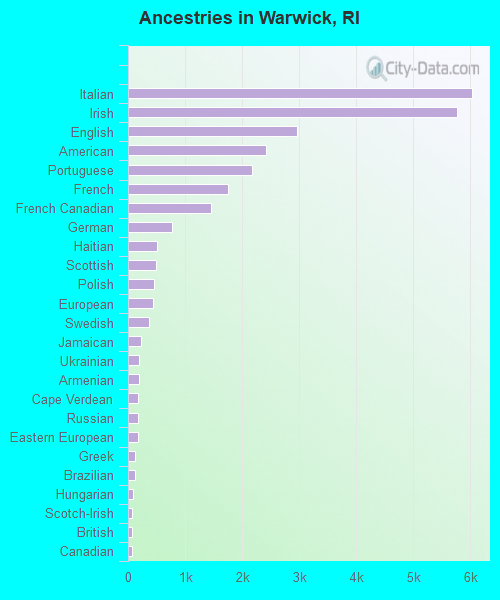
Ancestries in Warwick
6,028 17.5% Italian5,765 16.7% Irish2,965 8.6% English2,422 7.0% American2,167 6.3% Portuguese1,752 5.1% French1,463 4.2% French Canadian766 2.2% German506 1.5% Haitian498 1.4% Scottish451 1.3% Polish446 1.3% European373 1.1% Swedish230 0.7% Jamaican195 0.6% Ukrainian185 0.5% Armenian178 0.5% Cape Verdean177 0.5% Russian170 0.5% Eastern European129 0.4% Greek114 0.3% Brazilian79 0.2% Hungarian74 0.2% Scotch-Irish69 0.2% British64 0.2% Canadian62 0.2% Nigerian58 0.2% Moroccan50 0.1% Liberian49 0.1% Senegalese44 0.1% Syrian40 0.1% Scandinavian38 0.1% Lebanese35 0.1% Croatian33 0.10% Lithuanian28 0.08% Albanian28 0.08% Romanian28 0.08% Swiss27 0.08% Egyptian26 0.08% Norwegian24 0.07% Cypriot22 0.06% Czech20 0.06% Dutch18 0.05% Icelander17 0.05% Slovak16 0.05% Northern European14 0.04% Iranian13 0.04% Bahamian11 0.03% Celtic11 0.03% Palestinian9 0.03% African7 0.02% South African5 0.01% Austrian3 0.01% Belgian
Geographical mobility in Warwick Same house 1 year ago 66,553 93.1% White (Caucasian)1,636 86.5% Black or African American240 73.8% American Indian / Alaska Native1,896 83.5% Asian62 90.2% Native Hawaiian / Pacific Islander1,319 96.8% Other race4,648 82.2% Two or more races66,290 93.4% White alone, not Hispanic / Latino4,560 85.4% Hispanic or LatinoMoved within same county 1,474 2.1% White / Caucasian349 18.4% Black or African American2 0.6% American Indian / Alaska Native31 1.4% Asian7 10.2% Native Hawaiian / Pacific Islander4 0.3% Other race146 2.6% Two or more races1,365 1.9% White alone, not Hispanic / Latino356 6.7% Hispanic or LatinoMoved within same state 2,628 3.7% White / Caucasian82 4.4% Black or African American83 25.6% American Indian / Alaska Native231 10.2% Asian23 1.7% Other race427 7.6% Two or more races2,453 3.5% White alone, not Hispanic / Latino302 5.7% Hispanic or LatinoMoved from different state 743 1.0% White / Caucasian488 25.8% Black or African American1 0.3% American Indian / Alaska Native41 1.8% Asian284 5.0% Two or more races743 1.0% White alone, not Hispanic / Latino67 1.3% Hispanic or LatinoMoved from abroad 109 0.2% White1 0.1% Black or African American32 1.4% Asian20 1.5% Other race148 2.6% Two or more races109 0.2% White alone, not Hispanic / Latino103 1.9% Hispanic or Latino
Children Nativity (place of birth) in Warwick
Children under 6 years - Living with two parents Both parents native 2,272 100.0% NativeBoth parents foreign-born 351 100.0% NativeOne native, one foreign-born parent 363 100.0% NativeChildren under 6 years - Living with one parent Native parent 1,131 100.0% NativeForeign-born parent 106 100.0% NativeChildren 6 to 17 years - Living with two parents Both parents native 4,851 100.0% NativeBoth parents foreign-born 162 38.1% Native263 61.9% Foreign-bornOne native, one foreign-born parent 744 97.8% Native17 2.2% Foreign-bornChildren 6 to 17 years - Living with one parent Native parent 2,939 100.0% NativeForeign-born parent 292 55.4% Native235 44.6% Foreign-born
Grandparents responsible for own grandchildren in Warwick
Grandparents (30 to 59 years) White / Caucasian 276 50.8% Responsible for grandchildren268 49.2% Not responsible for grandchildrenOther race 17 100.0% Not responsible for grandchildrenWhite alone, not Hispanic / Latino 260 46.7% Responsible for grandchildren296 53.3% Not responsible for grandchildrenHispanic or Latino 51 78.5% Responsible for grandchildren14 21.5% Not responsible for grandchildrenGrandparents (60 years and over) White / Caucasian 157 23.6% Responsible for grandchildren506 76.4% Not responsible for grandchildrenWhite alone, not Hispanic / Latino 167 24.2% Responsible for grandchildren523 75.8% Not responsible for grandchildrenHispanic or Latino 40 100.0% Not responsible for grandchildren