Races in University City, Missouri (MO) Detailed Stats
Data:
Races - White alone (%)
Races - White alone (% change since 2000)
Races - Black alone (%)
Races - Black alone (% change since 2000)
Races - American Indian alone (%)
Races - American Indian alone (% change since 2000)
Races - Asian alone (%)
Races - Asian alone (% change since 2000)
Races - Hispanic (%)
Races - Hispanic (% change since 2000)
Races - Native Hawaiian and Other Pacific Islander alone (%)
Races - Native Hawaiian and Other Pacific Islander alone (% change since 2000)
Races - Two or more races(%)
Races - Two or more races(% change since 2000)
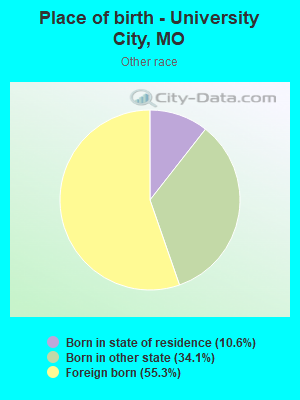
Races - Other race alone (%)
Races - Other race alone (% change since 2000)
Racial diversity
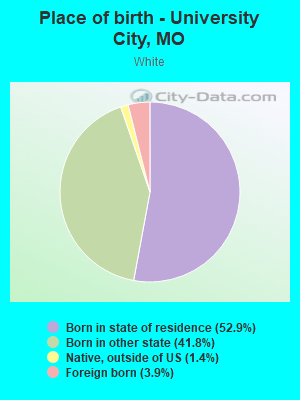
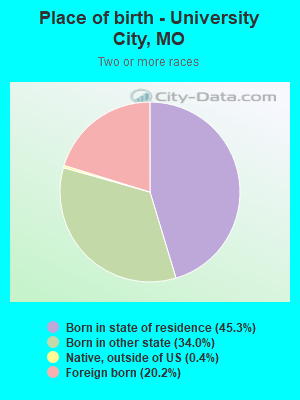
Place of birth - Born in state of residence (%)
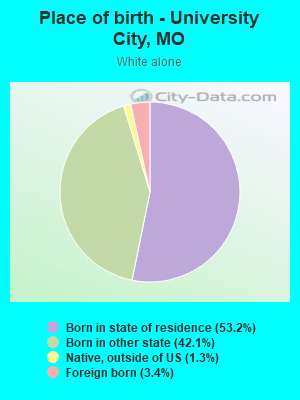
Place of birth - Born in state of residence (%) - White
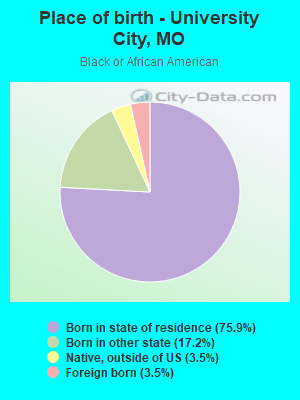
Place of birth - Born in state of residence (%) - Black or African American
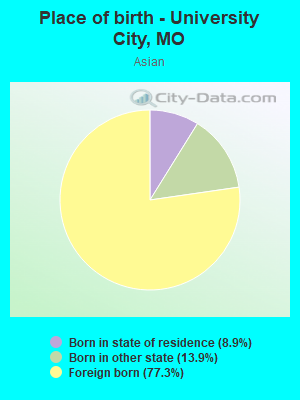
Place of birth - Born in state of residence (%) - Asian
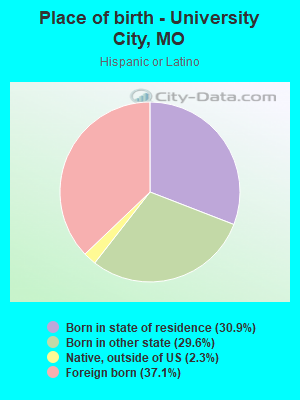
Place of birth - Born in state of residence (%) - Hispanic or Latino
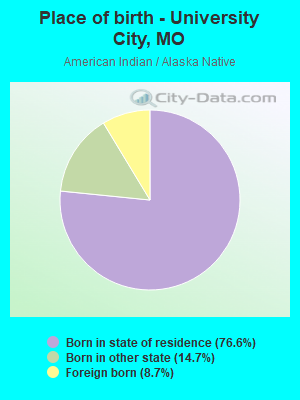
Place of birth - Born in state of residence (%) - American Indian and Alaska Native
Place of birth - Born in state of residence (%) - Multirace
Place of birth - Born in state of residence (%) - Other Race
Place of birth - Born in other state (%)
Place of birth - Born in other state (%) - White
Place of birth - Born in other state (%) - Black or African American
Place of birth - Born in other state (%) - Asian
Place of birth - Born in other state (%) - Hispanic or Latino
Place of birth - Born in other state (%) - American Indian and Alaska Native
Place of birth - Born in other state (%) - Multirace
Place of birth - Born in other state (%) - Other Race
Place of birth - Native, outside of US (%)
Place of birth - Native, outside of US (%) - White
Place of birth - Native, outside of US (%) - Black or African American
Place of birth - Native, outside of US (%) - Asian
Place of birth - Native, outside of US (%) - Hispanic or Latino
Place of birth - Native, outside of US (%) - American Indian and Alaska Native
Place of birth - Native, outside of US (%) - Multirace
Place of birth - Native, outside of US (%) - Other Race
Place of birth - Foreign born (%)
Place of birth - Foreign born (%) - White
Place of birth - Foreign born (%) - Black or African American
Place of birth - Foreign born (%) - Asian
Place of birth - Foreign born (%) - Hispanic or Latino
Place of birth - Foreign born (%) - American Indian and Alaska Native
Place of birth - Foreign born (%) - Multirace
Place of birth - Foreign born (%) - Other Race
Residents speaking English at home (%)
Residents speaking English at home - Born in the United States (%)
Residents speaking English at home - Native, born elsewhere (%)
Residents speaking English at home - Foreign born (%)
Residents speaking Spanish at home (%)
Residents speaking Spanish at home - Born in the United States (%)
Residents speaking Spanish at home - Native, born elsewhere (%)
Residents speaking Spanish at home - Foreign born (%)
Residents speaking other language at home (%)
Residents speaking other language at home - Born in the United States (%)
Residents speaking other language at home - Native, born elsewhere (%)
Residents speaking other language at home - Foreign born (%)
Marital status - Never married (%)
Marital status - Now married (%)
Marital status - Separated (%)
Marital status - Widowed (%)
Marital status - Divorced (%)
Ancestries Reported - Arab (%)
Ancestries Reported - Czech (%)
Ancestries Reported - Danish (%)
Ancestries Reported - Dutch (%)
Ancestries Reported - English (%)
Ancestries Reported - French (%)
Ancestries Reported - French Canadian (%)
Ancestries Reported - German (%)
Ancestries Reported - Greek (%)
Ancestries Reported - Hungarian (%)
Ancestries Reported - Irish (%)
Ancestries Reported - Italian (%)
Ancestries Reported - Lithuanian (%)
Ancestries Reported - Norwegian (%)
Ancestries Reported - Polish (%)
Ancestries Reported - Portuguese (%)
Ancestries Reported - Russian (%)
Ancestries Reported - Scotch-Irish (%)
Ancestries Reported - Scottish (%)
Ancestries Reported - Slovak (%)
Ancestries Reported - Subsaharan African (%)
Ancestries Reported - Swedish (%)
Ancestries Reported - Swiss (%)
Ancestries Reported - Ukrainian (%)
Ancestries Reported - United States (%)
Ancestries Reported - Welsh (%)
Ancestries Reported - West Indian (%)
Ancestries Reported - Other (%)
Geographical mobility - Same house 1 year ago (%)
Geographical mobility - Same house 1 year ago (%) - White
Geographical mobility - Same house 1 year ago (%) - Black or African American
Geographical mobility - Same house 1 year ago (%) - Asian
Geographical mobility - Same house 1 year ago (%) - Hispanic or Latino
Geographical mobility - Same house 1 year ago (%) - American Indian and Alaska Native
Geographical mobility - Same house 1 year ago (%) - Multirace
Geographical mobility - Same house 1 year ago (%) - Other Race
Geographical mobility - Moved within same county (%)
Geographical mobility - Moved within same county (%) - White
Geographical mobility - Moved within same county (%) - Black or African American
Geographical mobility - Moved within same county (%) - Asian
Geographical mobility - Moved within same county (%) - Hispanic or Latino
Geographical mobility - Moved within same county (%) - American Indian and Alaska Native
Geographical mobility - Moved within same county (%) - Multirace
Geographical mobility - Moved within same county (%) - Other Race
Geographical mobility - Moved from different county within same state (%)
Geographical mobility - Moved from different county within same state (%) - White
Geographical mobility - Moved from different county within same state (%) - Black or African American
Geographical mobility - Moved from different county within same state (%) - Asian
Geographical mobility - Moved from different county within same state (%) - Hispanic or Latino
Geographical mobility - Moved from different county within same state (%) - American Indian and Alaska Native
Geographical mobility - Moved from different county within same state (%) - Multirace
Geographical mobility - Moved from different county within same state (%) - Other Race
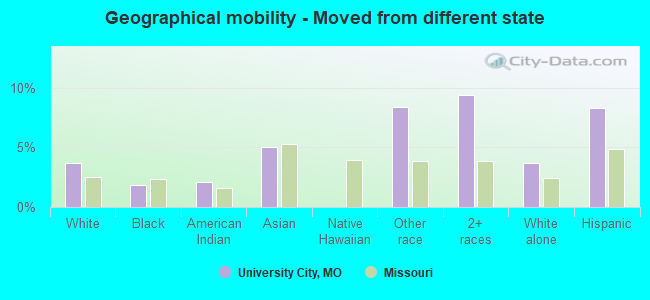
Geographical mobility - Moved from different state (%)
Geographical mobility - Moved from different state (%) - White
Geographical mobility - Moved from different state (%) - Black or African American
Geographical mobility - Moved from different state (%) - Asian
Geographical mobility - Moved from different state (%) - Hispanic or Latino
Geographical mobility - Moved from different state (%) - American Indian and Alaska Native
Geographical mobility - Moved from different state (%) - Multirace
Geographical mobility - Moved from different state (%) - Other Race
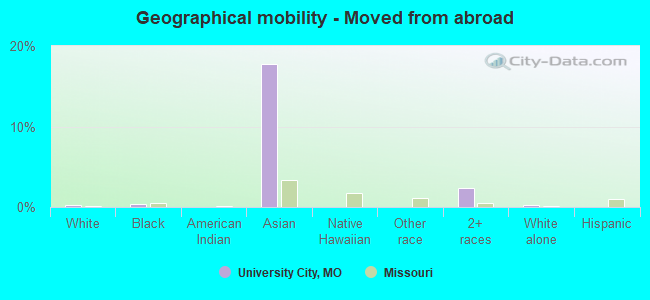
Geographical mobility - Moved from abroad (%)
Geographical mobility - Moved from abroad (%) - White
Geographical mobility - Moved from abroad (%) - Black or African American
Geographical mobility - Moved from abroad (%) - Asian
Geographical mobility - Moved from abroad (%) - Hispanic or Latino
Geographical mobility - Moved from abroad (%) - American Indian and Alaska Native
Geographical mobility - Moved from abroad (%) - Multirace
Geographical mobility - Moved from abroad (%) - Other Race
Place of birth for the foreign-born population - Ireland (%)
Place of birth for the foreign-born population - Denmark (%)
Place of birth for the foreign-born population - Norway (%)
Place of birth for the foreign-born population - Sweden (%)
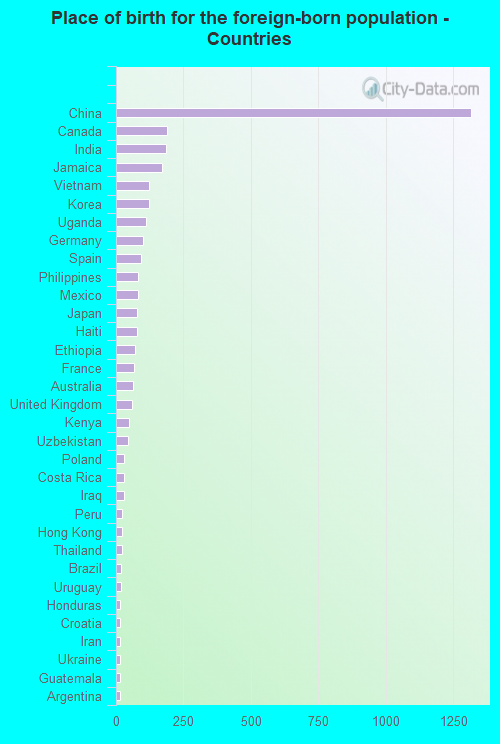
Place of birth for the foreign-born population - United Kingdom (%)
Place of birth for the foreign-born population - England (%)
Place of birth for the foreign-born population - Scotland (%)
Place of birth for the foreign-born population - Other Northern Europe (%)
Place of birth for the foreign-born population - Austria (%)
Place of birth for the foreign-born population - Belgium (%)
Place of birth for the foreign-born population - France (%)
Place of birth for the foreign-born population - Germany (%)
Place of birth for the foreign-born population - Netherlands (%)
Place of birth for the foreign-born population - Switzerland (%)
Place of birth for the foreign-born population - Other Western Europe (%)
Place of birth for the foreign-born population - Greece (%)
Place of birth for the foreign-born population - Italy (%)
Place of birth for the foreign-born population - Portugal (%)
Place of birth for the foreign-born population - Spain (%)
Place of birth for the foreign-born population - Other Southern Europe (%)
Place of birth for the foreign-born population - Albania (%)
Place of birth for the foreign-born population - Belarus (%)
Place of birth for the foreign-born population - Bosnia and Herzegovina (%)
Place of birth for the foreign-born population - Bulgaria (%)
Place of birth for the foreign-born population - Croatia (%)
Place of birth for the foreign-born population - Czechoslovakia (%)
Place of birth for the foreign-born population - Hungary (%)
Place of birth for the foreign-born population - Latvia (%)
Place of birth for the foreign-born population - Lithuania (%)
Place of birth for the foreign-born population - North Macedonia (Macedonia) (%)
Place of birth for the foreign-born population - Moldova (%)
Place of birth for the foreign-born population - Poland (%)
Place of birth for the foreign-born population - Romania (%)
Place of birth for the foreign-born population - Russia (%)
Place of birth for the foreign-born population - Serbia (%)
Place of birth for the foreign-born population - Ukraine (%)
Place of birth for the foreign-born population - Other Eastern Europe (%)
Place of birth for the foreign-born population - China (%)
Place of birth for the foreign-born population - Hong Kong (%)
Place of birth for the foreign-born population - Taiwan (%)
Place of birth for the foreign-born population - Japan (%)
Place of birth for the foreign-born population - Korea (%)
Place of birth for the foreign-born population - Other Eastern Asia (%)
Place of birth for the foreign-born population - Afghanistan (%)
Place of birth for the foreign-born population - Bangladesh (%)
Place of birth for the foreign-born population - India (%)
Place of birth for the foreign-born population - Iran (%)
Place of birth for the foreign-born population - Kazakhstan (%)
Place of birth for the foreign-born population - Nepal (%)
Place of birth for the foreign-born population - Pakistan (%)
Place of birth for the foreign-born population - Sri Lanka (%)
Place of birth for the foreign-born population - Uzbekistan (%)
Place of birth for the foreign-born population - Other South Central Asia (%)
Place of birth for the foreign-born population - Burma (%)
Place of birth for the foreign-born population - Cambodia (%)
Place of birth for the foreign-born population - Indonesia (%)
Place of birth for the foreign-born population - Laos (%)
Place of birth for the foreign-born population - Malaysia (%)
Place of birth for the foreign-born population - Philippines (%)
Place of birth for the foreign-born population - Singapore (%)
Place of birth for the foreign-born population - Thailand (%)
Place of birth for the foreign-born population - Vietnam (%)
Place of birth for the foreign-born population - Other South Eastern Asia (%)
Place of birth for the foreign-born population - Armenia (%)
Place of birth for the foreign-born population - Iraq (%)
Place of birth for the foreign-born population - Israel (%)
Place of birth for the foreign-born population - Jordan (%)
Place of birth for the foreign-born population - Kuwait (%)
Place of birth for the foreign-born population - Lebanon (%)
Place of birth for the foreign-born population - Saudi Arabia (%)
Place of birth for the foreign-born population - Syria (%)
Place of birth for the foreign-born population - Turkey (%)
Place of birth for the foreign-born population - Yemen (%)
Place of birth for the foreign-born population - Other Western Asia (%)
Place of birth for the foreign-born population - Eritrea (%)
Place of birth for the foreign-born population - Ethiopia (%)
Place of birth for the foreign-born population - Kenya (%)
Place of birth for the foreign-born population - Somalia (%)
Place of birth for the foreign-born population - Uganda (%)
Place of birth for the foreign-born population - Zimbabwe (%)
Place of birth for the foreign-born population - Other Eastern Africa (%)
Place of birth for the foreign-born population - Cameroon (%)
Place of birth for the foreign-born population - Congo (%)
Place of birth for the foreign-born population - Democratic Republic of Congo (Zaire) (%)
Place of birth for the foreign-born population - Other Middle Africa (%)
Place of birth for the foreign-born population - Egypt (%)
Place of birth for the foreign-born population - Morocco (%)
Place of birth for the foreign-born population - Sudan (%)
Place of birth for the foreign-born population - Other Northern Africa (%)
Place of birth for the foreign-born population - South Africa (%)
Place of birth for the foreign-born population - Other Southern Africa (%)
Place of birth for the foreign-born population - Cabo Verde (%)
Place of birth for the foreign-born population - Ghana (%)
Place of birth for the foreign-born population - Liberia (%)
Place of birth for the foreign-born population - Nigeria (%)
Place of birth for the foreign-born population - Senegal (%)
Place of birth for the foreign-born population - Sierra Leone (%)
Place of birth for the foreign-born population - Other Western Africa (%)
Place of birth for the foreign-born population - Australia (%)
Place of birth for the foreign-born population - New Zealand (%)
Place of birth for the foreign-born population - Fiji (%)
Place of birth for the foreign-born population - Micronesia (%)
Place of birth for the foreign-born population - Bahamas (%)
Place of birth for the foreign-born population - Barbados (%)
Place of birth for the foreign-born population - Cuba (%)
Place of birth for the foreign-born population - Dominica (%)
Place of birth for the foreign-born population - Dominican Republic (%)
Place of birth for the foreign-born population - Grenada (%)
Place of birth for the foreign-born population - Haiti (%)
Place of birth for the foreign-born population - Jamaica (%)
Place of birth for the foreign-born population - St. Vincent and the Grenadines (%)
Place of birth for the foreign-born population - Trinidad and Tobago (%)
Place of birth for the foreign-born population - West Indies (%)
Place of birth for the foreign-born population - Other Caribbean (%)
Place of birth for the foreign-born population - Belize (%)
Place of birth for the foreign-born population - Costa Rica (%)
Place of birth for the foreign-born population - El Salvador (%)
Place of birth for the foreign-born population - Guatemala (%)
Place of birth for the foreign-born population - Honduras (%)
Place of birth for the foreign-born population - Mexico (%)
Place of birth for the foreign-born population - Nicaragua (%)
Place of birth for the foreign-born population - Panama (%)
Place of birth for the foreign-born population - Other Central America (%)
Place of birth for the foreign-born population - Argentina (%)
Place of birth for the foreign-born population - Bolivia (%)
Place of birth for the foreign-born population - Brazil (%)
Place of birth for the foreign-born population - Chile (%)
Place of birth for the foreign-born population - Colombia (%)
Place of birth for the foreign-born population - Ecuador (%)
Place of birth for the foreign-born population - Guyana (%)
Place of birth for the foreign-born population - Peru (%)
Place of birth for the foreign-born population - Uruguay (%)
Place of birth for the foreign-born population - Venezuela (%)
Place of birth for the foreign-born population - Other South America (%)
Place of birth for the foreign-born population - Canada (%)
Place of birth for the foreign-born population - Other Northern America (%)
Place of birth for the foreign-born population - Other (%)
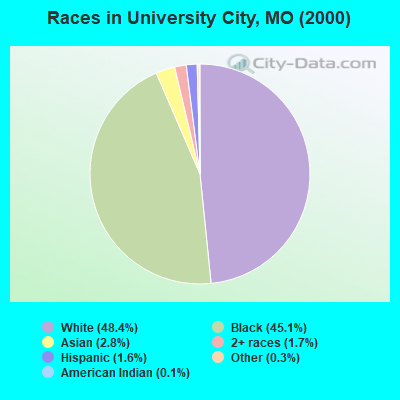
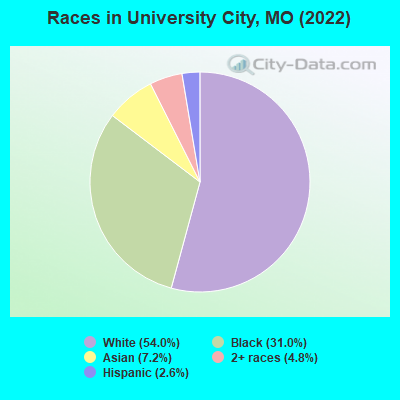
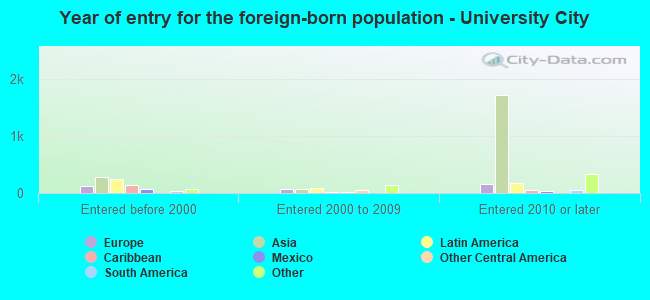
According to 2022 data, the most numerous races in University City, MO are White alone (18,643 residents), Black alone (10,690 residents), and Two or more races (1,672 residents). 89.5% of University City residents speak English at home. 9.9% of University City, MO residents are foreign-born (6.0% born in Asia, 1.4% born in Latin America, 1.2% born in Europe), which is 59.4% greater than the foreign-born rate of 4.0% across the entire state of Missouri.
Race distribution in University City
2000 2022
4,686,474 83.8% White alone 625,667 11.2% Black alone 118,592 2.1% Hispanic 71,905 1.3% Two or more races 61,041 1.1% Asian alone 23,302 0.4% American Indian alone 5,291 0.09% Other race alone 2,939 0.05% Native Hawaiian and Other
4,733,411 76.6% White alone 656,739 10.6% Black alone 316,300 5.1% Two or more races 291,763 4.7% Hispanic 132,436 2.1% Asian alone 27,467 0.4% Other race alone 12,313 0.2% American Indian alone 7,528 0.1% Native Hawaiian and Other
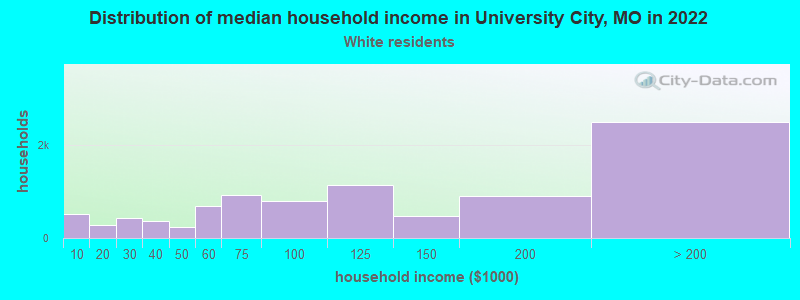
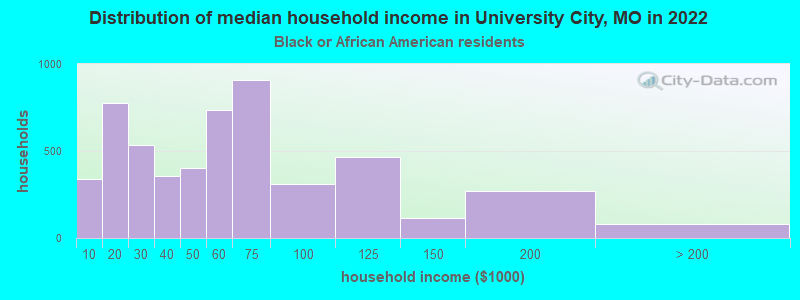
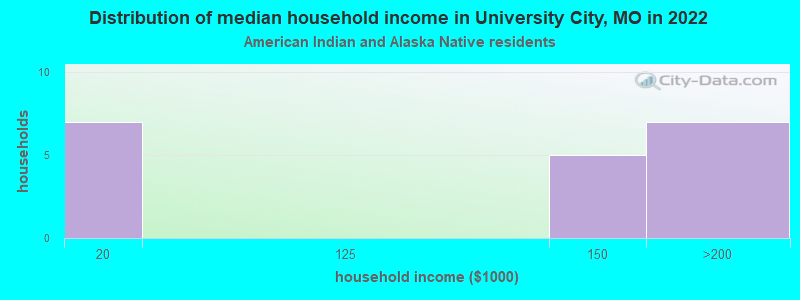
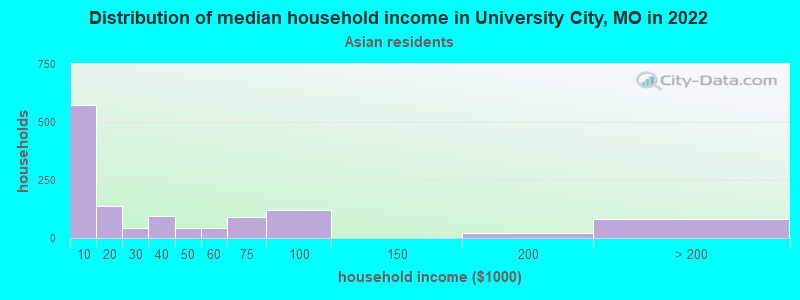
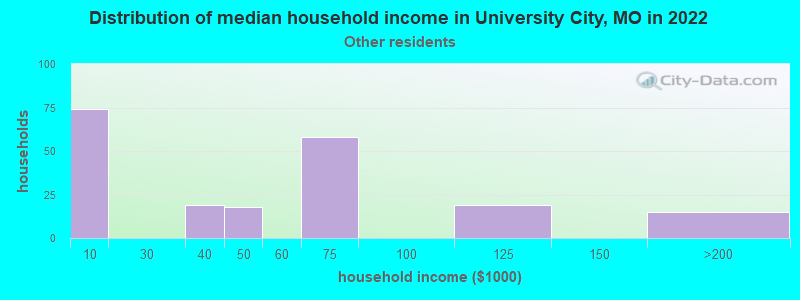
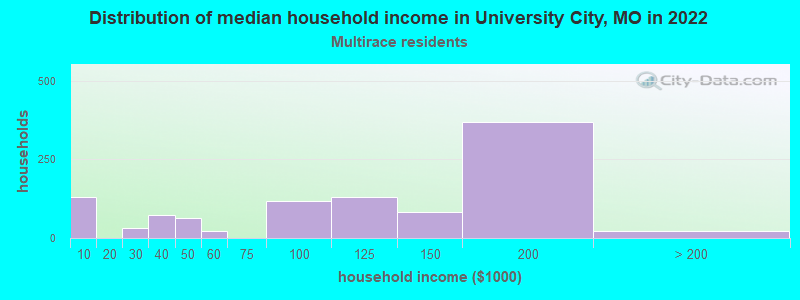
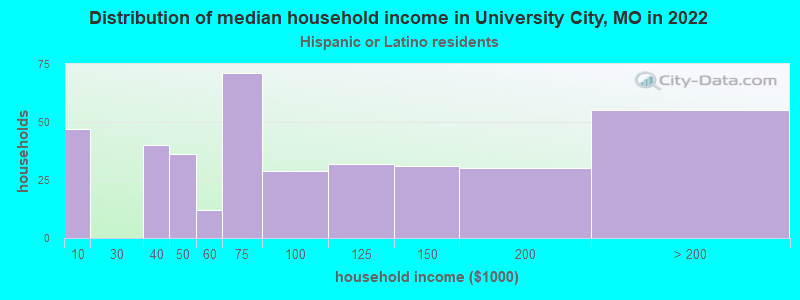
Income and house value in University City Median household income in 2022 $111,744 White non-Hispanic householders$53,505 Black householders$28,153 Asian householders$107,559 Two or more races householdersMedian 2022 house value $650,016 White Non-Hispanic householders$197,777 Black or African American householders$295,886 American Indian or Alaska Native householders $652,197 Asian householders$214,595 Some other race householders$235,152 Two or more races householders$412,684 Hispanic or Latino householders
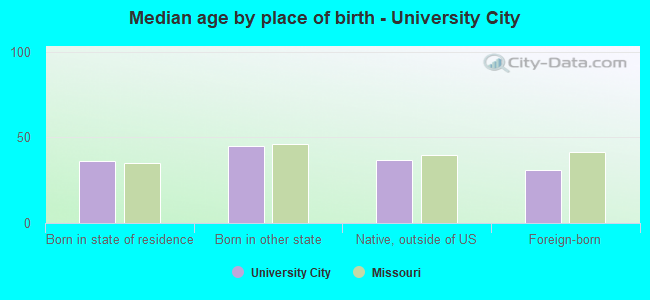
Median age by race in University City
40.7 Median age for White residents41.9 39.6 42.4 Median age for Black or African American residents40.3 46.1 36.0 Median age for American Indian / Alaska Native residents44.8 28.3 24.7 Median age for Asian residents26.7 25.3 -710,303,029.6 Median age for Native Hawaiian / Pacific Islander residents-1,449,781,657.9 -752,136,751.4 25.4 Median age for Other race residents30.4 26.0 32.9 Median age for Two or more races residents35.6 33.5 41.0 Median age for White alone residents42.6 39.8 30.2 Median age for Hispanic or Latino residents29.8 27.1
Owner/renter occupied households by race in University City
House owners and renters - White residents 5,807 62.6% Owner occupied3,470 37.4% Renter occupiedHouse owners and renters - Black or African American residents 3,042 57.5% Owner occupied2,250 42.5% Renter occupiedHouse owners and renters - American Indian / Alaska Native residents 9 66.4% Owner occupied5 33.6% Renter occupiedHouse owners and renters - Asian residents 123 11.2% Owner occupied982 88.8% Renter occupiedHouse owners and renters - Native Hawaiian / Pacific Islander residents 4 100.0% Renter occupiedHouse owners and renters - Other race residents 31 21.1% Owner occupied115 78.9% Renter occupiedHouse owners and renters - Two or more races residents 240 19.9% Owner occupied968 80.1% Renter occupiedHouse owners and renters - White alone residents 5,769 62.6% Owner occupied3,449 37.4% Renter occupiedHouse owners and renters - Hispanic or Latino residents 163 41.7% Owner occupied228 58.3% Renter occupied
Language usage in University City
English speakers - Total 89.5% of residents of University City speak English at home.
1.9% of residents speak Spanish at home 559 89.3% Speak English very well67 10.7% Speak English less than very well8.5% of residents speak other language at home 1,852 66.8% Speak English very well919 33.2% Speak English less than very well
English speakers - Born in the United States 94.5% of residents of University City speak English at home.
2.1% of residents speak Spanish at home 223 100.0% Speak English very well3.5% of residents speak other language at home 344 92.7% Speak English very well27 7.3% Speak English less than very well
All residents speak only English at home
English speakers - Foreign-born 28.8% of residents of University City speak English at home.
8.5% of residents speak Spanish at home 244 83.6% Speak English very well48 16.4% Speak English less than very well62.2% of residents speak other language at home 1,290 60.5% Speak English very well841 39.5% Speak English less than very well
White (Caucasian) - Speak only English Native:
98.2% (16,921)Foreign-born:
47.8% (352)
White (Caucasian) - Speak another language Native:
1.8% (308)Foreign-born:
46.8% (344)
Black or African American - Speak only English Native:
97.3% (9,510)Foreign-born:
15.9% (58)
Black or African American - Speak another language Native:
3.0% (293)Foreign-born:
79.7% (290)
Asian - Speak only English Native:
68.1% (383)Foreign-born:
16.9% (308)
Asian - Speak another language Native:
35.0% (197)Foreign-born:
83.3% (1,523)
Other race - Speak another language Native:
56.2% (73)Foreign-born:
90.6% (147)
Two or more races - Speak only English Native:
89.5% (1,124)Foreign-born:
42.2% (180)
Two or more races - Speak another language Native:
11.1% (139)Foreign-born:
32.5% (139)
White alone - Speak only English Native:
98.1% (16,818)Foreign-born:
54.6% (350)
White alone - Speak another language Native:
1.9% (320)Foreign-born:
38.5% (247)
Hispanic or Latino - Speak only English Native:
82.4% (432)Foreign-born:
3.7% (12)
Hispanic or Latino - Speak another language Native:
21.6% (113)Foreign-born:
97.1% (322)
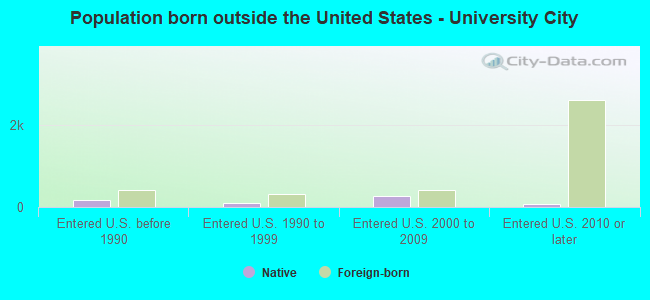
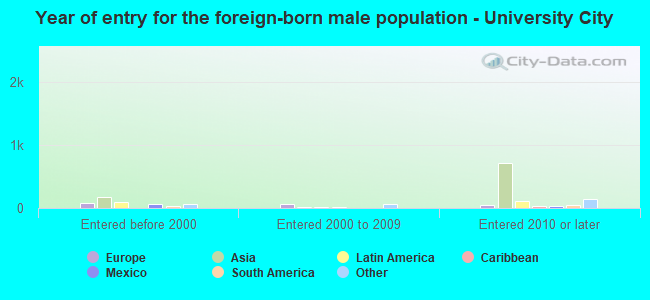
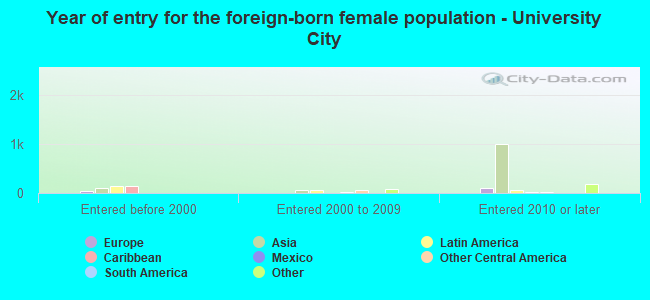
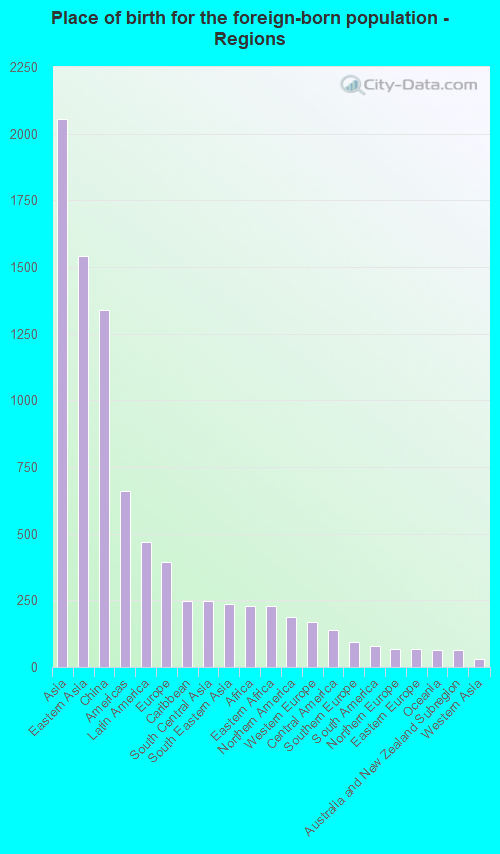
Foreign-born residents in University City 3,403 residents are foreign born (6.0% Asia , 1.4% Latin America , 1.2% Europe ).
This city:
9.9%Missouri:
4.2%
Marital status for residents in University City Marital status - White (Caucasian) population 15 years and over
Males 36.4% Never married51.9% Now married0.0% Separated3.7% Widowed7.9% DivorcedFemales 33.4% Never married47.0% Now married1.0% Separated5.1% Widowed13.5% DivorcedWomen who gave birth in the past 12 months Now married:
100.0% (388)Unmarried:
0.0% (0)
Women who did not give birth in the past 12 months Now married:
38.1% (1,755)Unmarried:
61.9% (2,854)
Marital status - Black or African American population 15 years and over
Males 37.5% Never married44.4% Now married2.6% Separated3.3% Widowed12.1% DivorcedFemales 46.4% Never married24.0% Now married3.1% Separated7.8% Widowed18.7% DivorcedWomen who gave birth in the past 12 months Now married:
59.3% (60)Unmarried:
40.7% (41)
Women who did not give birth in the past 12 months Now married:
19.4% (515)Unmarried:
80.6% (2,138)
Marital status - American Indian / Alaska Native population 15 years and over
Males 11.1% Never married88.9% Now married0.0% Separated0.0% Widowed0.0% DivorcedFemales 21.7% Never married47.8% Now married0.0% Separated0.0% Widowed30.4% DivorcedWomen who did not give birth in the past 12 months Now married:
68.8% (11)Unmarried:
31.2% (5)
Marital status - Asian population 15 years and over
Males 55.8% Never married41.4% Now married0.0% Separated2.8% Widowed0.0% DivorcedFemales 64.5% Never married27.3% Now married1.3% Separated1.2% Widowed5.8% DivorcedWomen who gave birth in the past 12 months Now married:
100.0% (39)Unmarried:
0.0% (0)
Women who did not give birth in the past 12 months Now married:
19.1% (224)Unmarried:
80.9% (951)
Marital status - Other race population 15 years and over
Males 42.6% Never married46.4% Now married10.9% Separated0.0% Widowed0.0% DivorcedFemales 36.0% Never married64.0% Now married0.0% Separated0.0% Widowed0.0% DivorcedWomen who gave birth in the past 12 months Now married:
100.0% (17)Unmarried:
0.0% (0)
Women who did not give birth in the past 12 months Now married:
51.8% (46)Unmarried:
48.2% (43)
Marital status - Two or more races population 15 years and over
Males 35.7% Never married55.9% Now married0.0% Separated0.0% Widowed8.4% DivorcedFemales 59.3% Never married34.2% Now married0.6% Separated0.0% Widowed5.9% DivorcedWomen who gave birth in the past 12 months Now married:
100.0% (1)Unmarried:
0.0% (0)
Women who did not give birth in the past 12 months Now married:
35.7% (200)Unmarried:
64.3% (360)
Marital status - White alone, not Hispanic / Latino population 15 years and over
Males 36.4% Never married51.8% Now married0.0% Separated3.8% Widowed8.0% DivorcedFemales 33.3% Never married47.0% Now married1.0% Separated5.1% Widowed13.5% DivorcedWomen who gave birth in the past 12 months Now married:
100.0% (391)Unmarried:
0.0% (0)
Women who did not give birth in the past 12 months Now married:
37.8% (1,715)Unmarried:
62.2% (2,819)
Marital status - Hispanic or Latino population 15 years and over
Males 43.3% Never married47.5% Now married4.5% Separated0.0% Widowed4.7% DivorcedFemales 43.0% Never married41.3% Now married0.0% Separated1.7% Widowed14.0% DivorcedWomen who gave birth in the past 12 months Now married:
100.0% (17)Unmarried:
0.0% (0)
Women who did not give birth in the past 12 months Now married:
38.4% (111)Unmarried:
61.6% (177)
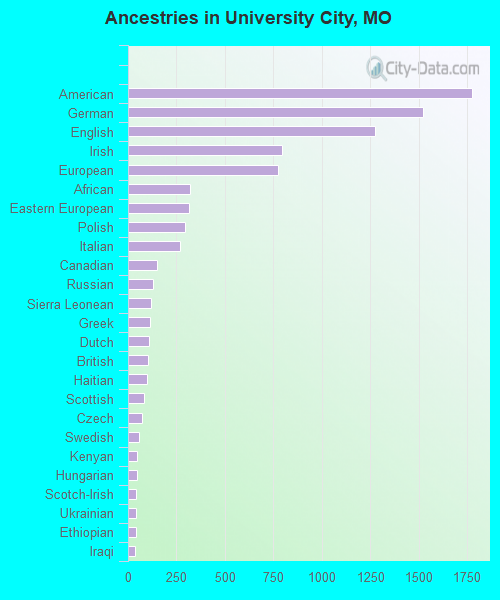
Ancestries in University City
1,775 9.4% American1,524 8.0% German1,274 6.7% English796 4.2% Irish774 4.1% European321 1.7% African317 1.7% Eastern European293 1.5% Polish270 1.4% Italian152 0.8% Canadian127 0.7% Russian117 0.6% Sierra Leonean113 0.6% Greek106 0.6% Dutch102 0.5% British97 0.5% Haitian81 0.4% Scottish73 0.4% Czech59 0.3% Swedish49 0.3% Kenyan48 0.3% Hungarian43 0.2% Scotch-Irish41 0.2% Ukrainian40 0.2% Ethiopian37 0.2% Iraqi36 0.2% French33 0.2% Northern European33 0.2% Alsatian28 0.1% Austrian25 0.1% Norwegian25 0.1% Welsh22 0.1% Lithuanian20 0.1% Croatian13 0.07% Nigerian11 0.06% Lebanese11 0.06% Iranian8 0.04% Finnish7 0.04% Romanian7 0.04% Sudanese1 0.01% Syrian1 0.01% Swiss
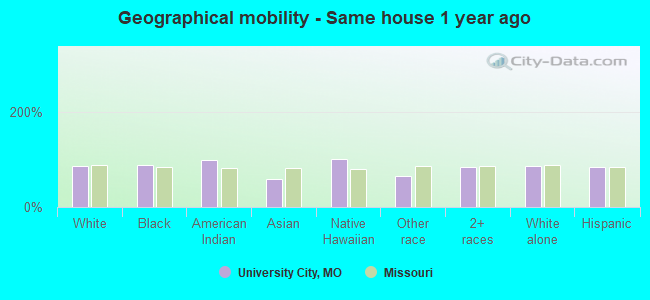
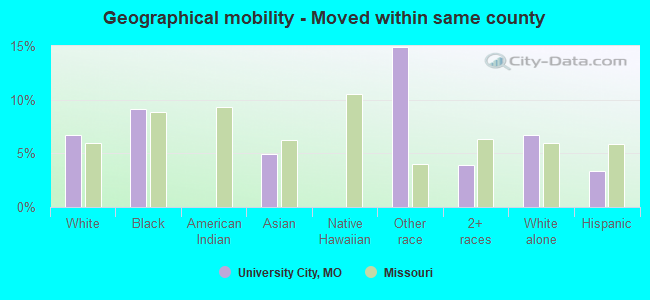
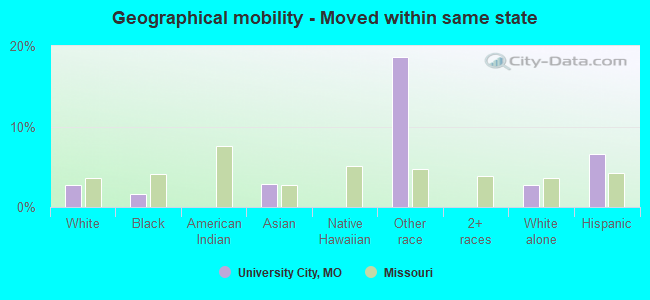
Geographical mobility in University City Same house 1 year ago 15,944 86.4% White (Caucasian)9,239 87.0% Black or African American49 99.5% American Indian / Alaska Native1,433 59.5% Asian9 100.0% Native Hawaiian / Pacific Islander190 65.6% Other race1,718 84.5% Two or more races15,787 86.3% White alone, not Hispanic / Latino739 82.8% Hispanic or LatinoMoved within same county 1,239 6.7% White / Caucasian972 9.2% Black or African American118 4.9% Asian43 14.9% Other race80 3.9% Two or more races1,225 6.7% White alone, not Hispanic / Latino30 3.4% Hispanic or LatinoMoved within same state 510 2.8% White / Caucasian171 1.6% Black or African American70 2.9% Asian54 18.6% Other race505 2.8% White alone, not Hispanic / Latino59 6.6% Hispanic or LatinoMoved from different state 680 3.7% White / Caucasian200 1.9% Black or African American1 2.1% American Indian / Alaska Native122 5.1% Asian24 8.4% Other race191 9.4% Two or more races682 3.7% White alone, not Hispanic / Latino74 8.3% Hispanic or LatinoMoved from abroad 49 0.3% White45 0.4% Black or African American428 17.8% Asian47 2.3% Two or more races50 0.3% White alone, not Hispanic / Latino
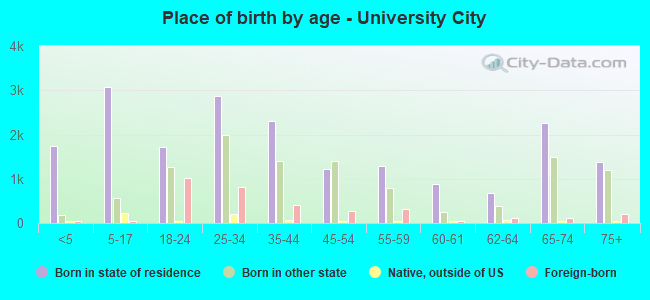
Children Nativity (place of birth) in University City
Children under 6 years - Living with two parents Both parents native 942 100.0% NativeBoth parents foreign-born 122 100.0% NativeOne native, one foreign-born parent 254 100.0% NativeChildren under 6 years - Living with one parent Native parent 796 100.0% NativeChildren 6 to 17 years - Living with two parents Both parents native 1,975 100.0% NativeBoth parents foreign-born 21 41.0% Native30 59.0% Foreign-bornOne native, one foreign-born parent 437 100.0% NativeChildren 6 to 17 years - Living with one parent Native parent 747 100.0% NativeForeign-born parent 14 48.6% Native15 51.4% Foreign-born
Grandparents responsible for own grandchildren in University City
Grandparents (30 to 59 years) White / Caucasian 29 100.0% Not responsible for grandchildrenBlack or African American 19 65.0% Responsible for grandchildren10 35.0% Not responsible for grandchildrenWhite alone, not Hispanic / Latino 29 100.0% Not responsible for grandchildrenGrandparents (60 years and over) Black or African American 40 26.1% Responsible for grandchildren114 73.9% Not responsible for grandchildren