Races in Tulsa, Oklahoma (OK) Detailed Stats
Data:
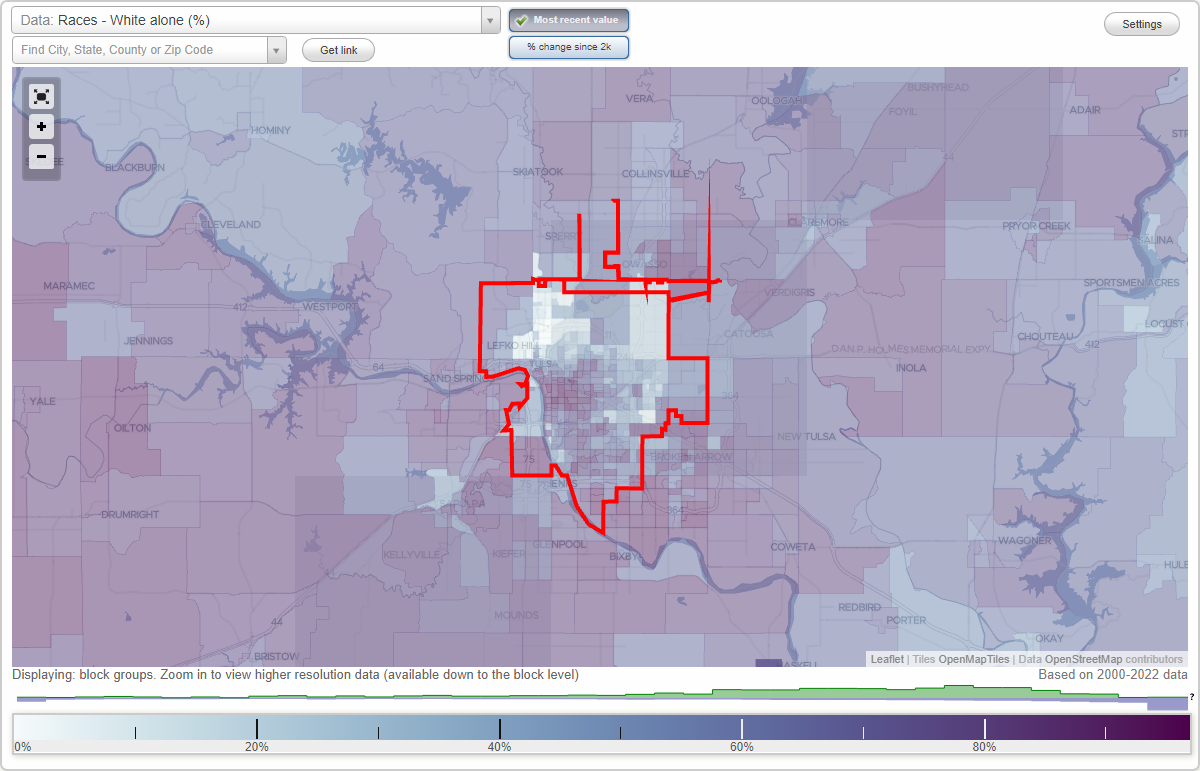
Races - White alone (%)
Races - White alone (% change since 2000)
Races - Black alone (%)
Races - Black alone (% change since 2000)
Races - American Indian alone (%)
Races - American Indian alone (% change since 2000)
Races - Asian alone (%)
Races - Asian alone (% change since 2000)
Races - Hispanic (%)
Races - Hispanic (% change since 2000)
Races - Native Hawaiian and Other Pacific Islander alone (%)
Races - Native Hawaiian and Other Pacific Islander alone (% change since 2000)
Races - Two or more races(%)
Races - Two or more races(% change since 2000)
Races - Other race alone (%)
Races - Other race alone (% change since 2000)
Racial diversity
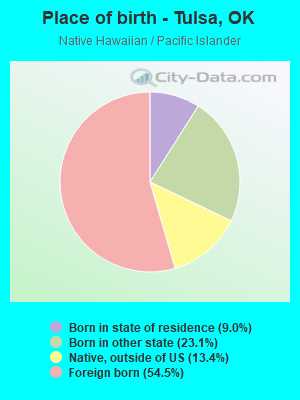
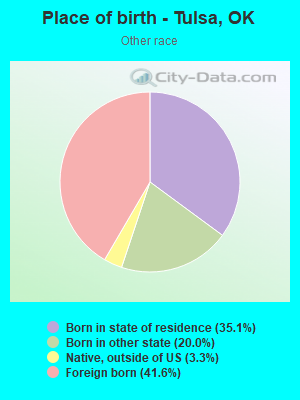
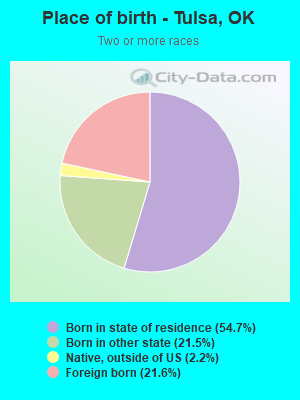
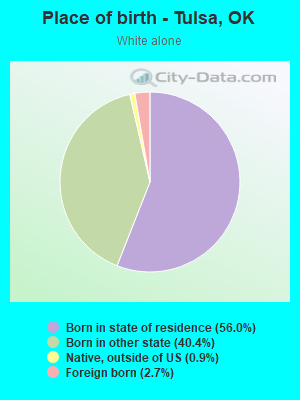
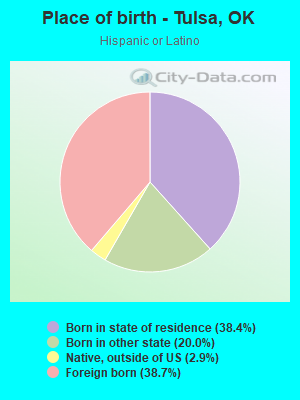
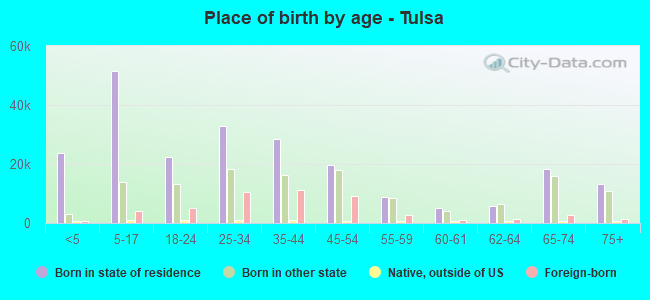
Place of birth - Born in state of residence (%)
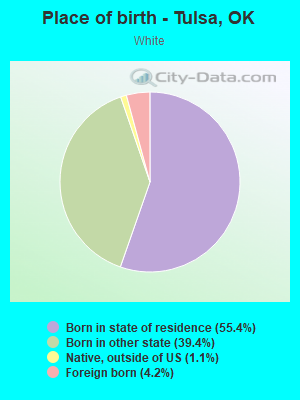
Place of birth - Born in state of residence (%) - White
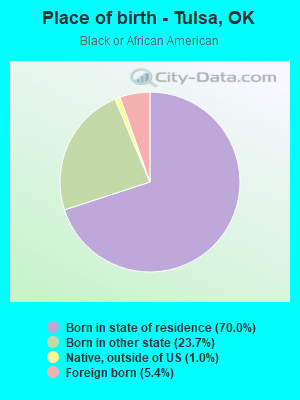
Place of birth - Born in state of residence (%) - Black or African American
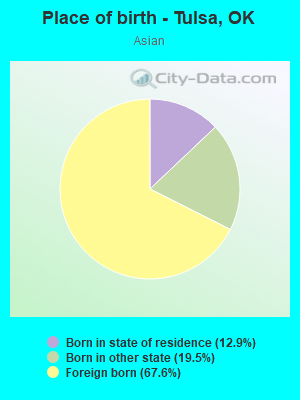
Place of birth - Born in state of residence (%) - Asian
Place of birth - Born in state of residence (%) - Hispanic or Latino
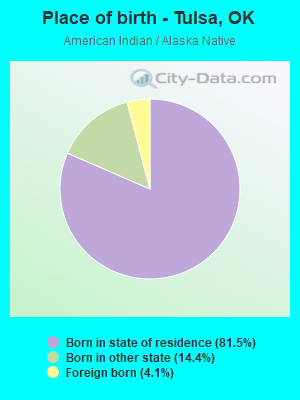
Place of birth - Born in state of residence (%) - American Indian and Alaska Native
Place of birth - Born in state of residence (%) - Multirace
Place of birth - Born in state of residence (%) - Other Race
Place of birth - Born in other state (%)
Place of birth - Born in other state (%) - White
Place of birth - Born in other state (%) - Black or African American
Place of birth - Born in other state (%) - Asian
Place of birth - Born in other state (%) - Hispanic or Latino
Place of birth - Born in other state (%) - American Indian and Alaska Native
Place of birth - Born in other state (%) - Multirace
Place of birth - Born in other state (%) - Other Race
Place of birth - Native, outside of US (%)
Place of birth - Native, outside of US (%) - White
Place of birth - Native, outside of US (%) - Black or African American
Place of birth - Native, outside of US (%) - Asian
Place of birth - Native, outside of US (%) - Hispanic or Latino
Place of birth - Native, outside of US (%) - American Indian and Alaska Native
Place of birth - Native, outside of US (%) - Multirace
Place of birth - Native, outside of US (%) - Other Race
Place of birth - Foreign born (%)
Place of birth - Foreign born (%) - White
Place of birth - Foreign born (%) - Black or African American
Place of birth - Foreign born (%) - Asian
Place of birth - Foreign born (%) - Hispanic or Latino
Place of birth - Foreign born (%) - American Indian and Alaska Native
Place of birth - Foreign born (%) - Multirace
Place of birth - Foreign born (%) - Other Race
Residents speaking English at home (%)
Residents speaking English at home - Born in the United States (%)
Residents speaking English at home - Native, born elsewhere (%)
Residents speaking English at home - Foreign born (%)
Residents speaking Spanish at home (%)
Residents speaking Spanish at home - Born in the United States (%)
Residents speaking Spanish at home - Native, born elsewhere (%)
Residents speaking Spanish at home - Foreign born (%)
Residents speaking other language at home (%)
Residents speaking other language at home - Born in the United States (%)
Residents speaking other language at home - Native, born elsewhere (%)
Residents speaking other language at home - Foreign born (%)
Marital status - Never married (%)
Marital status - Now married (%)
Marital status - Separated (%)
Marital status - Widowed (%)
Marital status - Divorced (%)
Ancestries Reported - Arab (%)
Ancestries Reported - Czech (%)
Ancestries Reported - Danish (%)
Ancestries Reported - Dutch (%)
Ancestries Reported - English (%)
Ancestries Reported - French (%)
Ancestries Reported - French Canadian (%)
Ancestries Reported - German (%)
Ancestries Reported - Greek (%)
Ancestries Reported - Hungarian (%)
Ancestries Reported - Irish (%)
Ancestries Reported - Italian (%)
Ancestries Reported - Lithuanian (%)
Ancestries Reported - Norwegian (%)
Ancestries Reported - Polish (%)
Ancestries Reported - Portuguese (%)
Ancestries Reported - Russian (%)
Ancestries Reported - Scotch-Irish (%)
Ancestries Reported - Scottish (%)
Ancestries Reported - Slovak (%)
Ancestries Reported - Subsaharan African (%)
Ancestries Reported - Swedish (%)
Ancestries Reported - Swiss (%)
Ancestries Reported - Ukrainian (%)
Ancestries Reported - United States (%)
Ancestries Reported - Welsh (%)
Ancestries Reported - West Indian (%)
Ancestries Reported - Other (%)
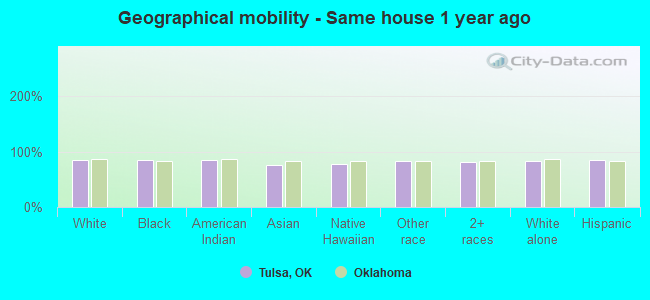
Geographical mobility - Same house 1 year ago (%)
Geographical mobility - Same house 1 year ago (%) - White
Geographical mobility - Same house 1 year ago (%) - Black or African American
Geographical mobility - Same house 1 year ago (%) - Asian
Geographical mobility - Same house 1 year ago (%) - Hispanic or Latino
Geographical mobility - Same house 1 year ago (%) - American Indian and Alaska Native
Geographical mobility - Same house 1 year ago (%) - Multirace
Geographical mobility - Same house 1 year ago (%) - Other Race
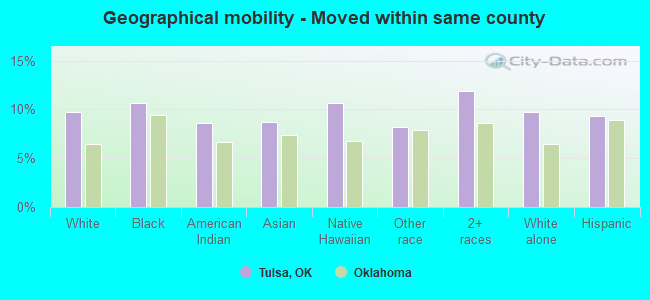
Geographical mobility - Moved within same county (%)
Geographical mobility - Moved within same county (%) - White
Geographical mobility - Moved within same county (%) - Black or African American
Geographical mobility - Moved within same county (%) - Asian
Geographical mobility - Moved within same county (%) - Hispanic or Latino
Geographical mobility - Moved within same county (%) - American Indian and Alaska Native
Geographical mobility - Moved within same county (%) - Multirace
Geographical mobility - Moved within same county (%) - Other Race
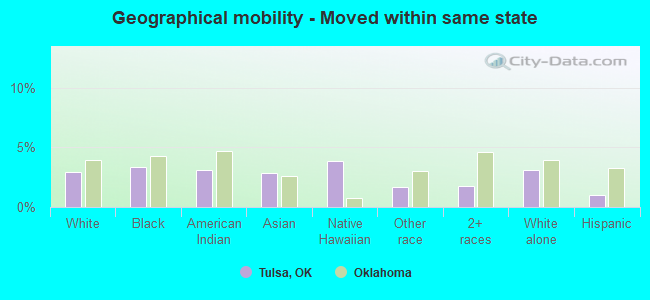
Geographical mobility - Moved from different county within same state (%)
Geographical mobility - Moved from different county within same state (%) - White
Geographical mobility - Moved from different county within same state (%) - Black or African American
Geographical mobility - Moved from different county within same state (%) - Asian
Geographical mobility - Moved from different county within same state (%) - Hispanic or Latino
Geographical mobility - Moved from different county within same state (%) - American Indian and Alaska Native
Geographical mobility - Moved from different county within same state (%) - Multirace
Geographical mobility - Moved from different county within same state (%) - Other Race
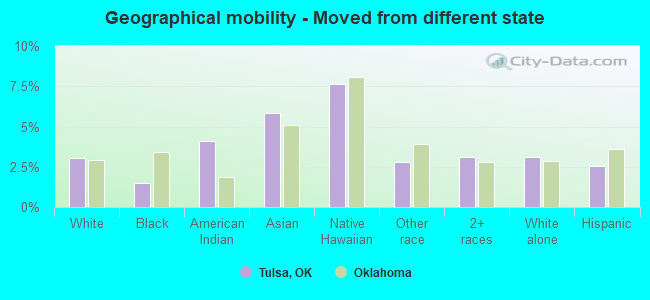
Geographical mobility - Moved from different state (%)
Geographical mobility - Moved from different state (%) - White
Geographical mobility - Moved from different state (%) - Black or African American
Geographical mobility - Moved from different state (%) - Asian
Geographical mobility - Moved from different state (%) - Hispanic or Latino
Geographical mobility - Moved from different state (%) - American Indian and Alaska Native
Geographical mobility - Moved from different state (%) - Multirace
Geographical mobility - Moved from different state (%) - Other Race
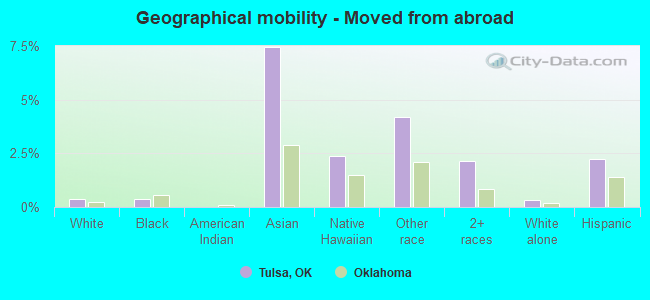
Geographical mobility - Moved from abroad (%)
Geographical mobility - Moved from abroad (%) - White
Geographical mobility - Moved from abroad (%) - Black or African American
Geographical mobility - Moved from abroad (%) - Asian
Geographical mobility - Moved from abroad (%) - Hispanic or Latino
Geographical mobility - Moved from abroad (%) - American Indian and Alaska Native
Geographical mobility - Moved from abroad (%) - Multirace
Geographical mobility - Moved from abroad (%) - Other Race
Place of birth for the foreign-born population - Ireland (%)
Place of birth for the foreign-born population - Denmark (%)
Place of birth for the foreign-born population - Norway (%)
Place of birth for the foreign-born population - Sweden (%)
Place of birth for the foreign-born population - United Kingdom (%)
Place of birth for the foreign-born population - England (%)
Place of birth for the foreign-born population - Scotland (%)
Place of birth for the foreign-born population - Other Northern Europe (%)
Place of birth for the foreign-born population - Austria (%)
Place of birth for the foreign-born population - Belgium (%)
Place of birth for the foreign-born population - France (%)
Place of birth for the foreign-born population - Germany (%)
Place of birth for the foreign-born population - Netherlands (%)
Place of birth for the foreign-born population - Switzerland (%)
Place of birth for the foreign-born population - Other Western Europe (%)
Place of birth for the foreign-born population - Greece (%)
Place of birth for the foreign-born population - Italy (%)
Place of birth for the foreign-born population - Portugal (%)
Place of birth for the foreign-born population - Spain (%)
Place of birth for the foreign-born population - Other Southern Europe (%)
Place of birth for the foreign-born population - Albania (%)
Place of birth for the foreign-born population - Belarus (%)
Place of birth for the foreign-born population - Bosnia and Herzegovina (%)
Place of birth for the foreign-born population - Bulgaria (%)
Place of birth for the foreign-born population - Croatia (%)
Place of birth for the foreign-born population - Czechoslovakia (%)
Place of birth for the foreign-born population - Hungary (%)
Place of birth for the foreign-born population - Latvia (%)
Place of birth for the foreign-born population - Lithuania (%)
Place of birth for the foreign-born population - North Macedonia (Macedonia) (%)
Place of birth for the foreign-born population - Moldova (%)
Place of birth for the foreign-born population - Poland (%)
Place of birth for the foreign-born population - Romania (%)
Place of birth for the foreign-born population - Russia (%)
Place of birth for the foreign-born population - Serbia (%)
Place of birth for the foreign-born population - Ukraine (%)
Place of birth for the foreign-born population - Other Eastern Europe (%)
Place of birth for the foreign-born population - China (%)
Place of birth for the foreign-born population - Hong Kong (%)
Place of birth for the foreign-born population - Taiwan (%)
Place of birth for the foreign-born population - Japan (%)
Place of birth for the foreign-born population - Korea (%)
Place of birth for the foreign-born population - Other Eastern Asia (%)
Place of birth for the foreign-born population - Afghanistan (%)
Place of birth for the foreign-born population - Bangladesh (%)
Place of birth for the foreign-born population - India (%)
Place of birth for the foreign-born population - Iran (%)
Place of birth for the foreign-born population - Kazakhstan (%)
Place of birth for the foreign-born population - Nepal (%)
Place of birth for the foreign-born population - Pakistan (%)
Place of birth for the foreign-born population - Sri Lanka (%)
Place of birth for the foreign-born population - Uzbekistan (%)
Place of birth for the foreign-born population - Other South Central Asia (%)
Place of birth for the foreign-born population - Burma (%)
Place of birth for the foreign-born population - Cambodia (%)
Place of birth for the foreign-born population - Indonesia (%)
Place of birth for the foreign-born population - Laos (%)
Place of birth for the foreign-born population - Malaysia (%)
Place of birth for the foreign-born population - Philippines (%)
Place of birth for the foreign-born population - Singapore (%)
Place of birth for the foreign-born population - Thailand (%)
Place of birth for the foreign-born population - Vietnam (%)
Place of birth for the foreign-born population - Other South Eastern Asia (%)
Place of birth for the foreign-born population - Armenia (%)
Place of birth for the foreign-born population - Iraq (%)
Place of birth for the foreign-born population - Israel (%)
Place of birth for the foreign-born population - Jordan (%)
Place of birth for the foreign-born population - Kuwait (%)
Place of birth for the foreign-born population - Lebanon (%)
Place of birth for the foreign-born population - Saudi Arabia (%)
Place of birth for the foreign-born population - Syria (%)
Place of birth for the foreign-born population - Turkey (%)
Place of birth for the foreign-born population - Yemen (%)
Place of birth for the foreign-born population - Other Western Asia (%)
Place of birth for the foreign-born population - Eritrea (%)
Place of birth for the foreign-born population - Ethiopia (%)
Place of birth for the foreign-born population - Kenya (%)
Place of birth for the foreign-born population - Somalia (%)
Place of birth for the foreign-born population - Uganda (%)
Place of birth for the foreign-born population - Zimbabwe (%)
Place of birth for the foreign-born population - Other Eastern Africa (%)
Place of birth for the foreign-born population - Cameroon (%)
Place of birth for the foreign-born population - Congo (%)
Place of birth for the foreign-born population - Democratic Republic of Congo (Zaire) (%)
Place of birth for the foreign-born population - Other Middle Africa (%)
Place of birth for the foreign-born population - Egypt (%)
Place of birth for the foreign-born population - Morocco (%)
Place of birth for the foreign-born population - Sudan (%)
Place of birth for the foreign-born population - Other Northern Africa (%)
Place of birth for the foreign-born population - South Africa (%)
Place of birth for the foreign-born population - Other Southern Africa (%)
Place of birth for the foreign-born population - Cabo Verde (%)
Place of birth for the foreign-born population - Ghana (%)
Place of birth for the foreign-born population - Liberia (%)
Place of birth for the foreign-born population - Nigeria (%)
Place of birth for the foreign-born population - Senegal (%)
Place of birth for the foreign-born population - Sierra Leone (%)
Place of birth for the foreign-born population - Other Western Africa (%)
Place of birth for the foreign-born population - Australia (%)
Place of birth for the foreign-born population - New Zealand (%)
Place of birth for the foreign-born population - Fiji (%)
Place of birth for the foreign-born population - Micronesia (%)
Place of birth for the foreign-born population - Bahamas (%)
Place of birth for the foreign-born population - Barbados (%)
Place of birth for the foreign-born population - Cuba (%)
Place of birth for the foreign-born population - Dominica (%)
Place of birth for the foreign-born population - Dominican Republic (%)
Place of birth for the foreign-born population - Grenada (%)
Place of birth for the foreign-born population - Haiti (%)
Place of birth for the foreign-born population - Jamaica (%)
Place of birth for the foreign-born population - St. Vincent and the Grenadines (%)
Place of birth for the foreign-born population - Trinidad and Tobago (%)
Place of birth for the foreign-born population - West Indies (%)
Place of birth for the foreign-born population - Other Caribbean (%)
Place of birth for the foreign-born population - Belize (%)
Place of birth for the foreign-born population - Costa Rica (%)
Place of birth for the foreign-born population - El Salvador (%)
Place of birth for the foreign-born population - Guatemala (%)
Place of birth for the foreign-born population - Honduras (%)
Place of birth for the foreign-born population - Mexico (%)
Place of birth for the foreign-born population - Nicaragua (%)
Place of birth for the foreign-born population - Panama (%)
Place of birth for the foreign-born population - Other Central America (%)
Place of birth for the foreign-born population - Argentina (%)
Place of birth for the foreign-born population - Bolivia (%)
Place of birth for the foreign-born population - Brazil (%)
Place of birth for the foreign-born population - Chile (%)
Place of birth for the foreign-born population - Colombia (%)
Place of birth for the foreign-born population - Ecuador (%)
Place of birth for the foreign-born population - Guyana (%)
Place of birth for the foreign-born population - Peru (%)
Place of birth for the foreign-born population - Uruguay (%)
Place of birth for the foreign-born population - Venezuela (%)
Place of birth for the foreign-born population - Other South America (%)
Place of birth for the foreign-born population - Canada (%)
Place of birth for the foreign-born population - Other Northern America (%)
Place of birth for the foreign-born population - Other (%)
Latest news about races in Tulsa, OK collected exclusively by city-data.com from local newspapers, TV, and radio stations
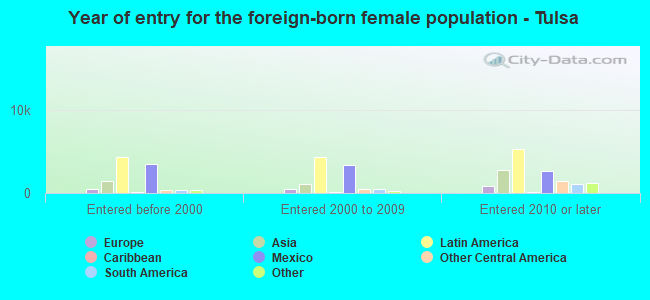
According to 2022 data, the most numerous races in Tulsa, OK are White alone (212,117 residents), Hispanic (75,062 residents), and Two or more races (35,562 residents). 79.9% of Tulsa residents speak English at home. 11.0% of Tulsa, OK residents are foreign-born (6.9% born in Latin America, 2.6% born in Asia), which is 45.3% greater than the foreign-born rate of 6.0% across the entire state of Oklahoma.
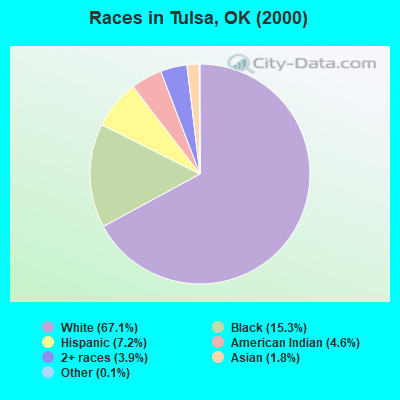
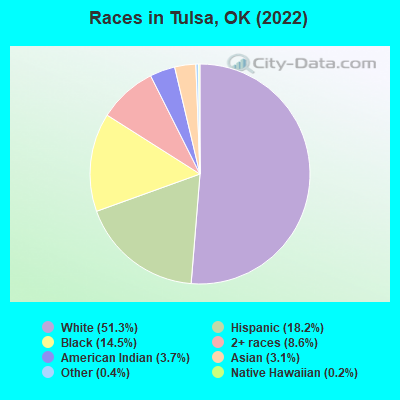
Race distribution in Tulsa
2000 2022
263,782 67.1% White alone 60,297 15.3% Black alone 28,111 7.2% Hispanic 18,005 4.6% American Indian alone 15,135 3.9% Two or more races 7,096 1.8% Asian alone 458 0.1% Other race alone 165 0.04% Native Hawaiian and Other
212,117 51.3% White alone 75,062 18.2% Hispanic 59,789 14.5% Black alone 35,562 8.6% Two or more races 15,089 3.7% American Indian alone 13,010 3.1% Asian alone 1,526 0.4% Other race alone 987 0.2% Native Hawaiian and Other
2000 2022
2,556,368 74.1% White alone 266,158 7.7% American Indian alone 257,981 7.5% Black alone 179,304 5.2% Hispanic 140,249 4.1% Two or more races 46,172 1.3% Asian alone 2,322 0.07% Other race alone 2,100 0.06% Native Hawaiian and Other
2,517,403 62.6% White alone 486,692 12.1% Hispanic 364,453 9.1% Two or more races 273,650 6.8% American Indian alone 268,543 6.7% Black alone 92,672 2.3% Asian alone 10,786 0.3% Other race alone 5,601 0.1% Native Hawaiian and Other
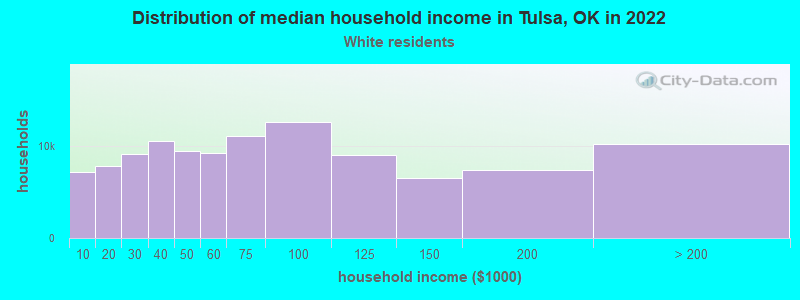
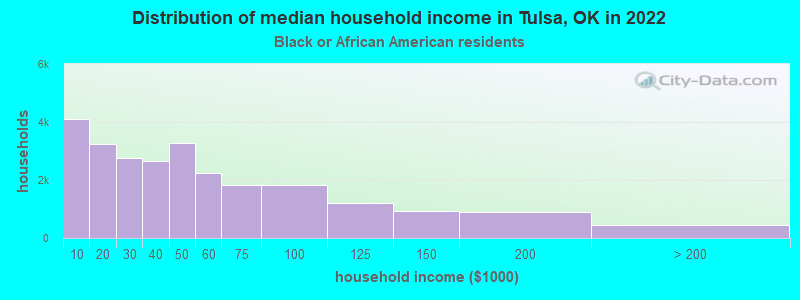
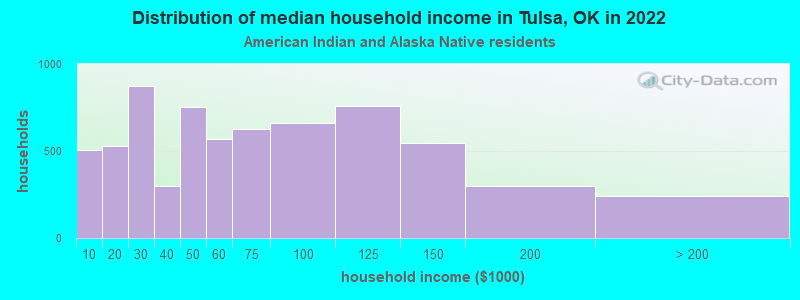
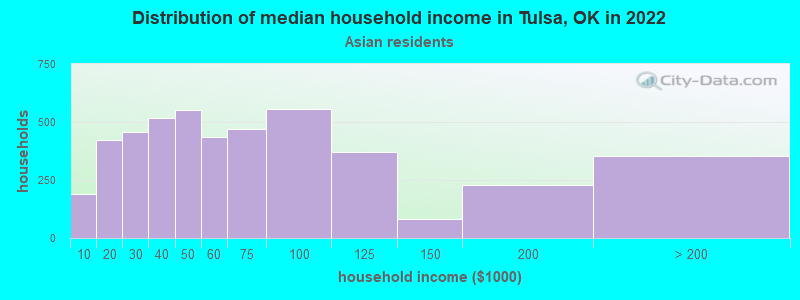
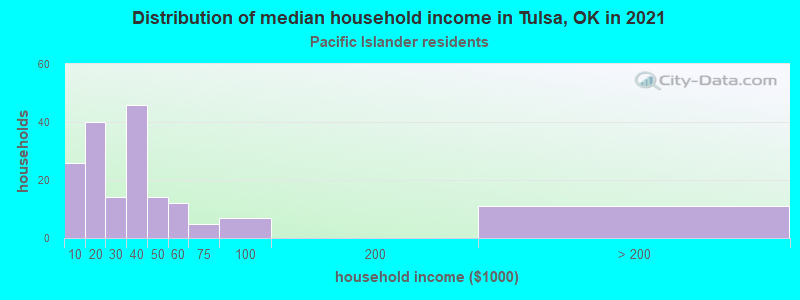
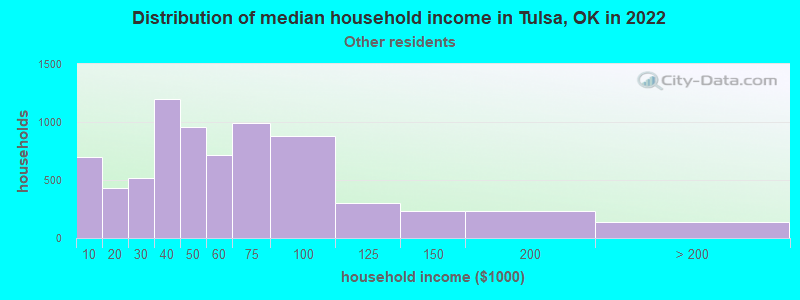
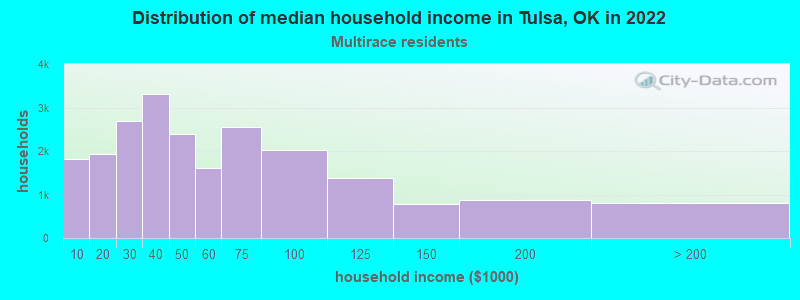
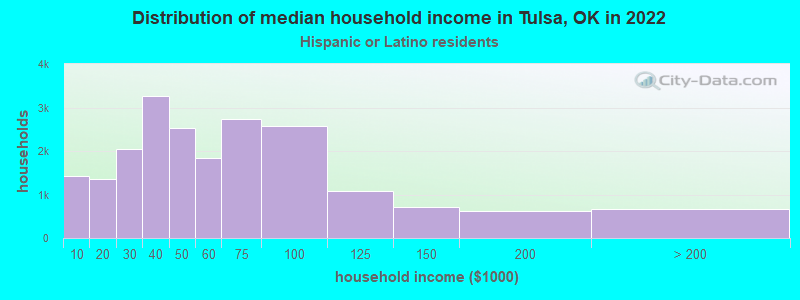
Income and house value in Tulsa Median household income in 2022 $62,411 White non-Hispanic householders$39,779 Black householders$55,880 American Indian and Alaska Native householders$55,970 Asian householders$46,490 Native Hawaiian and other Pacific Islander householders$48,968 Some other race householders$44,320 Two or more races householders$49,162 Hispanic or Latino race householdersMedian 2022 house value $217,878 White Non-Hispanic householders$118,200 Black or African American householders$164,992 American Indian or Alaska Native householders $240,299 Asian householders$178,397 Native Hawaiian and other Pacific Islander householders$134,528 Some other race householders$165,724 Two or more races householders$152,319 Hispanic or Latino householders
Median age by race in Tulsa
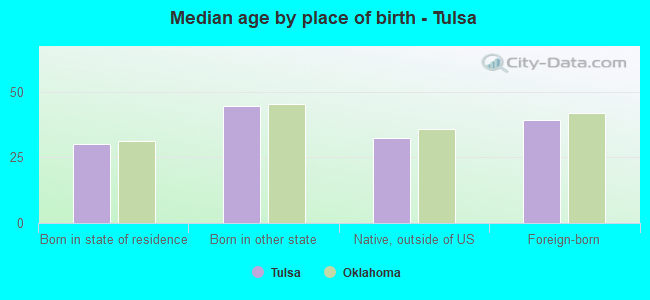
42.0 Median age for White residents40.5 43.3 32.1 Median age for Black or African American residents29.9 33.9 32.9 Median age for American Indian / Alaska Native residents33.6 32.5 30.7 Median age for Asian residents31.9 30.5 29.0 Median age for Native Hawaiian / Pacific Islander residents29.4 22.7 25.0 Median age for Other race residents26.2 23.3 26.1 Median age for Two or more races residents26.5 25.5 43.2 Median age for White alone residents42.0 45.5 23.6 Median age for Hispanic or Latino residents25.1 22.5
Owner/renter occupied households by race in Tulsa
House owners and renters - White residents 62,885 57.4% Owner occupied46,642 42.6% Renter occupiedHouse owners and renters - Black or African American residents 8,541 33.6% Owner occupied16,874 66.4% Renter occupiedHouse owners and renters - American Indian / Alaska Native residents 3,765 56.6% Owner occupied2,891 43.4% Renter occupiedHouse owners and renters - Asian residents 2,253 48.6% Owner occupied2,382 51.4% Renter occupiedHouse owners and renters - Native Hawaiian / Pacific Islander residents 25 12.6% Owner occupied176 87.4% Renter occupiedHouse owners and renters - Other race residents 3,940 54.1% Owner occupied3,349 45.9% Renter occupiedHouse owners and renters - Two or more races residents 8,813 39.8% Owner occupied13,346 60.2% Renter occupiedHouse owners and renters - White alone residents 60,950 57.8% Owner occupied44,443 42.2% Renter occupiedHouse owners and renters - Hispanic or Latino residents 10,105 48.6% Owner occupied10,701 51.4% Renter occupied
Language usage in Tulsa
English speakers - Total 79.9% of residents of Tulsa speak English at home.
14.8% of residents speak Spanish at home 31,600 55.4% Speak English very well25,458 44.6% Speak English less than very well5.3% of residents speak other language at home 12,607 61.3% Speak English very well7,975 38.7% Speak English less than very well
English speakers - Born in the United States 90.1% of residents of Tulsa speak English at home.
7.6% of residents speak Spanish at home 7,464 77.9% Speak English very well2,121 22.1% Speak English less than very well2.2% of residents speak other language at home 2,407 85.7% Speak English very well403 14.3% Speak English less than very well
English speakers - Native, born elsewhere 55.5% of residents of Tulsa speak English at home.
31.9% of residents speak Spanish at home 1,044 61.3% Speak English very well660 38.7% Speak English less than very well12.6% of residents speak other language at home 672 100.0% Speak English very well
English speakers - Foreign-born 12.2% of residents of Tulsa speak English at home.
57.6% of residents speak Spanish at home 7,749 27.7% Speak English very well20,178 72.3% Speak English less than very well30.2% of residents speak other language at home 7,656 52.2% Speak English very well7,001 47.8% Speak English less than very well
White (Caucasian) - Speak only English Native:
95.4% (197,046)Foreign-born:
26.4% (2,499)
White (Caucasian) - Speak another language Native:
4.6% (9,478)Foreign-born:
73.6% (6,984)
Black or African American - Speak only English Native:
97.7% (50,584)Foreign-born:
33.0% (1,073)
Black or African American - Speak another language Native:
2.3% (1,191)Foreign-born:
67.0% (2,178)
American Indian / Alaska Native - Speak only English Native:
90.1% (14,270)Foreign-born:
30.0% (216)
American Indian / Alaska Native - Speak another language Native:
9.9% (1,565)Foreign-born:
70.0% (503)
Asian - Speak only English Native:
38.8% (1,443)Foreign-born:
12.6% (1,113)
Asian - Speak another language Native:
61.2% (2,279)Foreign-born:
87.4% (7,718)
Native Hawaiian / Pacific Islander - Speak only English Native:
56.4% (220)Foreign-born:
24.5% (132)
Native Hawaiian / Pacific Islander - Speak another language Native:
43.6% (170)Foreign-born:
75.5% (406)
Other race - Speak only English Native:
25.5% (3,384)Foreign-born:
3.5% (396)
Other race - Speak another language Native:
74.5% (9,870)Foreign-born:
96.5% (10,915)
Two or more races - Speak only English Native:
77.1% (35,272)Foreign-born:
3.2% (461)
Two or more races - Speak another language Native:
22.9% (10,503)Foreign-born:
96.8% (13,880)
White alone - Speak only English Native:
97.9% (193,362)Foreign-born:
41.8% (2,395)
White alone - Speak another language Native:
2.1% (4,192)Foreign-born:
58.2% (3,334)
Hispanic or Latino - Speak only English Native:
33.6% (12,857)Foreign-born:
3.7% (1,060)
Hispanic or Latino - Speak another language Native:
66.4% (25,444)Foreign-born:
96.3% (27,597)
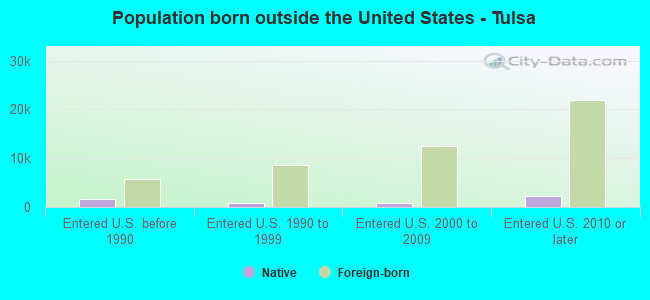
Foreign-born residents in Tulsa 45,778 residents are foreign born (6.9% Latin America , 2.6% Asia ).
This city:
11.0%Oklahoma:
6.1%
Marital status for residents in Tulsa Marital status - White (Caucasian) population 15 years and over
Males 34.6% Never married46.4% Now married1.6% Separated3.4% Widowed14.1% DivorcedFemales 26.8% Never married42.7% Now married2.5% Separated8.9% Widowed19.1% DivorcedWomen who gave birth in the past 12 months Now married:
83.5% (2,414)Unmarried:
16.5% (478)
Women who did not give birth in the past 12 months Now married:
41.9% (20,702)Unmarried:
58.1% (28,696)
Marital status - Black or African American population 15 years and over
Males 52.3% Never married33.5% Now married2.4% Separated1.4% Widowed10.4% DivorcedFemales 48.5% Never married26.0% Now married4.8% Separated6.2% Widowed14.4% DivorcedWomen who gave birth in the past 12 months Now married:
25.3% (228)Unmarried:
74.7% (672)
Women who did not give birth in the past 12 months Now married:
21.7% (3,057)Unmarried:
78.3% (11,036)
Marital status - American Indian / Alaska Native population 15 years and over
Males 44.4% Never married40.7% Now married2.0% Separated2.1% Widowed10.7% DivorcedFemales 37.4% Never married39.7% Now married2.8% Separated4.2% Widowed16.0% DivorcedWomen who gave birth in the past 12 months Now married:
24.9% (94)Unmarried:
75.1% (283)
Women who did not give birth in the past 12 months Now married:
40.5% (1,806)Unmarried:
59.5% (2,651)
Marital status - Asian population 15 years and over
Males 45.7% Never married44.3% Now married5.9% Separated0.0% Widowed4.1% DivorcedFemales 35.9% Never married53.7% Now married0.0% Separated3.8% Widowed6.6% DivorcedWomen who gave birth in the past 12 months Now married:
100.0% (135)Unmarried:
0.0% (0)
Women who did not give birth in the past 12 months Now married:
44.1% (1,842)Unmarried:
55.9% (2,335)
Marital status - Native Hawaiian / Pacific Islander population 15 years and over
Males 28.4% Never married59.5% Now married0.0% Separated0.0% Widowed12.1% DivorcedFemales 36.0% Never married46.8% Now married6.1% Separated2.9% Widowed8.3% DivorcedWomen who gave birth in the past 12 months Now married:
52.6% (24)Unmarried:
47.4% (21)
Women who did not give birth in the past 12 months Now married:
54.4% (116)Unmarried:
45.6% (97)
Marital status - Other race population 15 years and over
Males 46.2% Never married44.7% Now married4.1% Separated1.4% Widowed3.6% DivorcedFemales 41.2% Never married44.2% Now married4.8% Separated2.7% Widowed7.0% DivorcedWomen who gave birth in the past 12 months Now married:
39.7% (259)Unmarried:
60.3% (393)
Women who did not give birth in the past 12 months Now married:
46.3% (3,140)Unmarried:
53.7% (3,643)
Marital status - Two or more races population 15 years and over
Males 46.6% Never married38.6% Now married2.6% Separated1.3% Widowed11.0% DivorcedFemales 45.2% Never married37.9% Now married3.6% Separated3.7% Widowed9.5% DivorcedWomen who gave birth in the past 12 months Now married:
60.3% (491)Unmarried:
39.7% (323)
Women who did not give birth in the past 12 months Now married:
37.2% (6,288)Unmarried:
62.8% (10,631)
Marital status - White alone, not Hispanic / Latino population 15 years and over
Males 33.5% Never married47.0% Now married1.6% Separated3.5% Widowed14.4% DivorcedFemales 25.8% Never married42.9% Now married2.6% Separated9.1% Widowed19.6% DivorcedWomen who gave birth in the past 12 months Now married:
86.0% (2,186)Unmarried:
14.0% (355)
Women who did not give birth in the past 12 months Now married:
42.5% (19,545)Unmarried:
57.5% (26,438)
Marital status - Hispanic or Latino population 15 years and over
Males 46.7% Never married43.2% Now married2.8% Separated1.1% Widowed6.3% DivorcedFemales 41.8% Never married45.7% Now married3.4% Separated2.3% Widowed6.9% DivorcedWomen who gave birth in the past 12 months Now married:
49.5% (816)Unmarried:
50.5% (834)
Women who did not give birth in the past 12 months Now married:
44.9% (8,196)Unmarried:
55.1% (10,073)
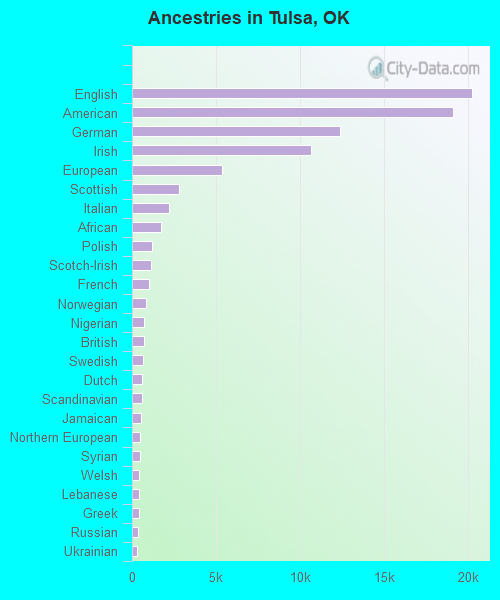
Ancestries in Tulsa
20,268 9.2% English19,162 8.7% American12,391 5.6% German10,664 4.9% Irish5,341 2.4% European2,803 1.3% Scottish2,199 1.0% Italian1,724 0.8% African1,201 0.5% Polish1,144 0.5% Scotch-Irish1,043 0.5% French850 0.4% Norwegian735 0.3% Nigerian693 0.3% British639 0.3% Swedish616 0.3% Dutch594 0.3% Scandinavian519 0.2% Jamaican500 0.2% Northern European485 0.2% Syrian446 0.2% Welsh440 0.2% Lebanese421 0.2% Greek341 0.2% Russian303 0.1% Ukrainian300 0.1% Egyptian297 0.1% Afghan279 0.1% Eastern European262 0.1% Portuguese248 0.1% Brazilian238 0.1% Iranian233 0.1% French Canadian232 0.1% Czech228 0.1% Romanian180 0.08% Haitian168 0.08% Danish157 0.07% Hungarian153 0.07% West Indian150 0.07% Turkish149 0.07% Kenyan142 0.06% Canadian141 0.06% Palestinian140 0.06% Dutch West Indian135 0.06% Finnish110 0.05% Lithuanian107 0.05% Arab99 0.05% Armenian99 0.05% Iraqi90 0.04% Ghanaian81 0.04% Icelander73 0.03% Swiss71 0.03% Croatian71 0.03% Israeli70 0.03% Ethiopian66 0.03% Cajun60 0.03% Ugandan49 0.02% Australian49 0.02% Belizean43 0.02% Bahamian39 0.02% Slavic39 0.02% Jordanian39 0.02% Czechoslovakian37 0.02% Slovene36 0.02% Austrian36 0.02% Liberian28 0.01% Belgian28 0.01% Slovak27 0.01% Barbadian20 0.01% Sudanese19 0.01% Basque19 0.01% Pennsylvania German11 0.01% Trinidadian and Tobagonian11 0.01% Zimbabwean
Geographical mobility in Tulsa Same house 1 year ago 187,893 83.9% White (Caucasian)50,247 84.2% Black or African American14,553 84.2% American Indian / Alaska Native9,853 75.2% Asian608 77.6% Native Hawaiian / Pacific Islander22,521 83.2% Other race52,989 81.0% Two or more races176,108 83.7% White alone, not Hispanic / Latino62,174 84.9% Hispanic or LatinoMoved within same county 21,815 9.7% White / Caucasian6,354 10.6% Black or African American1,490 8.6% American Indian / Alaska Native1,141 8.7% Asian84 10.7% Native Hawaiian / Pacific Islander2,225 8.2% Other race7,799 11.9% Two or more races20,431 9.7% White alone, not Hispanic / Latino6,807 9.3% Hispanic or LatinoMoved within same state 6,657 3.0% White / Caucasian1,994 3.3% Black or African American540 3.1% American Indian / Alaska Native370 2.8% Asian30 3.8% Native Hawaiian / Pacific Islander448 1.7% Other race1,171 1.8% Two or more races6,524 3.1% White alone, not Hispanic / Latino716 1.0% Hispanic or LatinoMoved from different state 6,874 3.1% White / Caucasian889 1.5% Black or African American708 4.1% American Indian / Alaska Native766 5.8% Asian60 7.7% Native Hawaiian / Pacific Islander750 2.8% Other race2,048 3.1% Two or more races6,540 3.1% White alone, not Hispanic / Latino1,858 2.5% Hispanic or LatinoMoved from abroad 841 0.4% White219 0.4% Black or African American979 7.5% Asian19 2.4% Native Hawaiian / Pacific Islander1,132 4.2% Other race1,398 2.1% Two or more races705 0.3% White alone, not Hispanic / Latino1,640 2.2% Hispanic or Latino
Children Nativity (place of birth) in Tulsa
Children under 6 years - Living with two parents Both parents native 11,450 100.0% NativeBoth parents foreign-born 3,682 94.8% Native200 5.2% Foreign-bornOne native, one foreign-born parent 2,700 100.0% NativeChildren under 6 years - Living with one parent Native parent 10,820 100.0% NativeForeign-born parent 1,619 83.1% Native329 16.9% Foreign-bornChildren 6 to 17 years - Living with two parents Both parents native 21,768 99.8% Native33 0.2% Foreign-bornBoth parents foreign-born 7,275 76.3% Native2,265 23.7% Foreign-bornOne native, one foreign-born parent 4,015 93.5% Native279 6.5% Foreign-bornChildren 6 to 17 years - Living with one parent Native parent 20,524 100.0% NativeForeign-born parent 5,061 54.7% Native4,183 45.3% Foreign-born
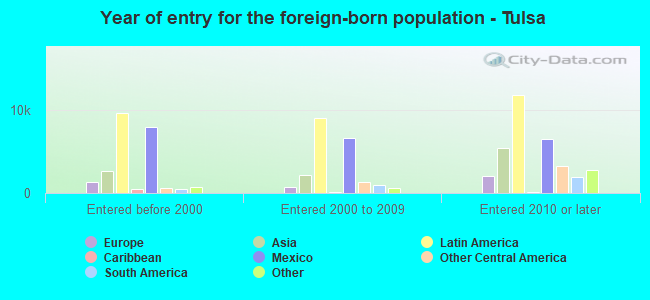
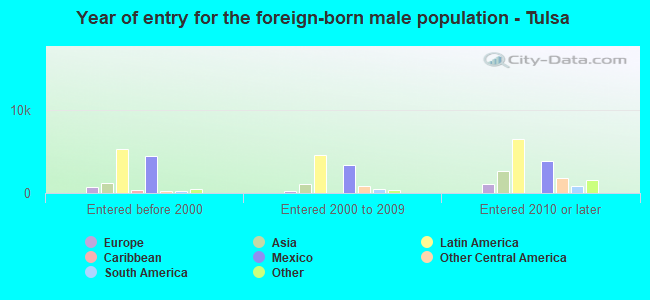
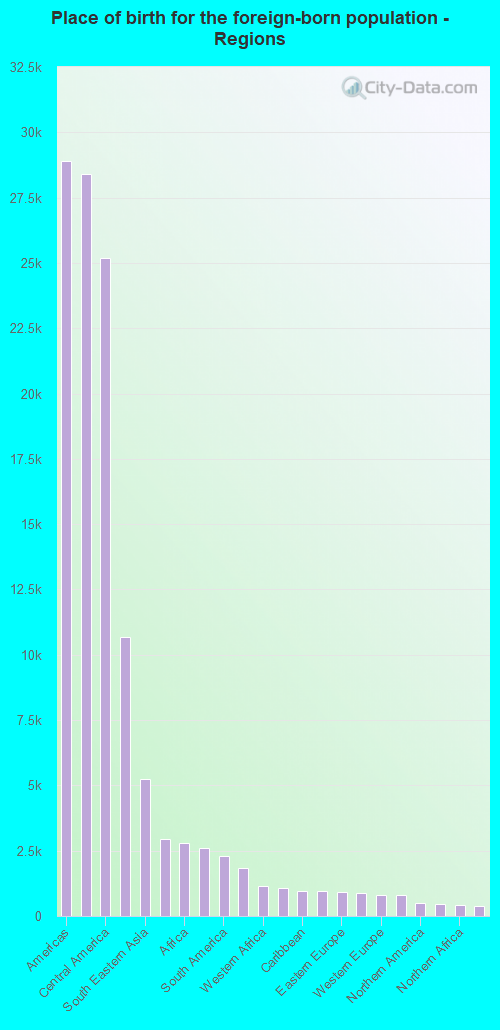
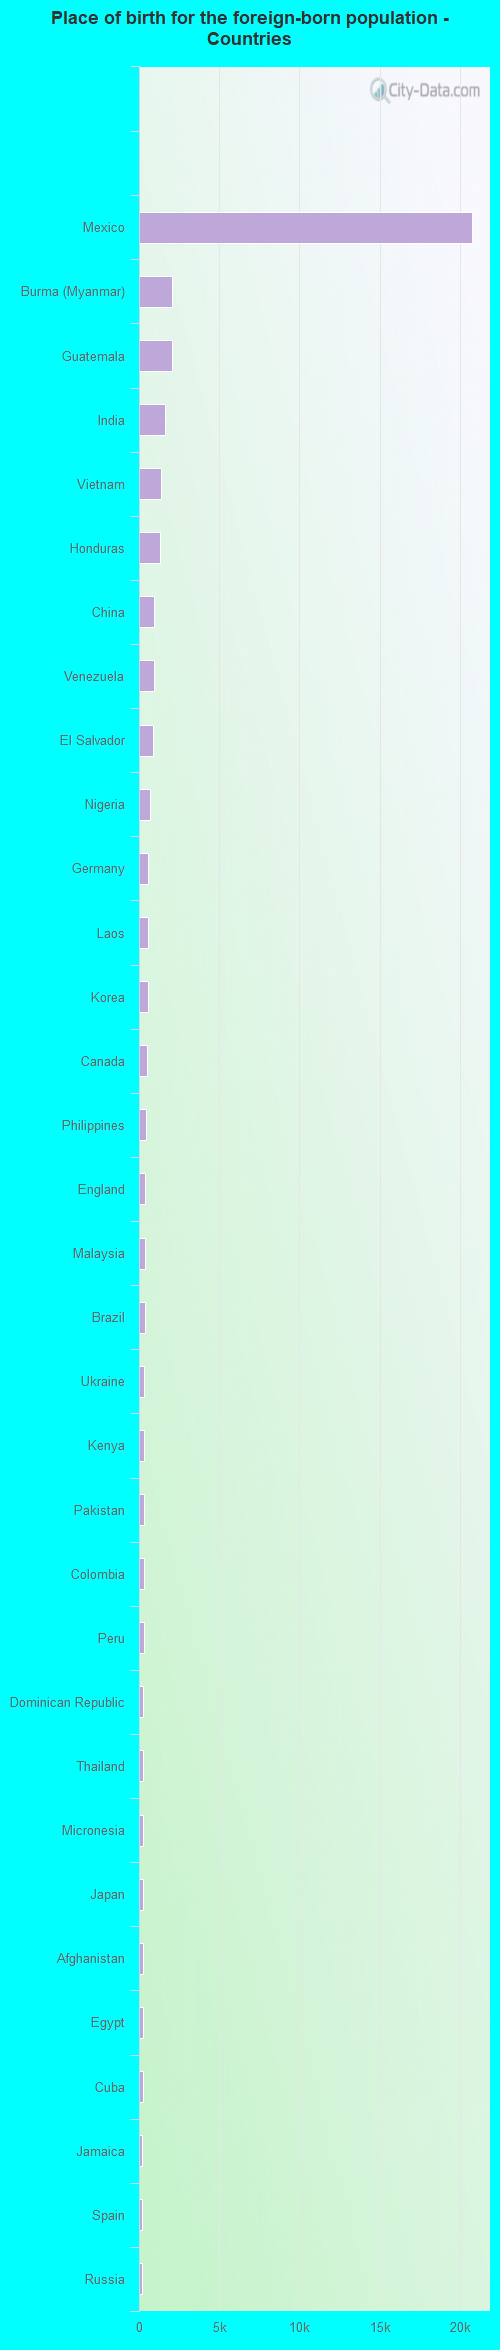
Place of birth for residents in Tulsa 28,913 Americas28,422 Latin America25,186 Central America10,673 Asia5,236 South Eastern Asia2,930 Europe2,791 Africa2,619 South Central Asia2,295 South America1,851 Eastern Asia1,167 Western Africa1,055 China940 Caribbean938 Western Asia926 Eastern Europe885 Eastern Africa815 Western Europe805 Northern Europe491 Northern America469 Oceania412 Northern Africa373 Southern Europe126 Middle Africa101 Australia and New Zealand Subregion76 Southern Africa20,771 Mexico2,074 Burma (Myanmar)2,050 Guatemala1,600 India1,393 Vietnam1,296 Honduras934 China920 Venezuela853 El Salvador690 Nigeria553 Germany539 Laos537 Korea491 Canada466 Philippines403 England385 Malaysia358 Brazil333 Ukraine317 Kenya312 Pakistan310 Colombia310 Peru279 Dominican Republic273 Thailand271 Micronesia258 Japan247 Afghanistan243 Egypt229 Cuba214 Jamaica199 Spain196 Russia177 Iran177 Lebanon168 United Kingdom166 Poland164 Syria162 Ecuador158 Liberia150 Bangladesh122 Ghana116 Saudi Arabia101 Ethiopia92 Netherlands88 Turkey85 Italy84 Indonesia79 Australia77 Iraq76 South Africa76 Chile75 Jordan75 Scotland69 Hong Kong69 Argentina66 Trinidad and Tobago65 France64 Eritrea63 Nepal62 Haiti60 Austria60 Nicaragua56 Democratic Republic of Congo (Zaire)56 Bahamas55 Romania55 Moldova52 Uganda51 Taiwan50 Panama49 Zimbabwe47 Tanzania47 Costa Rica46 Sweden45 Guyana45 Greece44 Kuwait41 Portugal40 Marshall Islands40 Kazakhstan38 Cameroon36 Belgium34 Togo27 Norway27 Bolivia26 Barbados25 Denmark25 Ireland25 Belize23 United Arab Emirates23 Morocco23 Sudan22 Israel22 Congo21 New Zealand19 Belarus18 Yemen18 Czechoslovakia16 Latvia14 Uzbekistan13 Armenia11 Algeria11 Sri Lanka11 Uruguay10 Bulgaria9 Cambodia8 Singapore8 Ivory Coast7 Lithuania6 Switzerland
Grandparents responsible for own grandchildren in Tulsa
Grandparents (30 to 59 years) White / Caucasian 338 30.0% Responsible for grandchildren790 70.0% Not responsible for grandchildrenBlack or African American 412 58.1% Responsible for grandchildren297 41.9% Not responsible for grandchildrenAmerican Indian / Alaska Native 25 39.4% Responsible for grandchildren39 60.6% Not responsible for grandchildrenAsian 81 37.4% Responsible for grandchildren136 62.6% Not responsible for grandchildrenNative Hawaiian / Pacific Islander 13 55.9% Responsible for grandchildren10 44.1% Not responsible for grandchildrenOther race 270 76.1% Responsible for grandchildren85 23.9% Not responsible for grandchildrenTwo or more races 425 63.2% Responsible for grandchildren248 36.8% Not responsible for grandchildrenWhite alone, not Hispanic / Latino 249 25.5% Responsible for grandchildren726 74.5% Not responsible for grandchildrenHispanic or Latino 829 68.4% Responsible for grandchildren383 31.6% Not responsible for grandchildrenGrandparents (60 years and over) White / Caucasian 505 38.1% Responsible for grandchildren819 61.9% Not responsible for grandchildrenBlack or African American 391 76.4% Responsible for grandchildren121 23.6% Not responsible for grandchildrenAmerican Indian / Alaska Native 112 71.1% Responsible for grandchildren46 28.9% Not responsible for grandchildrenAsian 61 20.5% Responsible for grandchildren237 79.5% Not responsible for grandchildrenOther race 159 50.8% Responsible for grandchildren155 49.2% Not responsible for grandchildrenTwo or more races 219 79.1% Responsible for grandchildren58 20.9% Not responsible for grandchildrenWhite alone, not Hispanic / Latino 505 39.0% Responsible for grandchildren789 61.0% Not responsible for grandchildrenHispanic or Latino 138 34.2% Responsible for grandchildren265 65.8% Not responsible for grandchildren
Zip codes: 74103 , 74104 , 74105 , 74106 , 74110 , 74112 , 74114 , 74115 , 74119 , 74120 , 74128 , 74129 , 74130 , 74135 , 74136 , 74145 .