Races in Sunrise, Florida (FL) Detailed Stats
Data:
Races - White alone (%)
Races - White alone (% change since 2000)
Races - Black alone (%)
Races - Black alone (% change since 2000)
Races - American Indian alone (%)
Races - American Indian alone (% change since 2000)
Races - Asian alone (%)
Races - Asian alone (% change since 2000)
Races - Hispanic (%)
Races - Hispanic (% change since 2000)
Races - Native Hawaiian and Other Pacific Islander alone (%)
Races - Native Hawaiian and Other Pacific Islander alone (% change since 2000)
Races - Two or more races(%)
Races - Two or more races(% change since 2000)
Races - Other race alone (%)
Races - Other race alone (% change since 2000)
Racial diversity
Place of birth - Born in state of residence (%)
Place of birth - Born in state of residence (%) - White
Place of birth - Born in state of residence (%) - Black or African American
Place of birth - Born in state of residence (%) - Asian
Place of birth - Born in state of residence (%) - Hispanic or Latino
Place of birth - Born in state of residence (%) - American Indian and Alaska Native
Place of birth - Born in state of residence (%) - Multirace
Place of birth - Born in state of residence (%) - Other Race
Place of birth - Born in other state (%)
Place of birth - Born in other state (%) - White
Place of birth - Born in other state (%) - Black or African American
Place of birth - Born in other state (%) - Asian
Place of birth - Born in other state (%) - Hispanic or Latino
Place of birth - Born in other state (%) - American Indian and Alaska Native
Place of birth - Born in other state (%) - Multirace
Place of birth - Born in other state (%) - Other Race
Place of birth - Native, outside of US (%)
Place of birth - Native, outside of US (%) - White
Place of birth - Native, outside of US (%) - Black or African American
Place of birth - Native, outside of US (%) - Asian
Place of birth - Native, outside of US (%) - Hispanic or Latino
Place of birth - Native, outside of US (%) - American Indian and Alaska Native
Place of birth - Native, outside of US (%) - Multirace
Place of birth - Native, outside of US (%) - Other Race
Place of birth - Foreign born (%)
Place of birth - Foreign born (%) - White
Place of birth - Foreign born (%) - Black or African American
Place of birth - Foreign born (%) - Asian
Place of birth - Foreign born (%) - Hispanic or Latino
Place of birth - Foreign born (%) - American Indian and Alaska Native
Place of birth - Foreign born (%) - Multirace
Place of birth - Foreign born (%) - Other Race
Residents speaking English at home (%)
Residents speaking English at home - Born in the United States (%)
Residents speaking English at home - Native, born elsewhere (%)
Residents speaking English at home - Foreign born (%)
Residents speaking Spanish at home (%)
Residents speaking Spanish at home - Born in the United States (%)
Residents speaking Spanish at home - Native, born elsewhere (%)
Residents speaking Spanish at home - Foreign born (%)
Residents speaking other language at home (%)
Residents speaking other language at home - Born in the United States (%)
Residents speaking other language at home - Native, born elsewhere (%)
Residents speaking other language at home - Foreign born (%)
Marital status - Never married (%)
Marital status - Now married (%)
Marital status - Separated (%)
Marital status - Widowed (%)
Marital status - Divorced (%)
Ancestries Reported - Arab (%)
Ancestries Reported - Czech (%)
Ancestries Reported - Danish (%)
Ancestries Reported - Dutch (%)
Ancestries Reported - English (%)
Ancestries Reported - French (%)
Ancestries Reported - French Canadian (%)
Ancestries Reported - German (%)
Ancestries Reported - Greek (%)
Ancestries Reported - Hungarian (%)
Ancestries Reported - Irish (%)
Ancestries Reported - Italian (%)
Ancestries Reported - Lithuanian (%)
Ancestries Reported - Norwegian (%)
Ancestries Reported - Polish (%)
Ancestries Reported - Portuguese (%)
Ancestries Reported - Russian (%)
Ancestries Reported - Scotch-Irish (%)
Ancestries Reported - Scottish (%)
Ancestries Reported - Slovak (%)
Ancestries Reported - Subsaharan African (%)
Ancestries Reported - Swedish (%)
Ancestries Reported - Swiss (%)
Ancestries Reported - Ukrainian (%)
Ancestries Reported - United States (%)
Ancestries Reported - Welsh (%)
Ancestries Reported - West Indian (%)
Ancestries Reported - Other (%)
Geographical mobility - Same house 1 year ago (%)
Geographical mobility - Same house 1 year ago (%) - White
Geographical mobility - Same house 1 year ago (%) - Black or African American
Geographical mobility - Same house 1 year ago (%) - Asian
Geographical mobility - Same house 1 year ago (%) - Hispanic or Latino
Geographical mobility - Same house 1 year ago (%) - American Indian and Alaska Native
Geographical mobility - Same house 1 year ago (%) - Multirace
Geographical mobility - Same house 1 year ago (%) - Other Race
Geographical mobility - Moved within same county (%)
Geographical mobility - Moved within same county (%) - White
Geographical mobility - Moved within same county (%) - Black or African American
Geographical mobility - Moved within same county (%) - Asian
Geographical mobility - Moved within same county (%) - Hispanic or Latino
Geographical mobility - Moved within same county (%) - American Indian and Alaska Native
Geographical mobility - Moved within same county (%) - Multirace
Geographical mobility - Moved within same county (%) - Other Race
Geographical mobility - Moved from different county within same state (%)
Geographical mobility - Moved from different county within same state (%) - White
Geographical mobility - Moved from different county within same state (%) - Black or African American
Geographical mobility - Moved from different county within same state (%) - Asian
Geographical mobility - Moved from different county within same state (%) - Hispanic or Latino
Geographical mobility - Moved from different county within same state (%) - American Indian and Alaska Native
Geographical mobility - Moved from different county within same state (%) - Multirace
Geographical mobility - Moved from different county within same state (%) - Other Race
Geographical mobility - Moved from different state (%)
Geographical mobility - Moved from different state (%) - White
Geographical mobility - Moved from different state (%) - Black or African American
Geographical mobility - Moved from different state (%) - Asian
Geographical mobility - Moved from different state (%) - Hispanic or Latino
Geographical mobility - Moved from different state (%) - American Indian and Alaska Native
Geographical mobility - Moved from different state (%) - Multirace
Geographical mobility - Moved from different state (%) - Other Race
Geographical mobility - Moved from abroad (%)
Geographical mobility - Moved from abroad (%) - White
Geographical mobility - Moved from abroad (%) - Black or African American
Geographical mobility - Moved from abroad (%) - Asian
Geographical mobility - Moved from abroad (%) - Hispanic or Latino
Geographical mobility - Moved from abroad (%) - American Indian and Alaska Native
Geographical mobility - Moved from abroad (%) - Multirace
Geographical mobility - Moved from abroad (%) - Other Race
Place of birth for the foreign-born population - Ireland (%)
Place of birth for the foreign-born population - Denmark (%)
Place of birth for the foreign-born population - Norway (%)
Place of birth for the foreign-born population - Sweden (%)
Place of birth for the foreign-born population - United Kingdom (%)
Place of birth for the foreign-born population - England (%)
Place of birth for the foreign-born population - Scotland (%)
Place of birth for the foreign-born population - Other Northern Europe (%)
Place of birth for the foreign-born population - Austria (%)
Place of birth for the foreign-born population - Belgium (%)
Place of birth for the foreign-born population - France (%)
Place of birth for the foreign-born population - Germany (%)
Place of birth for the foreign-born population - Netherlands (%)
Place of birth for the foreign-born population - Switzerland (%)
Place of birth for the foreign-born population - Other Western Europe (%)
Place of birth for the foreign-born population - Greece (%)
Place of birth for the foreign-born population - Italy (%)
Place of birth for the foreign-born population - Portugal (%)
Place of birth for the foreign-born population - Spain (%)
Place of birth for the foreign-born population - Other Southern Europe (%)
Place of birth for the foreign-born population - Albania (%)
Place of birth for the foreign-born population - Belarus (%)
Place of birth for the foreign-born population - Bosnia and Herzegovina (%)
Place of birth for the foreign-born population - Bulgaria (%)
Place of birth for the foreign-born population - Croatia (%)
Place of birth for the foreign-born population - Czechoslovakia (%)
Place of birth for the foreign-born population - Hungary (%)
Place of birth for the foreign-born population - Latvia (%)
Place of birth for the foreign-born population - Lithuania (%)
Place of birth for the foreign-born population - North Macedonia (Macedonia) (%)
Place of birth for the foreign-born population - Moldova (%)
Place of birth for the foreign-born population - Poland (%)
Place of birth for the foreign-born population - Romania (%)
Place of birth for the foreign-born population - Russia (%)
Place of birth for the foreign-born population - Serbia (%)
Place of birth for the foreign-born population - Ukraine (%)
Place of birth for the foreign-born population - Other Eastern Europe (%)
Place of birth for the foreign-born population - China (%)
Place of birth for the foreign-born population - Hong Kong (%)
Place of birth for the foreign-born population - Taiwan (%)
Place of birth for the foreign-born population - Japan (%)
Place of birth for the foreign-born population - Korea (%)
Place of birth for the foreign-born population - Other Eastern Asia (%)
Place of birth for the foreign-born population - Afghanistan (%)
Place of birth for the foreign-born population - Bangladesh (%)
Place of birth for the foreign-born population - India (%)
Place of birth for the foreign-born population - Iran (%)
Place of birth for the foreign-born population - Kazakhstan (%)
Place of birth for the foreign-born population - Nepal (%)
Place of birth for the foreign-born population - Pakistan (%)
Place of birth for the foreign-born population - Sri Lanka (%)
Place of birth for the foreign-born population - Uzbekistan (%)
Place of birth for the foreign-born population - Other South Central Asia (%)
Place of birth for the foreign-born population - Burma (%)
Place of birth for the foreign-born population - Cambodia (%)
Place of birth for the foreign-born population - Indonesia (%)
Place of birth for the foreign-born population - Laos (%)
Place of birth for the foreign-born population - Malaysia (%)
Place of birth for the foreign-born population - Philippines (%)
Place of birth for the foreign-born population - Singapore (%)
Place of birth for the foreign-born population - Thailand (%)
Place of birth for the foreign-born population - Vietnam (%)
Place of birth for the foreign-born population - Other South Eastern Asia (%)
Place of birth for the foreign-born population - Armenia (%)
Place of birth for the foreign-born population - Iraq (%)
Place of birth for the foreign-born population - Israel (%)
Place of birth for the foreign-born population - Jordan (%)
Place of birth for the foreign-born population - Kuwait (%)
Place of birth for the foreign-born population - Lebanon (%)
Place of birth for the foreign-born population - Saudi Arabia (%)
Place of birth for the foreign-born population - Syria (%)
Place of birth for the foreign-born population - Turkey (%)
Place of birth for the foreign-born population - Yemen (%)
Place of birth for the foreign-born population - Other Western Asia (%)
Place of birth for the foreign-born population - Eritrea (%)
Place of birth for the foreign-born population - Ethiopia (%)
Place of birth for the foreign-born population - Kenya (%)
Place of birth for the foreign-born population - Somalia (%)
Place of birth for the foreign-born population - Uganda (%)
Place of birth for the foreign-born population - Zimbabwe (%)
Place of birth for the foreign-born population - Other Eastern Africa (%)
Place of birth for the foreign-born population - Cameroon (%)
Place of birth for the foreign-born population - Congo (%)
Place of birth for the foreign-born population - Democratic Republic of Congo (Zaire) (%)
Place of birth for the foreign-born population - Other Middle Africa (%)
Place of birth for the foreign-born population - Egypt (%)
Place of birth for the foreign-born population - Morocco (%)
Place of birth for the foreign-born population - Sudan (%)
Place of birth for the foreign-born population - Other Northern Africa (%)
Place of birth for the foreign-born population - South Africa (%)
Place of birth for the foreign-born population - Other Southern Africa (%)
Place of birth for the foreign-born population - Cabo Verde (%)
Place of birth for the foreign-born population - Ghana (%)
Place of birth for the foreign-born population - Liberia (%)
Place of birth for the foreign-born population - Nigeria (%)
Place of birth for the foreign-born population - Senegal (%)
Place of birth for the foreign-born population - Sierra Leone (%)
Place of birth for the foreign-born population - Other Western Africa (%)
Place of birth for the foreign-born population - Australia (%)
Place of birth for the foreign-born population - New Zealand (%)
Place of birth for the foreign-born population - Fiji (%)
Place of birth for the foreign-born population - Micronesia (%)
Place of birth for the foreign-born population - Bahamas (%)
Place of birth for the foreign-born population - Barbados (%)
Place of birth for the foreign-born population - Cuba (%)
Place of birth for the foreign-born population - Dominica (%)
Place of birth for the foreign-born population - Dominican Republic (%)
Place of birth for the foreign-born population - Grenada (%)
Place of birth for the foreign-born population - Haiti (%)
Place of birth for the foreign-born population - Jamaica (%)
Place of birth for the foreign-born population - St. Vincent and the Grenadines (%)
Place of birth for the foreign-born population - Trinidad and Tobago (%)
Place of birth for the foreign-born population - West Indies (%)
Place of birth for the foreign-born population - Other Caribbean (%)
Place of birth for the foreign-born population - Belize (%)
Place of birth for the foreign-born population - Costa Rica (%)
Place of birth for the foreign-born population - El Salvador (%)
Place of birth for the foreign-born population - Guatemala (%)
Place of birth for the foreign-born population - Honduras (%)
Place of birth for the foreign-born population - Mexico (%)
Place of birth for the foreign-born population - Nicaragua (%)
Place of birth for the foreign-born population - Panama (%)
Place of birth for the foreign-born population - Other Central America (%)
Place of birth for the foreign-born population - Argentina (%)
Place of birth for the foreign-born population - Bolivia (%)
Place of birth for the foreign-born population - Brazil (%)
Place of birth for the foreign-born population - Chile (%)
Place of birth for the foreign-born population - Colombia (%)
Place of birth for the foreign-born population - Ecuador (%)
Place of birth for the foreign-born population - Guyana (%)
Place of birth for the foreign-born population - Peru (%)
Place of birth for the foreign-born population - Uruguay (%)
Place of birth for the foreign-born population - Venezuela (%)
Place of birth for the foreign-born population - Other South America (%)
Place of birth for the foreign-born population - Canada (%)
Place of birth for the foreign-born population - Other Northern America (%)
Place of birth for the foreign-born population - Other (%)
Latest news about races in Sunrise, FL collected exclusively by city-data.com from local newspapers, TV, and radio stations
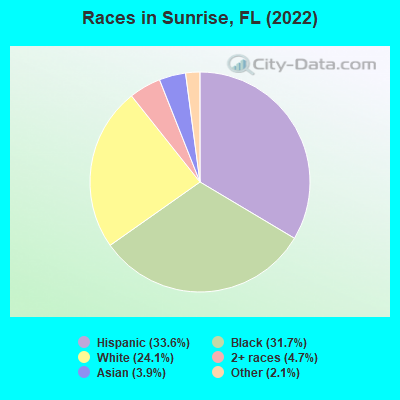
According to 2022 data, the most numerous races in Sunrise, FL are White alone (23,187 residents), Hispanic (32,315 residents), and Black alone (30,534 residents). 57.1% of Sunrise residents speak English at home. 44.8% of Sunrise, FL residents are foreign-born (35.9% born in Latin America), which is 53.1% greater than the foreign-born rate of 21.0% across the entire state of Florida.
Race distribution in Sunrise
2000 2022
48,863 57.0% White alone 17,176 20.0% Black alone 14,655 17.1% Hispanic 2,602 3.0% Asian alone 1,855 2.2% Two or more races 460 0.5% Other race alone 113 0.1% American Indian alone 55 0.06% Native Hawaiian and Other
32,315 33.6% Hispanic 30,534 31.7% Black alone 23,187 24.1% White alone 4,496 4.7% Two or more races 3,749 3.9% Asian alone 2,010 2.1% Other race alone
2000 2022
10,458,509 65.4% White alone 2,682,715 16.8% Hispanic 2,264,268 14.2% Black alone 261,693 1.6% Asian alone 236,954 1.5% Two or more races 42,358 0.3% American Indian alone 28,994 0.2% Other race alone 6,887 0.04% Native Hawaiian and Other
11,309,403 50.8% White alone 6,025,039 27.1% Hispanic 3,241,015 14.6% Black alone 861,630 3.9% Two or more races 623,692 2.8% Asian alone 152,054 0.7% Other race alone 22,504 0.1% American Indian alone 9,486 0.04% Native Hawaiian and Other
Income and house value in Sunrise Median household income in 2022 $79,384 White non-Hispanic householders$70,829 Black householders$160,824 Asian householders$97,295 Some other race householders$59,858 Two or more races householders$72,864 Hispanic or Latino race householdersMedian 2022 house value $403,013 White Non-Hispanic householders$370,603 Black or African American householders$293,453 American Indian or Alaska Native householders $411,468 Asian householders$299,442 Native Hawaiian and other Pacific Islander householders$367,433 Some other race householders$357,921 Two or more races householders$386,104 Hispanic or Latino householders
Median age by race in Sunrise
54.4 Median age for White residents57.0 47.1 40.3 Median age for Black or African American residents37.4 41.7 -666,666,666.0 Median age for American Indian / Alaska Native residents-666,666,666.0 -666,666,666.0 47.7 Median age for Asian residents42.7 48.0 -666,666,666.0 Median age for Native Hawaiian / Pacific Islander residents-666,666,666.0 -666,666,666.0 40.2 Median age for Other race residents40.8 38.3 39.3 Median age for Two or more races residents30.2 46.9 56.2 Median age for White alone residents57.7 47.2 38.1 Median age for Hispanic or Latino residents37.5 41.4
Owner/renter occupied households by race in Sunrise
House owners and renters - White residents 9,536 71.6% Owner occupied3,788 28.4% Renter occupiedHouse owners and renters - Black or African American residents 7,504 67.7% Owner occupied3,584 32.3% Renter occupiedHouse owners and renters - American Indian / Alaska Native residents 39 100.0% Owner occupiedHouse owners and renters - Asian residents 1,168 78.9% Owner occupied312 21.1% Renter occupiedHouse owners and renters - Native Hawaiian / Pacific Islander residents 32 100.0% Owner occupiedHouse owners and renters - Other race residents 2,213 74.0% Owner occupied776 26.0% Renter occupiedHouse owners and renters - Two or more races residents 4,832 61.0% Owner occupied3,085 39.0% Renter occupiedHouse owners and renters - White alone residents 8,666 74.8% Owner occupied2,921 25.2% Renter occupiedHouse owners and renters - Hispanic or Latino residents 6,839 60.3% Owner occupied4,497 39.7% Renter occupied
Language usage in Sunrise
English speakers - Total 57.1% of residents of Sunrise speak English at home.
28.7% of residents speak Spanish at home 15,621 58.4% Speak English very well11,132 41.6% Speak English less than very well14.1% of residents speak other language at home 9,662 73.6% Speak English very well3,474 26.4% Speak English less than very well
English speakers - Born in the United States 83.0% of residents of Sunrise speak English at home.
13.0% of residents speak Spanish at home 2,735 88.7% Speak English very well347 11.3% Speak English less than very well4.0% of residents speak other language at home 901 95.9% Speak English very well39 4.1% Speak English less than very well
English speakers - Native, born elsewhere 42.9% of residents of Sunrise speak English at home.
51.1% of residents speak Spanish at home 955 67.6% Speak English very well458 32.4% Speak English less than very well6.0% of residents speak other language at home 167 100.0% Speak English very well
English speakers - Foreign-born 29.6% of residents of Sunrise speak English at home.
44.8% of residents speak Spanish at home 8,453 46.1% Speak English very well9,900 53.9% Speak English less than very well25.6% of residents speak other language at home 7,040 67.2% Speak English very well3,435 32.8% Speak English less than very well
White (Caucasian) - Speak only English Native:
91.1% (18,710)Foreign-born:
31.2% (1,514)
White (Caucasian) - Speak another language Native:
8.9% (1,826)Foreign-born:
68.8% (3,344)
Black or African American - Speak only English Native:
85.0% (15,307)Foreign-born:
52.0% (7,213)
Black or African American - Speak another language Native:
15.0% (2,708)Foreign-born:
48.0% (6,662)
American Indian / Alaska Native - Speak another language Native:
19.6% (9)Foreign-born:
97.0% (24)
Asian - Speak only English Native:
100.0% (996)Foreign-born:
26.8% (738)
Other race - Speak only English Native:
12.3% (338)Foreign-born:
24.0% (1,696)
Other race - Speak another language Native:
87.7% (2,413)Foreign-born:
76.0% (5,365)
Two or more races - Speak only English Native:
57.7% (5,607)Foreign-born:
7.9% (980)
Two or more races - Speak another language Native:
42.3% (4,114)Foreign-born:
92.1% (11,442)
White alone - Speak only English Native:
93.3% (17,874)Foreign-born:
44.0% (1,514)
White alone - Speak another language Native:
6.7% (1,280)Foreign-born:
56.0% (1,929)
Hispanic or Latino - Speak only English Native:
38.9% (4,861)Foreign-born:
5.8% (1,081)
Hispanic or Latino - Speak another language Native:
61.1% (7,640)Foreign-born:
94.2% (17,639)
Foreign-born residents in Sunrise 43,382 residents are foreign born (35.9% Latin America ).
This city:
44.8%Florida:
21.1%
Marital status for residents in Sunrise Marital status - White (Caucasian) population 15 years and over
Males 27.1% Never married50.6% Now married0.5% Separated9.1% Widowed12.7% DivorcedFemales 23.6% Never married45.8% Now married1.1% Separated10.9% Widowed18.6% DivorcedWomen who gave birth in the past 12 months Now married:
82.4% (246)Unmarried:
17.6% (53)
Women who did not give birth in the past 12 months Now married:
45.8% (2,449)Unmarried:
54.2% (2,895)
Marital status - Black or African American population 15 years and over
Males 38.1% Never married47.8% Now married2.0% Separated0.0% Widowed12.0% DivorcedFemales 48.2% Never married26.7% Now married6.9% Separated5.6% Widowed12.5% DivorcedWomen who gave birth in the past 12 months Now married:
63.3% (402)Unmarried:
36.7% (233)
Women who did not give birth in the past 12 months Now married:
31.0% (2,886)Unmarried:
69.0% (6,429)
Marital status - American Indian / Alaska Native population 15 years and over
Males 38.3% Never married38.3% Now married0.0% Separated0.0% Widowed23.4% DivorcedFemales 0.0% Never married100.0% Now married0.0% Separated0.0% Widowed0.0% DivorcedWomen who did not give birth in the past 12 months Now married:
100.0% (11)Unmarried:
0.0% (0)
Marital status - Asian population 15 years and over
Males 30.1% Never married68.9% Now married0.0% Separated0.5% Widowed0.5% DivorcedFemales 25.2% Never married58.8% Now married0.0% Separated11.6% Widowed4.4% DivorcedWomen who gave birth in the past 12 months Now married:
100.0% (49)Unmarried:
0.0% (0)
Women who did not give birth in the past 12 months Now married:
44.9% (436)Unmarried:
55.1% (535)
Marital status - Other race population 15 years and over
Males 44.6% Never married34.4% Now married10.9% Separated0.0% Widowed10.0% DivorcedFemales 49.2% Never married37.1% Now married0.0% Separated2.5% Widowed11.2% DivorcedWomen who gave birth in the past 12 months Now married:
80.4% (110)Unmarried:
19.6% (27)
Women who did not give birth in the past 12 months Now married:
40.0% (632)Unmarried:
60.0% (949)
Marital status - Two or more races population 15 years and over
Males 36.4% Never married54.2% Now married0.0% Separated0.0% Widowed9.4% DivorcedFemales 32.8% Never married36.4% Now married1.2% Separated8.8% Widowed20.9% DivorcedWomen who gave birth in the past 12 months Now married:
80.4% (204)Unmarried:
19.6% (50)
Women who did not give birth in the past 12 months Now married:
40.5% (2,292)Unmarried:
59.5% (3,373)
Marital status - White alone, not Hispanic / Latino population 15 years and over
Males 29.2% Never married51.4% Now married0.6% Separated10.1% Widowed8.8% DivorcedFemales 24.3% Never married45.8% Now married1.2% Separated11.8% Widowed16.9% DivorcedWomen who gave birth in the past 12 months Now married:
91.7% (227)Unmarried:
8.3% (21)
Women who did not give birth in the past 12 months Now married:
43.8% (1,558)Unmarried:
56.2% (1,999)
Marital status - Hispanic or Latino population 15 years and over
Males 36.0% Never married46.0% Now married3.8% Separated0.0% Widowed14.2% DivorcedFemales 37.5% Never married36.9% Now married0.6% Separated7.1% Widowed17.8% DivorcedWomen who gave birth in the past 12 months Now married:
21.5% (87)Unmarried:
78.5% (318)
Women who did not give birth in the past 12 months Now married:
42.5% (3,270)Unmarried:
57.5% (4,419)
Ancestries in Sunrise
7,486 11.8% Haitian6,833 10.8% Jamaican4,462 7.0% American1,803 2.8% Italian1,117 1.8% English863 1.4% German669 1.1% Irish572 0.9% Guyanese429 0.7% Polish426 0.7% Trinidadian and Tobagonian426 0.7% French Canadian383 0.6% Russian322 0.5% West Indian265 0.4% Palestinian231 0.4% Belizean228 0.4% European205 0.3% British West Indian200 0.3% Romanian199 0.3% Bahamian190 0.3% Eastern European173 0.3% British159 0.3% Israeli156 0.2% Brazilian151 0.2% Egyptian150 0.2% Canadian150 0.2% Greek149 0.2% African146 0.2% French143 0.2% Lebanese103 0.2% Portuguese94 0.1% Nigerian90 0.1% Ukrainian88 0.1% Hungarian80 0.1% Scottish63 0.10% Kenyan56 0.09% Assyrian55 0.09% Northern European54 0.09% Norwegian53 0.08% Armenian49 0.08% Maltese47 0.07% Lithuanian47 0.07% Scotch-Irish40 0.06% Serbian37 0.06% Syrian37 0.06% Slovak32 0.05% Moroccan27 0.04% Turkish27 0.04% Welsh27 0.04% Barbadian26 0.04% Iranian26 0.04% Arab24 0.04% Dutch21 0.03% Swedish20 0.03% Jordanian20 0.03% Bulgarian18 0.03% Liberian11 0.02% Czechoslovakian11 0.02% Belgian11 0.02% Australian9 0.01% South African6 0.01% Scandinavian6 0.01% Ghanaian4 0.01% Swiss
Geographical mobility in Sunrise Same house 1 year ago 25,975 89.2% White (Caucasian)30,028 91.2% Black or African American106 100.0% American Indian / Alaska Native3,944 87.7% Asian26 100.0% Native Hawaiian / Pacific Islander6,174 90.0% Other race24,136 90.6% Two or more races19,634 89.8% White alone, not Hispanic / Latino30,391 89.3% Hispanic or LatinoMoved within same county 2,119 7.3% White / Caucasian2,188 6.6% Black or African American439 9.8% Asian461 6.7% Other race1,792 6.7% Two or more races1,427 6.5% White alone, not Hispanic / Latino2,826 8.3% Hispanic or LatinoMoved within same state 199 0.7% White / Caucasian544 1.7% Black or African American15 0.3% Asian58 0.8% Other race57 0.2% Two or more races54 0.2% White alone, not Hispanic / Latino305 0.9% Hispanic or LatinoMoved from different state 540 1.9% White / Caucasian93 0.3% Black or African American14 0.3% Asian112 1.6% Other race230 0.9% Two or more races544 2.5% White alone, not Hispanic / Latino192 0.6% Hispanic or LatinoMoved from abroad 210 0.7% White88 0.3% Black or African American36 0.8% Asian52 0.8% Other race409 1.5% Two or more races160 0.7% White alone, not Hispanic / Latino311 0.9% Hispanic or Latino
Children Nativity (place of birth) in Sunrise
Children under 6 years - Living with two parents Both parents native 572 100.0% NativeBoth parents foreign-born 518 100.0% NativeOne native, one foreign-born parent 710 100.0% NativeChildren under 6 years - Living with one parent Native parent 1,365 100.0% NativeForeign-born parent 477 88.3% Native63 11.7% Foreign-bornChildren 6 to 17 years - Living with two parents Both parents native 1,683 100.0% NativeBoth parents foreign-born 2,357 62.5% Native1,415 37.5% Foreign-bornOne native, one foreign-born parent 2,681 100.0% NativeChildren 6 to 17 years - Living with one parent Native parent 2,796 100.0% NativeForeign-born parent 3,062 57.0% Native2,313 43.0% Foreign-born
Place of birth for residents in Sunrise 37,542 Americas36,788 Latin America19,446 Caribbean15,126 South America3,828 Asia2,215 Central America1,604 South Central Asia1,572 Europe1,029 Eastern Asia753 Northern America647 Eastern Europe628 South Eastern Asia544 China499 Western Asia439 Africa316 Western Europe309 Northern Europe239 Southern Europe138 Eastern Africa132 Northern Africa126 Western Africa41 Southern Africa6,760 Jamaica6,327 Colombia6,095 Haiti3,554 Venezuela2,583 Cuba1,789 Peru1,534 Trinidad and Tobago1,236 Ecuador1,079 Dominican Republic827 Argentina753 Canada708 Guyana667 India549 Nicaragua494 Pakistan484 Korea483 Mexico474 Philippines451 China368 Bahamas352 Brazil338 Honduras331 St. Lucia247 Bangladesh231 Chile223 Barbados222 El Salvador219 Panama203 Germany198 Guatemala170 Belize166 Russia161 West Indies154 Iran149 Dominica137 England135 Lebanon125 Italy123 Vietnam116 Romania110 Ukraine102 Poland101 France89 Kenya88 Hong Kong88 Israel87 Grenada82 Serbia66 Morocco63 Nigeria61 Sudan60 Kuwait58 Saudi Arabia56 Scotland54 Bolivia51 Iraq47 United Kingdom46 Bulgaria46 Portugal43 Ghana42 Norway41 South Africa40 Syria40 Jordan36 Spain34 Costa Rica30 Thailand30 Greece25 Turkey25 Ireland24 Uzbekistan21 Belarus21 Zimbabwe19 Liberia15 Sri Lanka12 St. Vincent and the Grenadines12 Netherlands9 Uruguay4 Taiwan4 Egypt
Grandparents responsible for own grandchildren in Sunrise
Grandparents (30 to 59 years) White / Caucasian 55 33.5% Responsible for grandchildren109 66.5% Not responsible for grandchildrenBlack or African American 49 40.2% Responsible for grandchildren73 59.8% Not responsible for grandchildrenAsian 24 43.2% Responsible for grandchildren32 56.8% Not responsible for grandchildrenOther race 20 100.0% Not responsible for grandchildrenTwo or more races 38 10.8% Responsible for grandchildren314 89.2% Not responsible for grandchildrenWhite alone, not Hispanic / Latino 61 52.7% Responsible for grandchildren54 47.3% Not responsible for grandchildrenHispanic or Latino 17 5.1% Responsible for grandchildren315 94.9% Not responsible for grandchildrenGrandparents (60 years and over) White / Caucasian 36 9.7% Responsible for grandchildren330 90.3% Not responsible for grandchildrenBlack or African American 151 25.3% Responsible for grandchildren447 74.7% Not responsible for grandchildrenAsian 290 100.0% Not responsible for grandchildrenOther race 12 17.2% Responsible for grandchildren57 82.8% Not responsible for grandchildrenTwo or more races 41 14.3% Responsible for grandchildren242 85.7% Not responsible for grandchildrenWhite alone, not Hispanic / Latino 20 8.1% Responsible for grandchildren225 91.9% Not responsible for grandchildrenHispanic or Latino 41 9.6% Responsible for grandchildren385 90.4% Not responsible for grandchildren