Races in Stuart, Florida (FL) Detailed Stats
Data:
Races - White alone (%)
Races - White alone (% change since 2000)
Races - Black alone (%)
Races - Black alone (% change since 2000)
Races - American Indian alone (%)
Races - American Indian alone (% change since 2000)
Races - Asian alone (%)
Races - Asian alone (% change since 2000)
Races - Hispanic (%)
Races - Hispanic (% change since 2000)
Races - Native Hawaiian and Other Pacific Islander alone (%)
Races - Native Hawaiian and Other Pacific Islander alone (% change since 2000)
Races - Two or more races(%)
Races - Two or more races(% change since 2000)
Races - Other race alone (%)
Races - Other race alone (% change since 2000)
Racial diversity
Place of birth - Born in state of residence (%)
Place of birth - Born in state of residence (%) - White
Place of birth - Born in state of residence (%) - Black or African American
Place of birth - Born in state of residence (%) - Asian
Place of birth - Born in state of residence (%) - Hispanic or Latino
Place of birth - Born in state of residence (%) - American Indian and Alaska Native
Place of birth - Born in state of residence (%) - Multirace
Place of birth - Born in state of residence (%) - Other Race
Place of birth - Born in other state (%)
Place of birth - Born in other state (%) - White
Place of birth - Born in other state (%) - Black or African American
Place of birth - Born in other state (%) - Asian
Place of birth - Born in other state (%) - Hispanic or Latino
Place of birth - Born in other state (%) - American Indian and Alaska Native
Place of birth - Born in other state (%) - Multirace
Place of birth - Born in other state (%) - Other Race
Place of birth - Native, outside of US (%)
Place of birth - Native, outside of US (%) - White
Place of birth - Native, outside of US (%) - Black or African American
Place of birth - Native, outside of US (%) - Asian
Place of birth - Native, outside of US (%) - Hispanic or Latino
Place of birth - Native, outside of US (%) - American Indian and Alaska Native
Place of birth - Native, outside of US (%) - Multirace
Place of birth - Native, outside of US (%) - Other Race
Place of birth - Foreign born (%)
Place of birth - Foreign born (%) - White
Place of birth - Foreign born (%) - Black or African American
Place of birth - Foreign born (%) - Asian
Place of birth - Foreign born (%) - Hispanic or Latino
Place of birth - Foreign born (%) - American Indian and Alaska Native
Place of birth - Foreign born (%) - Multirace
Place of birth - Foreign born (%) - Other Race
Residents speaking English at home (%)
Residents speaking English at home - Born in the United States (%)
Residents speaking English at home - Native, born elsewhere (%)
Residents speaking English at home - Foreign born (%)
Residents speaking Spanish at home (%)
Residents speaking Spanish at home - Born in the United States (%)
Residents speaking Spanish at home - Native, born elsewhere (%)
Residents speaking Spanish at home - Foreign born (%)
Residents speaking other language at home (%)
Residents speaking other language at home - Born in the United States (%)
Residents speaking other language at home - Native, born elsewhere (%)
Residents speaking other language at home - Foreign born (%)
Marital status - Never married (%)
Marital status - Now married (%)
Marital status - Separated (%)
Marital status - Widowed (%)
Marital status - Divorced (%)
Ancestries Reported - Arab (%)
Ancestries Reported - Czech (%)
Ancestries Reported - Danish (%)
Ancestries Reported - Dutch (%)
Ancestries Reported - English (%)
Ancestries Reported - French (%)
Ancestries Reported - French Canadian (%)
Ancestries Reported - German (%)
Ancestries Reported - Greek (%)
Ancestries Reported - Hungarian (%)
Ancestries Reported - Irish (%)
Ancestries Reported - Italian (%)
Ancestries Reported - Lithuanian (%)
Ancestries Reported - Norwegian (%)
Ancestries Reported - Polish (%)
Ancestries Reported - Portuguese (%)
Ancestries Reported - Russian (%)
Ancestries Reported - Scotch-Irish (%)
Ancestries Reported - Scottish (%)
Ancestries Reported - Slovak (%)
Ancestries Reported - Subsaharan African (%)
Ancestries Reported - Swedish (%)
Ancestries Reported - Swiss (%)
Ancestries Reported - Ukrainian (%)
Ancestries Reported - United States (%)
Ancestries Reported - Welsh (%)
Ancestries Reported - West Indian (%)
Ancestries Reported - Other (%)
Geographical mobility - Same house 1 year ago (%)
Geographical mobility - Same house 1 year ago (%) - White
Geographical mobility - Same house 1 year ago (%) - Black or African American
Geographical mobility - Same house 1 year ago (%) - Asian
Geographical mobility - Same house 1 year ago (%) - Hispanic or Latino
Geographical mobility - Same house 1 year ago (%) - American Indian and Alaska Native
Geographical mobility - Same house 1 year ago (%) - Multirace
Geographical mobility - Same house 1 year ago (%) - Other Race
Geographical mobility - Moved within same county (%)
Geographical mobility - Moved within same county (%) - White
Geographical mobility - Moved within same county (%) - Black or African American
Geographical mobility - Moved within same county (%) - Asian
Geographical mobility - Moved within same county (%) - Hispanic or Latino
Geographical mobility - Moved within same county (%) - American Indian and Alaska Native
Geographical mobility - Moved within same county (%) - Multirace
Geographical mobility - Moved within same county (%) - Other Race
Geographical mobility - Moved from different county within same state (%)
Geographical mobility - Moved from different county within same state (%) - White
Geographical mobility - Moved from different county within same state (%) - Black or African American
Geographical mobility - Moved from different county within same state (%) - Asian
Geographical mobility - Moved from different county within same state (%) - Hispanic or Latino
Geographical mobility - Moved from different county within same state (%) - American Indian and Alaska Native
Geographical mobility - Moved from different county within same state (%) - Multirace
Geographical mobility - Moved from different county within same state (%) - Other Race
Geographical mobility - Moved from different state (%)
Geographical mobility - Moved from different state (%) - White
Geographical mobility - Moved from different state (%) - Black or African American
Geographical mobility - Moved from different state (%) - Asian
Geographical mobility - Moved from different state (%) - Hispanic or Latino
Geographical mobility - Moved from different state (%) - American Indian and Alaska Native
Geographical mobility - Moved from different state (%) - Multirace
Geographical mobility - Moved from different state (%) - Other Race
Geographical mobility - Moved from abroad (%)
Geographical mobility - Moved from abroad (%) - White
Geographical mobility - Moved from abroad (%) - Black or African American
Geographical mobility - Moved from abroad (%) - Asian
Geographical mobility - Moved from abroad (%) - Hispanic or Latino
Geographical mobility - Moved from abroad (%) - American Indian and Alaska Native
Geographical mobility - Moved from abroad (%) - Multirace
Geographical mobility - Moved from abroad (%) - Other Race
Place of birth for the foreign-born population - Ireland (%)
Place of birth for the foreign-born population - Denmark (%)
Place of birth for the foreign-born population - Norway (%)
Place of birth for the foreign-born population - Sweden (%)
Place of birth for the foreign-born population - United Kingdom (%)
Place of birth for the foreign-born population - England (%)
Place of birth for the foreign-born population - Scotland (%)
Place of birth for the foreign-born population - Other Northern Europe (%)
Place of birth for the foreign-born population - Austria (%)
Place of birth for the foreign-born population - Belgium (%)
Place of birth for the foreign-born population - France (%)
Place of birth for the foreign-born population - Germany (%)
Place of birth for the foreign-born population - Netherlands (%)
Place of birth for the foreign-born population - Switzerland (%)
Place of birth for the foreign-born population - Other Western Europe (%)
Place of birth for the foreign-born population - Greece (%)
Place of birth for the foreign-born population - Italy (%)
Place of birth for the foreign-born population - Portugal (%)
Place of birth for the foreign-born population - Spain (%)
Place of birth for the foreign-born population - Other Southern Europe (%)
Place of birth for the foreign-born population - Albania (%)
Place of birth for the foreign-born population - Belarus (%)
Place of birth for the foreign-born population - Bosnia and Herzegovina (%)
Place of birth for the foreign-born population - Bulgaria (%)
Place of birth for the foreign-born population - Croatia (%)
Place of birth for the foreign-born population - Czechoslovakia (%)
Place of birth for the foreign-born population - Hungary (%)
Place of birth for the foreign-born population - Latvia (%)
Place of birth for the foreign-born population - Lithuania (%)
Place of birth for the foreign-born population - North Macedonia (Macedonia) (%)
Place of birth for the foreign-born population - Moldova (%)
Place of birth for the foreign-born population - Poland (%)
Place of birth for the foreign-born population - Romania (%)
Place of birth for the foreign-born population - Russia (%)
Place of birth for the foreign-born population - Serbia (%)
Place of birth for the foreign-born population - Ukraine (%)
Place of birth for the foreign-born population - Other Eastern Europe (%)
Place of birth for the foreign-born population - China (%)
Place of birth for the foreign-born population - Hong Kong (%)
Place of birth for the foreign-born population - Taiwan (%)
Place of birth for the foreign-born population - Japan (%)
Place of birth for the foreign-born population - Korea (%)
Place of birth for the foreign-born population - Other Eastern Asia (%)
Place of birth for the foreign-born population - Afghanistan (%)
Place of birth for the foreign-born population - Bangladesh (%)
Place of birth for the foreign-born population - India (%)
Place of birth for the foreign-born population - Iran (%)
Place of birth for the foreign-born population - Kazakhstan (%)
Place of birth for the foreign-born population - Nepal (%)
Place of birth for the foreign-born population - Pakistan (%)
Place of birth for the foreign-born population - Sri Lanka (%)
Place of birth for the foreign-born population - Uzbekistan (%)
Place of birth for the foreign-born population - Other South Central Asia (%)
Place of birth for the foreign-born population - Burma (%)
Place of birth for the foreign-born population - Cambodia (%)
Place of birth for the foreign-born population - Indonesia (%)
Place of birth for the foreign-born population - Laos (%)
Place of birth for the foreign-born population - Malaysia (%)
Place of birth for the foreign-born population - Philippines (%)
Place of birth for the foreign-born population - Singapore (%)
Place of birth for the foreign-born population - Thailand (%)
Place of birth for the foreign-born population - Vietnam (%)
Place of birth for the foreign-born population - Other South Eastern Asia (%)
Place of birth for the foreign-born population - Armenia (%)
Place of birth for the foreign-born population - Iraq (%)
Place of birth for the foreign-born population - Israel (%)
Place of birth for the foreign-born population - Jordan (%)
Place of birth for the foreign-born population - Kuwait (%)
Place of birth for the foreign-born population - Lebanon (%)
Place of birth for the foreign-born population - Saudi Arabia (%)
Place of birth for the foreign-born population - Syria (%)
Place of birth for the foreign-born population - Turkey (%)
Place of birth for the foreign-born population - Yemen (%)
Place of birth for the foreign-born population - Other Western Asia (%)
Place of birth for the foreign-born population - Eritrea (%)
Place of birth for the foreign-born population - Ethiopia (%)
Place of birth for the foreign-born population - Kenya (%)
Place of birth for the foreign-born population - Somalia (%)
Place of birth for the foreign-born population - Uganda (%)
Place of birth for the foreign-born population - Zimbabwe (%)
Place of birth for the foreign-born population - Other Eastern Africa (%)
Place of birth for the foreign-born population - Cameroon (%)
Place of birth for the foreign-born population - Congo (%)
Place of birth for the foreign-born population - Democratic Republic of Congo (Zaire) (%)
Place of birth for the foreign-born population - Other Middle Africa (%)
Place of birth for the foreign-born population - Egypt (%)
Place of birth for the foreign-born population - Morocco (%)
Place of birth for the foreign-born population - Sudan (%)
Place of birth for the foreign-born population - Other Northern Africa (%)
Place of birth for the foreign-born population - South Africa (%)
Place of birth for the foreign-born population - Other Southern Africa (%)
Place of birth for the foreign-born population - Cabo Verde (%)
Place of birth for the foreign-born population - Ghana (%)
Place of birth for the foreign-born population - Liberia (%)
Place of birth for the foreign-born population - Nigeria (%)
Place of birth for the foreign-born population - Senegal (%)
Place of birth for the foreign-born population - Sierra Leone (%)
Place of birth for the foreign-born population - Other Western Africa (%)
Place of birth for the foreign-born population - Australia (%)
Place of birth for the foreign-born population - New Zealand (%)
Place of birth for the foreign-born population - Fiji (%)
Place of birth for the foreign-born population - Micronesia (%)
Place of birth for the foreign-born population - Bahamas (%)
Place of birth for the foreign-born population - Barbados (%)
Place of birth for the foreign-born population - Cuba (%)
Place of birth for the foreign-born population - Dominica (%)
Place of birth for the foreign-born population - Dominican Republic (%)
Place of birth for the foreign-born population - Grenada (%)
Place of birth for the foreign-born population - Haiti (%)
Place of birth for the foreign-born population - Jamaica (%)
Place of birth for the foreign-born population - St. Vincent and the Grenadines (%)
Place of birth for the foreign-born population - Trinidad and Tobago (%)
Place of birth for the foreign-born population - West Indies (%)
Place of birth for the foreign-born population - Other Caribbean (%)
Place of birth for the foreign-born population - Belize (%)
Place of birth for the foreign-born population - Costa Rica (%)
Place of birth for the foreign-born population - El Salvador (%)
Place of birth for the foreign-born population - Guatemala (%)
Place of birth for the foreign-born population - Honduras (%)
Place of birth for the foreign-born population - Mexico (%)
Place of birth for the foreign-born population - Nicaragua (%)
Place of birth for the foreign-born population - Panama (%)
Place of birth for the foreign-born population - Other Central America (%)
Place of birth for the foreign-born population - Argentina (%)
Place of birth for the foreign-born population - Bolivia (%)
Place of birth for the foreign-born population - Brazil (%)
Place of birth for the foreign-born population - Chile (%)
Place of birth for the foreign-born population - Colombia (%)
Place of birth for the foreign-born population - Ecuador (%)
Place of birth for the foreign-born population - Guyana (%)
Place of birth for the foreign-born population - Peru (%)
Place of birth for the foreign-born population - Uruguay (%)
Place of birth for the foreign-born population - Venezuela (%)
Place of birth for the foreign-born population - Other South America (%)
Place of birth for the foreign-born population - Canada (%)
Place of birth for the foreign-born population - Other Northern America (%)
Place of birth for the foreign-born population - Other (%)
Latest news about races in Stuart, FL collected exclusively by city-data.com from local newspapers, TV, and radio stations
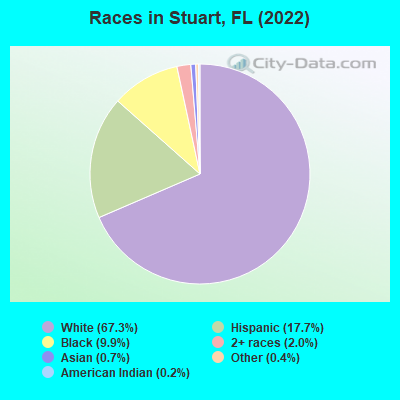
According to 2022 data, the most numerous races in Stuart, FL are White alone (12,063 residents), Hispanic (3,169 residents), and Black alone (1,774 residents). 84.6% of Stuart residents speak English at home. 13.1% of Stuart, FL residents are foreign-born (9.8% born in Latin America, 1.8% born in Europe), which is 59.8% less than the foreign-born rate of 21.0% across the entire state of Florida.
Race distribution in Stuart
2000 2022
10,458,509 65.4% White alone 2,682,715 16.8% Hispanic 2,264,268 14.2% Black alone 261,693 1.6% Asian alone 236,954 1.5% Two or more races 42,358 0.3% American Indian alone 28,994 0.2% Other race alone 6,887 0.04% Native Hawaiian and Other
11,309,403 50.8% White alone 6,025,039 27.1% Hispanic 3,241,015 14.6% Black alone 861,630 3.9% Two or more races 623,692 2.8% Asian alone 152,054 0.7% Other race alone 22,504 0.1% American Indian alone 9,486 0.04% Native Hawaiian and Other
Income and house value in Stuart Median household income in 2022 $77,705 White non-Hispanic householders$39,333 Black householders$90,697 Asian householders$52,502 Two or more races householders$46,887 Hispanic or Latino race householdersMedian 2022 house value $465,852 White Non-Hispanic householders$340,430 Black or African American householders$472,820 American Indian or Alaska Native householders $933,197 Asian householders$443,953 Two or more races householders$403,639 Hispanic or Latino householders
Median age by race in Stuart
60.0 Median age for White residents60.5 60.6 36.9 Median age for Black or African American residents24.3 55.2 -700,813,007.4 Median age for American Indian / Alaska Native residents-465,564,737.8 -924,867,723.9 59.1 Median age for Asian residents74.5 39.6 -666,666,666.0 Median age for Native Hawaiian / Pacific Islander residents-666,666,666.0 -666,666,666.0 16.1 Median age for Other race residents51.5 15.5 29.4 Median age for Two or more races residents24.4 51.9 59.4 Median age for White alone residents59.3 60.6 32.3 Median age for Hispanic or Latino residents31.3 34.7
Owner/renter occupied households by race in Stuart
House owners and renters - White residents 4,145 68.1% Owner occupied1,939 31.9% Renter occupiedHouse owners and renters - Black or African American residents 225 34.1% Owner occupied436 65.9% Renter occupiedHouse owners and renters - American Indian / Alaska Native residents 23 100.0% Renter occupiedHouse owners and renters - Asian residents 28 69.6% Owner occupied12 30.4% Renter occupiedHouse owners and renters - Other race residents 64 39.2% Owner occupied100 60.8% Renter occupiedHouse owners and renters - Two or more races residents 214 18.5% Owner occupied941 81.5% Renter occupiedHouse owners and renters - White alone residents 4,124 69.5% Owner occupied1,812 30.5% Renter occupiedHouse owners and renters - Hispanic or Latino residents 184 16.1% Owner occupied958 83.9% Renter occupied
Language usage in Stuart
English speakers - Total 84.6% of residents of Stuart speak English at home.
11.7% of residents speak Spanish at home 1,253 63.4% Speak English very well722 36.6% Speak English less than very well4.4% of residents speak other language at home 497 67.3% Speak English very well241 32.7% Speak English less than very well
English speakers - Born in the United States 96.1% of residents of Stuart speak English at home.
1.8% of residents speak Spanish at home 71 43.6% Speak English very well92 56.4% Speak English less than very well2.6% of residents speak other language at home 179 77.2% Speak English very well53 22.8% Speak English less than very well
English speakers - Native, born elsewhere 94.5% of residents of Stuart speak English at home.
17.1% of residents speak Spanish at home 43 69.4% Speak English very well19 30.6% Speak English less than very well5.8% of residents speak other language at home 10 47.6% Speak English very well11 52.4% Speak English less than very well
English speakers - Foreign-born 26.0% of residents of Stuart speak English at home.
62.5% of residents speak Spanish at home 778 56.3% Speak English very well603 43.7% Speak English less than very well19.7% of residents speak other language at home 257 59.1% Speak English very well178 40.9% Speak English less than very well
White (Caucasian) - Speak only English Native:
96.7% (11,064)Foreign-born:
52.5% (230)
White (Caucasian) - Speak another language Native:
3.3% (383)Foreign-born:
45.1% (198)
Black or African American - Speak only English Native:
95.1% (1,752)Foreign-born:
65.0% (248)
Black or African American - Speak another language Native:
4.8% (88)Foreign-born:
33.7% (129)
Asian - Speak only English Native:
100.0% (21)Foreign-born:
38.7% (53)
Other race - Speak another language Native:
58.5% (172)Foreign-born:
94.6% (129)
Two or more races - Speak only English Native:
67.0% (756)Foreign-born:
4.1% (75)
Two or more races - Speak another language Native:
33.2% (374)Foreign-born:
99.5% (1,830)
White alone - Speak only English Native:
98.0% (11,016)Foreign-born:
63.3% (250)
White alone - Speak another language Native:
2.0% (228)Foreign-born:
37.2% (147)
Hispanic or Latino - Speak only English Native:
55.2% (770)Foreign-born:
4.9% (68)
Hispanic or Latino - Speak another language Native:
45.2% (631)Foreign-born:
96.9% (1,352)
Foreign-born residents in Stuart 2,356 residents are foreign born (9.8% Latin America , 1.8% Europe ).
This city:
13.1%Florida:
21.1%
Marital status for residents in Stuart Marital status - White (Caucasian) population 15 years and over
Males 25.4% Never married49.0% Now married2.5% Separated7.4% Widowed15.7% DivorcedFemales 17.3% Never married42.6% Now married1.6% Separated21.3% Widowed17.3% DivorcedWomen who gave birth in the past 12 months Now married:
30.3% (19)Unmarried:
69.7% (43)
Women who did not give birth in the past 12 months Now married:
38.4% (638)Unmarried:
61.6% (1,023)
Marital status - Black or African American population 15 years and over
Males 66.2% Never married20.8% Now married9.8% Separated0.5% Widowed2.7% DivorcedFemales 54.3% Never married21.0% Now married10.5% Separated4.7% Widowed9.5% DivorcedWomen who gave birth in the past 12 months Now married:
97.2% (35)Unmarried:
2.8% (1)
Women who did not give birth in the past 12 months Now married:
17.8% (104)Unmarried:
82.2% (480)
Marital status - American Indian / Alaska Native population 15 years and over
Males 0.0% Never married100.0% Now married0.0% Separated0.0% Widowed0.0% DivorcedFemales 0.0% Never married100.0% Now married0.0% Separated0.0% Widowed0.0% DivorcedMarital status - Asian population 15 years and over
Males 54.7% Never married5.7% Now married0.0% Separated39.6% Widowed0.0% DivorcedFemales 79.2% Never married20.8% Now married0.0% Separated0.0% Widowed0.0% DivorcedWomen who did not give birth in the past 12 months Now married:
20.8% (21)Unmarried:
79.2% (79)
Marital status - Other race population 15 years and over
Males 4.3% Never married95.7% Now married0.0% Separated0.0% Widowed0.0% DivorcedFemales 53.2% Never married34.7% Now married0.0% Separated12.1% Widowed0.0% DivorcedWomen who gave birth in the past 12 months Now married:
100.0% (7)Unmarried:
0.0% (0)
Women who did not give birth in the past 12 months Now married:
0.0% (0)Unmarried:
100.0% (132)
Marital status - Two or more races population 15 years and over
Males 51.9% Never married40.1% Now married0.0% Separated0.0% Widowed8.0% DivorcedFemales 40.4% Never married34.5% Now married6.2% Separated4.5% Widowed14.4% DivorcedWomen who did not give birth in the past 12 months Now married:
42.3% (367)Unmarried:
57.7% (502)
Marital status - White alone, not Hispanic / Latino population 15 years and over
Males 24.6% Never married48.5% Now married2.7% Separated7.5% Widowed16.7% DivorcedFemales 16.5% Never married43.6% Now married1.6% Separated20.5% Widowed17.7% DivorcedWomen who gave birth in the past 12 months Now married:
26.4% (14)Unmarried:
73.6% (38)
Women who did not give birth in the past 12 months Now married:
38.8% (639)Unmarried:
61.2% (1,008)
Marital status - Hispanic or Latino population 15 years and over
Males 46.0% Never married46.8% Now married0.0% Separated2.2% Widowed5.1% DivorcedFemales 43.8% Never married28.3% Now married7.4% Separated8.9% Widowed11.6% DivorcedWomen who gave birth in the past 12 months Now married:
86.8% (54)Unmarried:
13.2% (8)
Women who did not give birth in the past 12 months Now married:
32.0% (250)Unmarried:
68.0% (530)
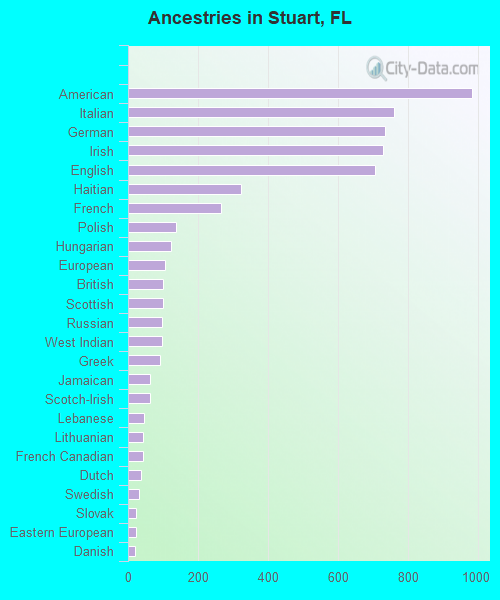
Ancestries in Stuart
981 10.3% American759 7.9% Italian733 7.7% German727 7.6% Irish704 7.4% English323 3.4% Haitian264 2.8% French137 1.4% Polish123 1.3% Hungarian105 1.1% European100 1.0% British100 1.0% Scottish98 1.0% Russian96 1.0% West Indian90 0.9% Greek64 0.7% Jamaican63 0.7% Scotch-Irish46 0.5% Lebanese44 0.5% Lithuanian43 0.4% French Canadian38 0.4% Dutch32 0.3% Swedish24 0.3% Slovak23 0.2% Eastern European19 0.2% Danish15 0.2% Welsh14 0.1% Trinidadian and Tobagonian13 0.1% Cajun12 0.1% Portuguese11 0.1% Iranian10 0.1% Canadian9 0.09% Slovene6 0.06% Norwegian6 0.06% African2 0.02% Arab2 0.02% Scandinavian
Geographical mobility in Stuart Same house 1 year ago 10,772 88.6% White (Caucasian)1,914 100.0% Black or African American155 99.2% Asian602 100.0% Other race2,160 79.0% Two or more races10,594 88.4% White alone, not Hispanic / Latino2,711 89.5% Hispanic or LatinoMoved within same county 506 4.2% White / Caucasian23 1.2% Black or African American323 11.8% Two or more races490 4.1% White alone, not Hispanic / Latino150 5.0% Hispanic or LatinoMoved within same state 247 2.0% White / Caucasian16 0.9% Black or African American32 86.0% American Indian / Alaska Native3 1.9% Asian75 2.7% Two or more races239 2.0% White alone, not Hispanic / Latino45 1.5% Hispanic or LatinoMoved from different state 593 4.9% White / Caucasian4 0.2% Black or African American600 5.0% White alone, not Hispanic / LatinoMoved from abroad 23 0.2% White190 6.9% Two or more races38 0.3% White alone, not Hispanic / Latino94 3.1% Hispanic or Latino
Children Nativity (place of birth) in Stuart
Children under 6 years - Living with two parents Both parents native 220 100.0% NativeBoth parents foreign-born 178 100.0% NativeOne native, one foreign-born parent 158 100.0% NativeChildren under 6 years - Living with one parent Native parent 410 100.0% NativeForeign-born parent 103 100.0% NativeChildren 6 to 17 years - Living with two parents Both parents native 257 86.3% Native41 13.7% Foreign-bornBoth parents foreign-born 192 74.6% Native65 25.4% Foreign-bornOne native, one foreign-born parent 95 100.0% NativeChildren 6 to 17 years - Living with one parent Native parent 666 100.0% NativeForeign-born parent 82 49.6% Native83 50.4% Foreign-born
Grandparents responsible for own grandchildren in Stuart
Grandparents (30 to 59 years) White / Caucasian 27 53.0% Responsible for grandchildren24 47.0% Not responsible for grandchildrenBlack or African American 5 21.9% Responsible for grandchildren19 78.1% Not responsible for grandchildrenWhite alone, not Hispanic / Latino 32 51.2% Responsible for grandchildren30 48.8% Not responsible for grandchildrenGrandparents (60 years and over) White / Caucasian 24 27.2% Responsible for grandchildren65 72.8% Not responsible for grandchildrenBlack or African American 6 15.2% Responsible for grandchildren35 84.8% Not responsible for grandchildrenWhite alone, not Hispanic / Latino 30 30.0% Responsible for grandchildren69 70.0% Not responsible for grandchildren