Races in Sterling, Connecticut (CT) Detailed Stats
Ancestries, Foreign-born residents, place of birth

Recent posts about races in Sterling, Connecticut on our local forum with over 2,400,000 registered users:
 | 2024 Connecticut Town Tournament VI (Celebrating the 10-Year Anniversary & Dazzleman's Memorial) (823 replies) |
| Connecticut This & That (254 replies) |
| Connecticut TOWN TOURNAMENT IV (2020) (849 replies) |
| Connecticut Golf Courses / Golf Clubs (10 replies) |
| Debate about towns in CT (66 replies) |
| Connecticut Weather Discussion (9637 replies) |
Latest news about races in Sterling, CT collected exclusively by city-data.com from local newspapers, TV, and radio stations
1.6% of Sterling, CT residents are foreign-born , which is 848.7% less than the foreign-born rate of 15.0% across the entire state of Connecticut.
Race distribution in Sterling

- 2,95295.3%White alone
- 682.2%Two or more races
- 411.3%Hispanic
- 210.7%American Indian alone
- 100.3%Asian alone
- 40.1%Black alone
- 20.06%Other race alone
- 10.03%Native Hawaiian and Other
Pacific Islander alone
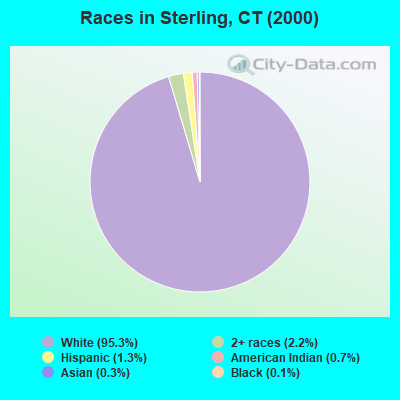
2000
2022
-
- 2,638,84577.5%White alone
- 320,3239.4%Hispanic
- 295,5718.7%Black alone
- 81,5642.4%Asian alone
- 52,8961.6%Two or more races
- 8,1410.2%Other race alone
- 7,2670.2%American Indian alone
- 9580.03%Native Hawaiian and Other
Pacific Islander alone

-
- 2,246,91362.0%White alone
- 658,97818.2%Hispanic
- 353,9739.8%Black alone
- 172,9294.8%Asian alone
- 159,6314.4%Two or more races
- 29,7610.8%Other race alone
- 3,4280.09%American Indian alone
- 5920.02%Native Hawaiian and Other
Pacific Islander alone

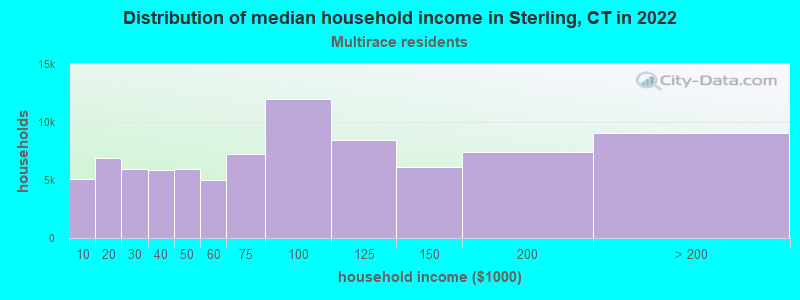
Income and house value in Sterling
- Median household income in 2022
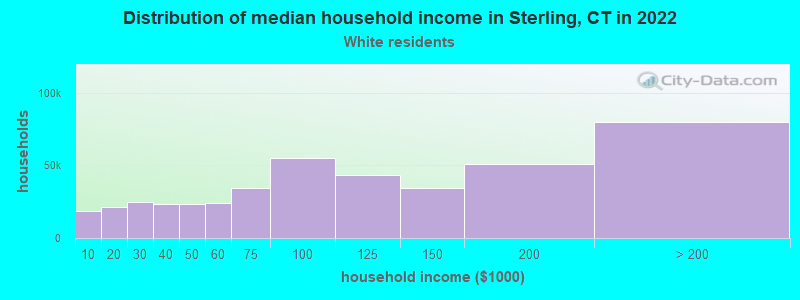
- $85,746White non-Hispanic householders
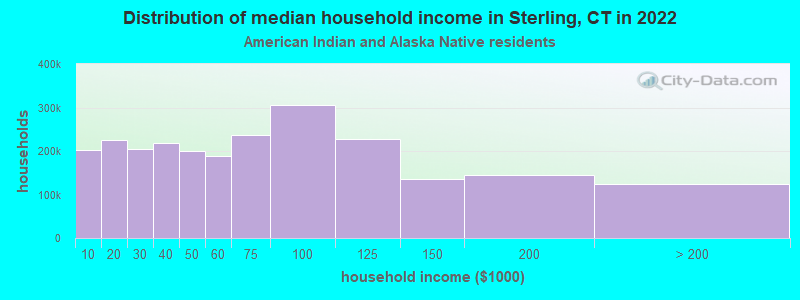
- $80,416American Indian and Alaska Native householders
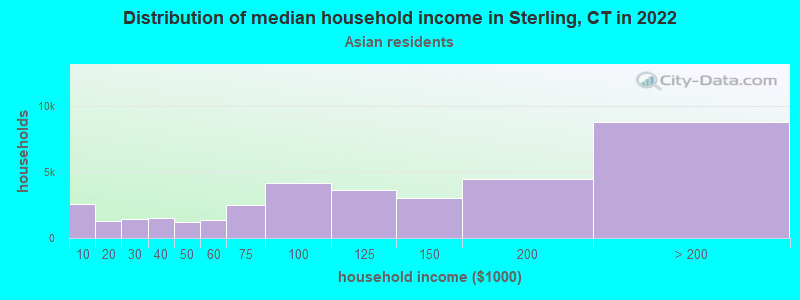
- $90,203Asian householders
- $46,486Some other race householders
- $57,224Two or more races householders
- Median 2022 house value
- $252,076White Non-Hispanic householders
- $243,212American Indian or Alaska Native householders
- $243,212Some other race householders
- $302,665Two or more races householders
Household income for White non-Hispanic householders
Household income for American Indian and Alaska Native householders
Household income for Asian householders
Household income for Two or more races householders
Foreign-born residents in Sterling
49 residents are foreign born
| This city: | 1.6% |
| Connecticut: | 10.9% |
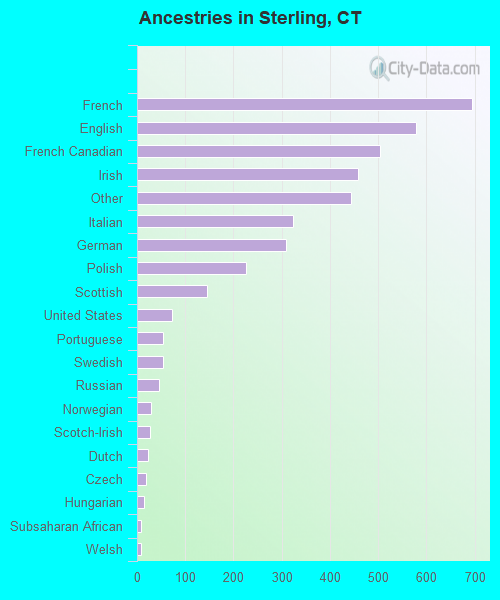
Ancestries in Sterling

- 69517.1%French
- 57814.3%English
- 50312.4%French Canadian
- 45911.3%Irish
- 44411.0%Other
- 3238.0%Italian
- 3097.6%German
- 2265.6%Polish
- 1453.6%Scottish
- 721.8%United States
- 541.3%Portuguese
- 541.3%Swedish
- 461.1%Russian
- 290.7%Norwegian
- 260.6%Scotch-Irish
- 220.5%Dutch
- 180.4%Czech
- 140.3%Hungarian
- 90.2%Subsaharan African
- 80.2%Welsh
- 60.1%Lithuanian
- 50.1%Arab
- 50.1%Danish
- 30.07%Ukrainian
Zip codes: 06377.